School of Innovation, Design and Technology
CH Industry AB Eskilstuna Sweden
Visualization of Environmental Waste
by Manufacturing – Equip VSM with
Green Perspective
Master thesis work
30 credits, D-level
Master Programme in Product and Process Development - Production and Logistics
Juebin Hu
Shan Lu
Report code:
Commissioned by: Mälardalen University Tutor (company): Anders Lundgren Tutor (university): Mats Jackson Examiner: Sabah Audo
Abstract
This thesis is a subtask of the research project “Green Production System”, which is jointly launched and run by Volvo/Volvo Technology, Haldex, Saab and All-Emballage J.E. AB as industrial party, and Mälardalen University as academic party. The whole project is dedicated to develop “green production system” to be a competitive mean to Swedish automotive and manufacturing industry through four work packages, which are “Wet preconditions and frames of a green production system”, “Visualization of environmental impact and added value”, “Development and implementation of tools for green control and management” and “Development of guidelines for environmental value improvement and cost decrease” respectively. And this thesis is an effort to package 2. Value stream mapping is assumed to be a potentially effective tool to be developed for visualizing environmental wastes produced by production processes. Thereby, the focus of this thesis is on the transformation of VSM into EVSM (Environmental Value Stream Mapping).
By reviewing literature, the reduction of environmental wastes is additionally counted into a characteristic of lean production. Meanwhile, seven environmental wastes are identified and defined. The development of EVSM is on an absolutely great degree based on the identification and measurement of environmental wastes. Thus, waste measurement and production data collection are supposed to be the prerequisite of EVSM implementation. In order to verify the supposition, a test practice was carried out in CH Industry AB, which is a metal processor. After the practical study, CH’s incompetence of working on EVSM is analysed, and advice is proposed.
At the end of thesis, analysis of EVSM is made in terms of its prerequisite, difference from VSM, pros and cons, etc. In addition, suggestions for further research are given.
Acknowledgements
There are too many people we want to thank, because if it hadn’t been for them, we would not have been able to complete this thesis.
We want to firstly extend our immense thanks to our supervisor, Prof. Mats Jackson. It is you and Dr. Karin Romvall that gave us opportunity to take part in the ongoing research project “Green Production System”, to which our thesis belongs. Additionally, Mats Jackson gave us a lot of suggestions all the way through the thesis writing, so that we were not going to deflect from the aim of this thesis. Also, encouragement is always perceived. We also want to thank Mr. Anders Lundgren, quality and environment manager of CH Industry. It is really kind of him to permit us to test our model in his company. During the test period, he helped us a lot by showing us around the workshop and carefully introducing the every situation we wanted to know. He also showed us great patience when we asked for the data.
Mr. Sabah Audo, our admirable and beloved teacher and the examiner of our graduation project. Thank you for giving us so much useful information regarding thesis writing. We are also grateful to your impressive lectures, which with no doubt will be the golden memory of our Sweden life.
Our gratitude also goes to the authors of the literatures that we referred to.
Last but not least, thanks to our families. Without their support, we would not have had such a chance to study in Sweden.
Contents
1. INTRODUCTION ... 9 1.1BACKGROUND ... 9 1.2PROBLEM STATEMENT ... 10 1.3RESEARCH QUESTIONS ... 11 1.4AIM OF PROJECT ... 11 1.5DELIMITATION ... 11 2. METHODOLOGY ... 12 2.1LITERATURE REVIEW... 12 2.2PRACTICAL STUDY ... 122.3SEMINAR AND CONSULTATION ... 12
2.4COMMENT ON METHODOLOGY ... 12
3. THEORETICAL FRAMEWORK ... 13
3.1SUSTAINABILITY ... 13
3.2LEAN PRODUCTION ... 14
3.2.1 A Short Review of Lean Production ... 14
3.2.2 Seven Lean (Economical) Wastes... 15
3.3GREEN MANUFACTURING ... 16
3.3.1 Value Stream Activity and Overall Building Activity ... 16
3.3.2 Seven Environmental Wastes ... 17
3.4VALUE STREAM MAPPING AND LIFE CYCLE ANALYSIS ... 18
3.4.1 Value Stream ... 18
3.4.2 Value Stream Mapping ... 19
3.4.4 Life Cycle and Life Cycle Analysis ... 21
3.4.4.1 Life Cycle ... 21
3.4.4.2 Life Cycle Assessment/Analysis ... 21
3.4.5 Why Choose VSM for Development? ... 23
3.5ENVIRONMENTAL PERFORMANCE MEASUREMENT STRATEGIES ... 24
3.6AN INSPIRATION FROM THEORY ... 26
4. DATA COLLECTION FOR EVSM ... 29
4.1MEASUREMENT OF EACH ENVIRONMENTAL WASTE ... 29
4.1.1 Energy ... 29 4.1.2 Water ... 29 4.1.3Material ... 30 4.1.4Garbage ... 32 4.1.5Transportation ... 33 4.1.6Emission ... 33
4.1.7Biodiversity ... 34
4.2COMMENTS... 35
4.3LEVELS OF MEASUREMENT AND WASTE REPORTING ... 35
4.3.1 Level 1 ... 37
4.3.2 Level 2 ... 38
4.3.3 Level 3 ... 40
4.3.3.1 Energy Waste and Water Waste ... 41
4.3.3.2 Material Waste and Garbage Waste ... 43
4.3.3.3 Transportation Waste ... 43
5. A PRACTICAL STUDY - CH INDUSTRY’S ENVIRONMENTAL MANAGEMENT FOOTPRINT ... 47
5.1INTRODUCTION ... 47
5.1.1 The Company ... 47
5.1.2 How CH Regards and Treats Environment ... 47
5.1.3 Study Footprint at CH ... 49
5.2CH’S VALUE STREAM ... 50
5.2.1 Product Selection ... 50
5.2.2 Value Stream Mapping ... 52
5.3CH’S ENVIRONMENTAL VALUE STREAM ... 54
6. RESULTS ... 58
7. ANALYSIS ... 59
8. CONCLUSION & RECOMMENDATION... 60
List of Charts:
Chart 3.1: Three dimensions of sustainability Chart 3.2: Seven environmental wastes
Chart 3.3: Initial Value-Stream Mapping Steps Chart 3.4: Two kinds of Kaizen
Chart 3.5: Levels of mapping the value stream for a product family Chart 3.6: Phases of an LCA
Chart 3.7: An example of a product system for LCA
Chart 3.8: Lean waste and environmental wastes derived from different perspective. Chart 4.1: Positioning of paper box
Chart 4.2: A pre-assumed EVSM (current) Chart 5.1: Calendar of study in CH Industry
Chart 5.2: Process steps of making front lid and top lid of battery box Chart 5.3: Spaghetti chart for lids processing in CH Industry AB
Chart 5.4: Current value stream map of CH Industry AB (lids of battery box) Chart 5.5: EVSM of CH Industry
List of Tables:
Table 3.1: Corporate Sustainability Assessment Criteria (Dow Jones Sustainability Indexes)
Table 3.2: Comparison of three production systems Table 3.3: Waste-impacts matrix
Table 3.4: Action-competitiveness matrix
Table 3.5: Comparison between VSM, LCA, and DES Table 4.1: Energy waste identification and measurement Table 4.2: Water waste identification and measurement Table 4.3: Material waste identification and measurement Table 4.4: Garbage waste identification and measurement Table 4.5: Transportation waste identification and measurement Table 4.6: Transportation waste identification and measurement Table 4.7: Biodiversity waste identification and measurement
Table 4.8: Difficulty types of measurement for each environmental waste
Table 4.9: Levels of data collection for environmental performance management Table 4.10: Three types of report corresponding to three levels of data collection Table 4.11: Report for level 1 data collection
Table 4.12: Data collection form for level 2 Table 4.13: Report for level 2
Table 4.14: Waste measurement ways
Table 4.15: Methods of timing plus energy meter method Table 4.16: Paper work model for timing
Table 4.17: Work sheet for measuring material waste and garbage Table 4.18: Work sheet for measuring external transportation waste Table 4.19: Work sheet for measuring internal transportation waste Table 4.20: Report for level 3 data collection
Table 5.1: Some environmental legislations that CH Industry AB follows Table 5.2: CH’s rating on each environmental waste
Table 5.3: Explanation of colors in practice study calendar Table 5.4: Related Machine Checklist of CH Industry AB Table 5.5: Levels of Automation (Rother & Harris, 2001) Table 5.6: Activity-Waste Checklist
Table 5.7: Wastes produced by the five value stream activities of making battery box lids Table 5.8: Report of waste measurement of CH Industry
List of Abbreviations
AB: Aktiebolag (registered company in English) BOM: Bill of Material
Bn: Biological Nutrient BTU: British Thermal Units C/T: Cycle Time
C/O: Changeover Time
EPE: Every part every …… (a measurement of production batch size) EPMS: Environmental Performance Measurement Strategy
EVSM: Environmental Value Stream Mapping GATT: General Agreement on Tariffs and Trade HVAC: Heating, Ventilating, and Air Conditioning ISO: International Organization for Standardization JIT: Just in Time
LCA: Life Cycle Analysis/Assessment Lf: Landfill Forever
L/T: Lead Time
MIT: Massachusetts Institute of Technology MSDS: Material Safety Data Sheets
NAE: National Academy of Engineering PPM: Part per Million
RQ: Research Questions Tn: Technical Nutrient
TPS: Toyota Production System TQM: Total Quality Management VOC: Volatile Organic Compounds VSM: Value Stream Mapping
List of Appendix
Appendix 1: Preliminary EVSM Model Appendix 2: CH – Layout with Material Flow Appendix 3: CH - VSM
1. Introduction
1.1 Background
The staffs of National Academy of Engineering (NAE) have ever predicted six grand challenges for manufacturing in 2020, among which environmental compatibility ranks the fourth position (National Research Council Staff, 1998). The goal of manufacturing enterprises will be to make cost-effective, competitive products through processes that do not harm the environment, use as much recycled materials for feedstock as possible, and create no significant waste, in terms of energy, material or human resources (National Research Council Staff, 1998).
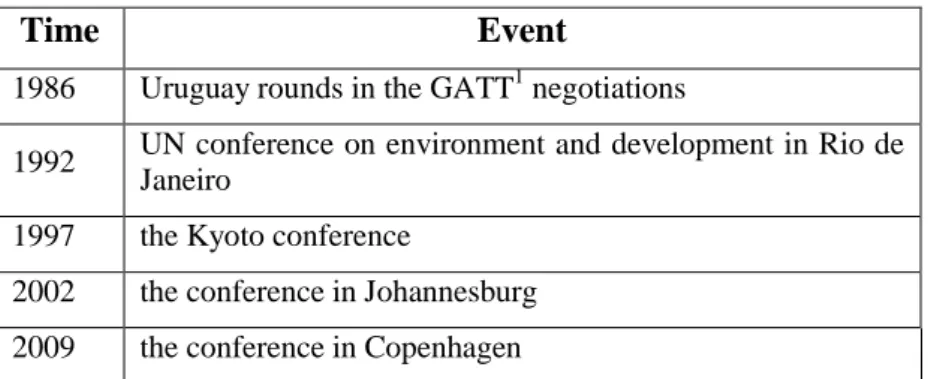
However, the environmental challenge seems to come much earlier than expected. Nowadays, people are very much and ever increasingly aware of product safety and environmental issues, such as climate change, pollution, natural resources, natural diversity and so like. Such concerns have also been raised to an international level in forms as negotiations, summits, proceedings and so on. Table 1 shows some conferences and negotiations, which have influenced public awareness about the importance of environmental matter.
Time Event
1986 Uruguay rounds in the GATT1 negotiations
1992 UN conference on environment and development in Rio de Janeiro
1997 the Kyoto conference
2002 the conference in Johannesburg 2009 the conference in Copenhagen
Table 1.1: Some international conferences and negotiations on environment issue
Thereby, manufacturers are required to produce safe, environmentally friendly products with resource-efficient and low- or even non-pollutant-emission processes. And it has been a trend that environmentally friendly products and manufacturers are able to earn more supports and orders at the market. Apart from this, the other benefits of going green include cost savings, increased employee retention and attraction, ability to grow, innovation and development of new technologies and increased profit and shareholder value (Wills, 2009).
Today, lean production has been adapted as an effective approach to industrial excellence by a great number of companies. With the help of lean production, companies reduced the costs and wastes ever existed, while enhanced the productivity, quality and profitability. Having been developed in the practice for some decades, lean production is now much like a sound conceptual system containing philosophies, principles and tools, with which faculties can access to lean in a much easier, more systematic and logical way.
And now, a similar-to-lean way is demanded and foreseen to contribute to environmental excellence. To pave the way, there is a need to borrow the basic idea “Visual Management” from The Toyota Production System (TPS), from where the lean production is derived. By
1
developing the visualization tools, it is expected that companies can easily and consistently follow the environmental performance of individual process and the production system or even the whole organization. Additionally, based on the visualization, managements can make decisions more scientifically.
1.2 Problem Statement
As far as environment is concerned, companies can choose to adopt different positions ranging on a continuum from re-active environmental strategic positions following regulations, to pro-active positions where competitive advantages are sought for. Either way, the environmental concern requires manufacturing industries to develop strategies, technologies and practices that will reduce the environmental impact on both global and local scale (Bellgran, 2009).
Sweden traditionally has focus on environment preservation and has been a bench mark for other countries in this respect. Also, Swedish manufacturing industry is concerned about environment, which they think may benefit them. Nonetheless, they think there is still some impediment on their road to green. For instance, going green is supposed costly and requiring expertise. This matter actually is somewhat like the development of people’s consciousness towards quality. There had ever been the notion of quality cost, arguing than quality causes costs, reduces productivity and thus weakens the profitability. However, the argument was later on repudiated by arguing that what really costs is the poor quality (Bergman & Klefsjö, 2010). Such transition can also happen to the cognition towards environment. Poor environmental performance (e.g. low recycle rate, high resource-consumption rate, pollutant emission) would cost more than investment in sustainability improvement.
Presently, most of the measurement of environmental performance is done by environmental expert either specially employed by a company or from a third party tester. And the result is always released in the format of report or similar. Other workers and managers are just pushed to know the result by seeing a monthly report or announcement. Consequently, they just know what the result is rather than why there is such result. In this way, companies lose the ability to respond to environment quickly. Considering the quick response is a character of agile, flexible, and lean production, such clumsy response should not exist.
In order to be responsive to environment, which is considered as another customer of companies, environmental performance should be proactively tracked, recorded and analyzed. Thus, it is not enough to only involve green experts. It must be like Total Quality Management (TQM), requiring all the employees are committed, committed leadership, focus on process, and so on. In order to get all the employees engaged in, simple tools should be created for them to use. Thus, it becomes pressing to develop user-friendly visualization tools for non-experts to measure, follow and advance the environmental performance of their production system.
As a useful visualization and analysis tool in lean practice, value stream mapping (VSM) technique has been extensively recognized and employed to test how lean a value stream is. Based on such methodology, value stream mapping is reasonably supposed also to be effective in testing how green a value stream is by changing the original characters, parameters, or some else of value stream mapping. Thereby, efforts are promisingly to be carried out to dig out the potential of value stream mapping in green performance visualization through some development. By developing VSM, the green performance of a value stream can be more measurable and accessible to non-expert people at the
production. What’s more, management can also have easier reference to follow the green performance of his production, as well as make decisions on the green progress.
1.3 Research Questions
RQ1: How can the present VSM tool be developed in order to visualize lean as well as environmental performance?
RQ2: What is the essence of carrying out EVSM in practice? RQ3: What are the advantages and disadvantages of EVSM? RQ4: How is EVSM different from original VSM?
1.4 Aim of Project
As is a subtask under the research project “Green Production System”, which is launched and run jointly by AB Volvo/Volvo Technology, Haldex, Saab and All-Emballage J.E. AB as industrial party, and Mälardalen University of Sweden as academic party, this master thesis is intended to develop a visualized, simple-to-understand and easy-to-use tool to measure and visualize the environmental performance of production system, namely the processes.
Besides, relevant performance indicators of environment performance are supposed to be thrashed out on the basis of literature study.
The development tool is expected to be used in some typical production processes such as assembly, machining, and foundry, etc. Original value stream mapping will be developed through theoretical and empirical studies, and then tested in practical production of one of the industries mentioned above.
By working out such a tool, management and workers can approach to the environmental performance of its process for specific products in an easier way. In addition, decisions-making supports are considers as a part of the characteristics of the developed tool.
1.5 Delimitation
The scope of this thesis is limited to the visualization of environmental wastes generated by value stream activities, which do not include overall building activities. Overall building activities are those which do not change the form and function of materials to produce a product or service, but they are necessary to support those pure value stream activities. Examples are human resources, purchasing, scheduling, accounting, designing, lighting, air conditioning, etc. Although the overall building activities might be also drawn into the map when mapping a value stream, the measurement of environmental wastes of overall building activities will not be done or shown in the map even though the wastes are measured.
The other limitation is that, assumption that the developed visualization tool will be used in production processes such as assembly and machining.
2. Methodology
This thesis is typically an exploratory research inspired by the recognized tool – value stream mapping. As is seen the effectiveness in visualizing the lean performance of a production system, VSM is deduced to have the ability of visualizing the environmental performance through some development. Based on such deduction, research is carried out in a couple of ways.
2.1 Literature Review
By reviewing related literatures, understanding on value stream mapping including its principle, usage and operation steps is further deepened, which will be helpful to the comprehension and development of EVSM. Also, important indicators of environmental performance are recognized. The understanding on value stream mapping and recognition of environmental performance indicators contribute to the establishment of theory and framework of EVSM.
The literatures referred by the thesis mainly consist of books while less journals, because of the fact that there is little previous research for reference.
2.2 Practical Study
When an EVSM model is derived, it is necessary to test it in practice to verify whether a complete production data record is really a necessary prerequisite to the implementation of EVSM.
For this purpose, a company within the industries delimited in the thesis was contacted, and a study period of one month was appointed and fixed. During the period, visiting company took place twice in average per week. The study includes workshop visit, target value stream identification, operation process observation, and interview (with Quality and Environment Manager), through which the required data is collected.
2.3 Seminar and Consultation
Because the thesis is a sub-task of an on-going of Mälardalen University, the thesis aim is set in order to be in line with the whole project aim. For the sake of proceeding to the right direction, seminar with thesis supervisor is undertaken periodically (i.e. every Friday afternoon). In the meeting, supervisor gave his suggestion on how to deal with the inconformity between theory and practice, how to keep the initial accent and direction of the research, and other issues on thesis writing.
2.4 Comment on Methodology
This thesis is an exploratory study, since few related researches are found. Thus, reference to books of related knowledge is the main methodology, such as value stream mapping, industrial environmental wastes. This methodology panorama view of expertise and gives a chance to think in a systematic and scientific way.
However, theory does not always coincide with practice, so practical study is needed. Through on-site study, the thesis can avoid some impracticality and make the tool more usable to real world.
Meeting with supervisor helps with holding the preset aim consistently (i.e. not transferring from doing for university to doing for a specific company)
3. Theoretical Framework
3.1 Sustainability
Sustainability has been not a fashionable concept any longer, since it has been widely embraced by governments and organizations over the past two decades. Its meaning and implications have much been disputed, but it was still spread (Gibson, 2005). The definition of sustainability that is most widely referred is from the United Nations Brundtland Commission, who defined sustainability as
Meeting the needs of the present without compromising the ability of future generations to meet their own needs (World Commission on
Environment and Development, 1987)
Traditionally, environment has been a primacy in sustainability concept (Newport, Chenes, & Lindner, 2003). When people are talking about sustainability, a lot of emphasis was added onto environment while its other two dimensions were a little bit overlooked. In fact, sustainability has three aspects. Besides environmental sustainability, economic sustainability (economic development) and social sustainability (social equity) are the other two implications of sustainability (Elkington, 1997).
Chart 3.1: Three dimensions of sustainability
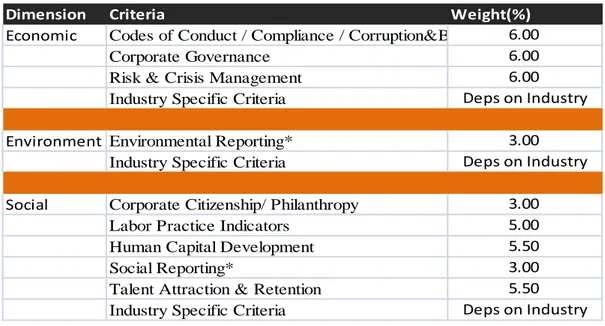
Thus, for instance, the assessment of a company’s sustainability should involve indicators and criteria of all the three dimensions. And following is an example framework listing corporate sustainability assessment criteria, which is established by Dow Jones Sustainability Indexes. Environmental (planet) Climate change Energy use Chemicals, toxins ... Social (people) Education Labor standards Health ... Economic (profit) GDP Return on investment Tax Corruption ...
Dimension Criteria Weight(%) Economic Codes of Conduct / Compliance / Corruption&Bribery
Corporate Governance Risk & Crisis Management Industry Specific Criteria
Environment Environmental Reporting* Industry Specific Criteria
Social Corporate Citizenship/ Philanthropy Labor Practice Indicators
Human Capital Development Social Reporting*
Talent Attraction & Retention Industry Specific Criteria
Deps on Industry 3.00 6.00 6.00 6.00 Deps on Industry 3.00 5.00 5.50 3.00 5.50 Deps on Industry
*Criteria assessed based on publicly available information only
Table 3.1: Corporate Sustainability Assessment Criteria (Dow Jones Sustainability Indexes)
As regards to Value Stream Mapping, it is usually the first step to take in order to realize lean, which partially contributes to the economic sustainability of a business organization. Environmental Value Stream Mapping (EVSM) method, the variant of VSM, however, is intended as a contributing factor to environment sustainability, which concentrates on the visualization of environmental waste of a company. By representing lean & green performance, company’s level of sustainability can be seen evaluated.
3.2 Lean Production
3.2.1 A Short Review of Lean Production
The term ”Lean” was coined by John Krafcik in an autumn article, “Triumph of the lean production system”, published in Sloan Management Review and based on his master’s thesis at the MIT Sloan Management School (Wikipedia, 2010). In 1990s, lean production was immortalized by world manufacturing community through the bestseller, The
Machine That Changed the World (Womack, Jones, Roos, 1991). Since then, the
philosophy and the toolkit of TPS have been worldwide learnt and applied to different sectors. Enterprises earned productivity, quality, cost and other competitive advantages from Lean Production.
Lean has been a quite often heard and remembered term, especially to people in manufacturing. Lean production has dominated manufacturing trends (along with Six Sigma) for more than ten years (Jeffrey K, 2004).
James Womack, Daniel Jones and Daniel Roos, in their book The Machine That Changed
the World (1990), positioned lean production in the middle of craft production and mass
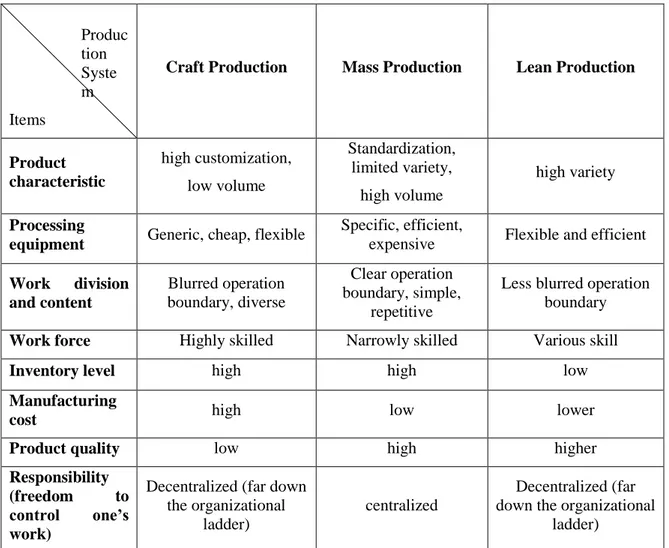
production, saying lean producer combines the advantages of craft and mass production, while avoiding the high cost of the former and the rigidity of the latter (Womack, Jones, & Roos, 2007). What is interesting is that the two changes of our most fundamental ideas of how we make things in last century were made by automobile manufacturing industry. The following table demonstrates the difference between craft production, mass production and lean production in some respects.
Produc tion Syste m Items
Craft Production Mass Production Lean Production
Product characteristic high customization, low volume Standardization, limited variety, high volume high variety Processing
equipment Generic, cheap, flexible
Specific, efficient,
expensive Flexible and efficient Work division and content Blurred operation boundary, diverse Clear operation boundary, simple, repetitive
Less blurred operation boundary Work force Highly skilled Narrowly skilled Various skill
Inventory level high high low
Manufacturing
cost high low lower
Product quality low high higher
Responsibility (freedom to control one’s work)
Decentralized (far down the organizational
ladder)
centralized
Decentralized (far down the organizational
ladder) Table 3.2: Comparison of three production systems
New ideas emerge from a set of conditions where old ideas no longer seem to work (Womack, Jones, & Roos, 2007). Mass production was born in a new condition that more and more average consumers – opposite to wealthy ones, want to have their own cars at affordable price, for which craft production could not satisfy and was exposed to drawbacks, such as high production costs, low quality and low productivity.
The same grounds also apply to the birth of lean production, which was initiated by TOYOTA as TOYOTA Production System. Because the circumstance was quite different from that of the U.S, mass production was predicted unfeasible at Japan by Eiji Toyoda and Taiichi Ohno.
If the goal of mass production is to satisfy the vast market demand by improving the productivity through the application of inter-changeable parts, specialized work techniques, the goal of lean production is to responsively satisfy the limited but diverse needs of quality-demanding customers in most efficient and economic manner by reducing wastes in inventory, time to market, human effort and manufacturing space (Singh & Sharma, 2009).
3.2.2 Seven Lean (Economical) Wastes
Waste takes many forms, such as material, parts, inventory, human effort, time, equipment, etc., and can exist anywhere at any time (Nicholas, 1998). The heart of lean manufacturing is to eliminate any form of waste from processes.
As was known to many of us, there are seven famous lean wastes identified by Toyota, including (Jeffrey K, 2004):
Overproduction
Overproduction is the production of products which are not ordered by customers. Taiichi Ohno regards overproduction as the fundamental waste, for it leads to most of the other wastes. For example, overproduction definitely builds up excess inventory somewhere downstream.
Waiting
Workers wait aside a machine because of any reason is considered as a waste. In lean philosophy, machine’s is more preferable than worker’s wait. In other words, machine’s wait may not be a waste.
Unnecessary transport or conveyance
This waste refers to carrying work in process long distances, creating inefficient transport, or moving materials, parts, or finished goods into or out of storage or between processes (Jeffrey K, 2004).
Overprocessing or incorrect processing
Overprocessing means operating more than needed on materials or parts. This waste occurs when providing higher-quality products than is required.
Excess inventory
Excess inventory causes longer lead times, obsolescence, damaged goods, transportation and storage costs, and delay.
Unnecessary movements
Examples of unnecessary movements are looking for, reaching for, or stacking parts, tools, walking, etc.
Defects
Apart from the above seven non-value-adding wastes, Jeffery K. Liker, who authored “the TOYOTA Way” incorporate an eighth waste – unused employee creativity. Jeffery L, Liker thinks this waste can cause losing time, ideas, skills, improvements, and learning opportunities.
3.3 Green Manufacturing
3.3.1 Value Stream Activity and Overall Building Activity
The activities of a company can be divided into two categories, pure value stream activity and overall building activity (Wills, 2009).
Pure value stream activity denotes the activities that change the form and function of a material or parts. Examples of pure value stream activity are forming, welding, washing, painting, shipping, etc.
Overall building activity represents the activities that do not change the form and function of materials to produce a product or service, but they are necessary to support pure value stream activity.
3.3.2 Seven Environmental Wastes
Brett Wills (2009) identified and defined seven environmental wastes in his green works –
Green Intention: creating a green value stream to compete and win, which include Energy,
water, materials, garbage, transportation, emission, biodiversity in order.
Environmental Impact Garbage Transportation Emissions Biodiversity Material Water Energy
Chart 3.2: Seven environmental wastes
3.3.2.1 Energy Waste
In a recent study, carried out jointly by Deloitte and U.S. Council on Competitiveness, energy cost and policies are ranked at the third most important driver of countries manufacturing competitiveness, following talent-driven innovation and cost of labor and materials as champion and second (Deloitte Touche Tohmatsu, Council on Competitiveness, 2010). This is the result of interviews and surveys to more than four hundred senior manufacturing executives on how they view their industry’s competitiveness around the world.
In green context, energy specifically refers to the consumption of electricity and fuels (such as natural gas) to power electrical and mechanical devices (such as electronics, heating devices, and machinery, as well as building items like lighting and HVAC systems - Heating, Ventilating, and Air Conditioning) (Wills, 2009). It is one of the largest contributors to the negative impacts on the environment, representing one of the largest opportunities for improvements and savings. Typically, the energy a manufacturer use to run its operations comprises electricity and fuel.
The ultimate goal of eliminating energy waste is to totally use harvested renewable energy.
3.3.2.2 Water Waste
Water waste comes from paying to use more water than needed and paying again to have it taken away and clean. It is worth a clarification that the waste of water is not necessarily in using it, but having to pay for consuming it and discharging contaminated water. The ultimate goal of eliminating water waste is to reuse water continually.
3.3.2.3 Material Waste
Material waste comes from a global design flaw – designing virgin raw materials into products that are designed to end up in the landfill. If the material that a manufacturer uses to make its parts and products is not reusable or recyclable or even contains hazardous
substance, it will be a great economical loss and impose negative effect to the environment. A “cradle to cradle” cycle should be used in order to reduce or remove material waste. “Cradle to cradle” means design and make product with recyclable and reusable materials with no toxicity.
The excellence of eliminating material waste is the pursuit of 100 percent material reusability.
3.3.2.4 Garbage Waste
Garbage as an environmental waste is a concept with which people have been quite familiar. Garbage comes from paying for something that you will throw away, something that has caused negative environmental impact to produce, and then paying again to have it disposed of.
The ultimate goal is total elimination of garbage, before which produce 100 percent reusable or biodegradable garbage is of the highest level.
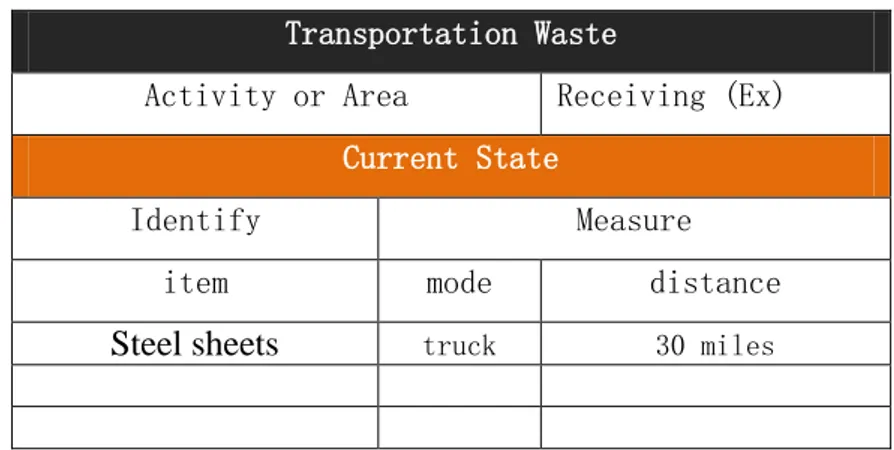
3.3.2.5 Transportation Waste
Transportation waste comes from paying for excess and unnecessary travel which results in negative impacts on the environment from the burning of fossil fuels. Here, transportation mode and distance are the focus. The emission of vehicles and fuel consumption are not included in transportation waste. Reviewing transportation as one of the wastes, will allow company to see the effects and come up with a plan for eliminating the negative environmental impact and enjoying the economic benefits that come along with reducing transportation costs.
3.3.2.6 Emissions Waste
Emissions waste comes from paying to create and discharge pollutants on-site and then being subject to the fines and levies associated with doing this.
Emissions contribute heavily to pollution and environmental impacts associated with pollution such as global warming.
3.3.2.7 Biodiversity Waste
Biodiversity, according to the Canadian Biodiversity Information Network, is the variability among living organisms from all sources including, inter alia, terrestrial, marine and other aquatic ecosystems and the ecological complexes of which they are part; this includes diversity within species, between species and of ecosystems. (Environment Canada, 2011). Biodiversity waste comes from the fact that we pay a price when we take away biodiversity from a particular area and when doing that it has severe and immediate environmental impacts. The waste is in two forms: first from the direct destruction of flora, fauna and organisms resulting from the building of infrastructure, secondly from the overharvesting of natural resources (Wills, 2009).
3.4 Value Stream Mapping and Life Cycle Analysis
3.4.1 Value Stream
A value stream is all the actions (both value added and non-value added) currently required to bring a product through the main flows essential to every product: (1) the production flow from raw material into the arms of the customer, and (2) the design flow from concept to launch (Rother & Shook, Learning to see - value-stream mapping to
create value and eliminate muda, 2003). Normally, the first concept is more often related to lean manufacturing.
3.4.2 Value Stream Mapping
Value stream mapping is a lean tool widely used to see a whole picture of the processes, representing both production and information flow, and find opportunities for improvement efforts by identifying wastes existing in process. It readily extends to sustainability, especially to the environmental side. Just add appropriate metrics, such as hazardous material used/ generated, water used, and energy used.
At Toyota, value stream mapping is known as “Material and Information Flow Mapping”. It is used by Toyota Production System practitioners to depict current and future, or “ideal” states in the process of developing implementation plans to install lean systems.
Taking a value stream perspective means working on the big picture and improving the whole, not just on individual processes or parts (Rother & Shook, Learning to see - value-stream mapping to create value and eliminate muda, 2003).
Value stream mapping is waste unless it leads to action and the real purpose of mapping is to design the future state. (Bicheno & Holweg, 2009). Thus, value stream map must contain a current map and a future map; both of them comprise the whole visualization exercise. When a future status is achieved, the future map becomes a current map, and a new future map should be developed for continuous improvement (KAIZEN).
The flow chart below shows an initial value-stream mapping steps.
Chart 3.3: Initial Value-Stream Mapping Steps
A product family is a group of products that go through similar processing steps and over common equipment in downstream processes (Rother & Shook, Learning to see - value-stream mapping to create value and eliminate muda, 2003).
Because companies tend to be organized by functions and department, and the value stream actually flows across functions and departments, there should be a value-stream manager to lead responsibility for understanding a product family’s value stream and improving it. It is big mistake of trying to split the mapping task among department managers and stitch the individual segments together.
There are two kinds of Kaizen (improvement), flow kaizen and process kaizen. Flow kaizen focuses on material and information flow; process kaizen focuses on people and process flow. Both of them are necessary.
Senior Management
Front lines
Focus Chart 3.4: Two kinds of Kaizen
3.4.3 Mapping Current State Value Stream
Because visualization is mainly about current state, here the focus is concentrated on how to draw a current map. Current state can be illustrated on four levels:
Chart 3.5: Levels of mapping the value stream for a product family (Rother & Shook, 2003)
Normally, mapping starts at the level of the door to door flow. Once the overall flow through the plant is sketched, the level of magnification can be changed by zooming in and zooming out.
There are a few tips on mapping (Rother & Shook, 2003):
Always collect current-state information while walking along the actual channels of
material and information flows personally;
Begin with a quick walk along the entire door-to-door value stream;
Begin at the shipping end and work upstream;
Bring a stopwatch and do not rely on standard times or information that not
personally obtained;
Map the whole value stream yourself;
Always draw by hand in pencil.
Following is a list of typical process data that may be observed and record (Rother & Shook, 2003).
C/T (cycle time) – time that elapses between one part coming off the process to the next part coming off, in seconds;
Process Level
Single Plant (door to door)
Multiple Plants Across Companies FLOW KAIZEN (Value-Stream Improvement) PROCESS KAIZEN (Elimination of Waste)
C/O (changeover time) – the time to switch from producing one product type to another;
Uptime (on-demand machine uptime)
EPE (production batch size) – stands for “every part every ” Number of operators
Number of product variations Pack size
Available working time per shift at that process(minus breaks) Scrap rate
Inventory
3.4.4 Life Cycle and Life Cycle Analysis
As environmental awareness increases, industries and business are assessing how their activities affect the environment. Society has become concerned about the issues of natural resource depletion and environmental degradation. Many businesses have responded to this awareness by providing “greener” products and using “greener” process. The environmental performance of products and process has become a key issue, which is why some companies are inebriating ways to minimize their effects on the environment. Many companies have found it advantageous to explore ways of moving beyond compliance using pollution prevention strategies and environmental management systems to improve their environmental performance. One such tool is LCA. This concept considers the entire the cycle of a product or service.
3.4.4.1 Life Cycle
Life cycle is the consecutive and interlinked stages of a product or service system, from the extraction of natural resources to the final disposal.
3.4.4.2 Life Cycle Assessment/Analysis
Life cycle assessment is a “cradle-to-grave” approach for assessing industrial system. “Cradle-to-grave” begins with the gathering of raw materials from the earth to create the product, through product manufacturing, and ends at the point when all materials are returned to the earth.
LCA evaluates all stages of a product’s life from the perspective that they are interdependent, meaning that one operation leads to next. LCA enables the estimation of the cumulative environmental impacts resulting from all stages in product life cycle, often including impacts not considered in more traditional analyses.
The “life-cycle” or “cradle-to-grave” impacts include the extraction of raw materials; the processing, manufacturing, and fabrication of the product; the transportation or distribution of the product to consumer; the use of the product by the consumer; and the disposal or recovery of the product after its useful life. The LCA process is a systematic, phased approach and consists of five components as illustrated in Chart 3.6.
Chart 3.6: Phases of an LCA (ISO 14040 Figure1 – stages of an LCA)
Goal definition and scoping: identifying the LCA’s purpose and the expected products of the study, and determining the boundaries and assumptions based upon the goal definition.
Life – cycle inventory: quantifying the energy and raw material inputs and environmental releases associated with each stage of production
Impact analysis: assessing the impacts on human health and the environment associated with energy and raw material inputs and environmental releases quantified by the inventory
Improvement analysis: evaluating opportunities to reduce energy material inputs or environmental impacts at each stage of the product life cycle.
Interpretation: evaluate the results of the inventory analysis and impact assessment to select the preferred product, process or service with a clear understanding of the uncertainty and the assumptions used to generate the results.
Life Cycle Assessment/Analysis has a set of systematic procedures for compiling and examining the inputs and outputs of materials and energy and the associated environmental impacts which directly attributable to the functioning of a product or service system throughout its life cycle.
It assesses the potential environmental aspects and potential aspects associated with a product (or service), by
Compiling in inventory of a relevant inputs and outputs,
Evaluating the potential environmental impacts associated with those inputs and outputs, Interpreting the results of the inventory and impact phases in relation to the objectives
of the study.
Performing LCAs may help with:
identifying opportunities to improve the environmental performance of products informing decision-makers
Life Cycle Assessment Framework Goal definition and scope Inventory analysis Impact assessment Interpretation Direct applications : - Product development and improvement - Strategic planning - Public policy making - Marketing - other
selecting of relevant indicators of environmental performance marketing
LCA can also help decision-makers select the product or process that result in the least impact to the environment. This information can be used with other factors, such as cost and performance data to select a product or process. LCA data identifies the transfer of environmental impacts from one media to another and/or from one life cycle stage to another. If an LCA were not performed, the transfer might not be recognized and properly included in the analysis because it is outside of the typical scope or focus of product selection processes.
Chart 3.7: An example of a product system for LCA (ISO 14040 Figure2 – Example of a product system for LCA)
3.4.5 Why Choose VSM for Development?
Is environmentally conscious action contrary to financial considerations? The answer seemed yes in the past for the little attention and awareness paid to environment issues. However, the answer is turning to “No” speedily in recent years for the environmental issues and concerns are raised to an unprecedentedly high position. People are willing to buy the products which itself or whose manufacturing processes are less harmful to the environment even if at a higher price.
As mentioned above, environmental actions may have different focus: product or process. From the perspective of function of actions, environmental actions can improve value or
Other systems Transport Raw material acquisition Production Use Waste treatment Energy supply Recycling reuse Other system Elementary Flows System boundary System environment Elementary Flow
cut costs. Wiktorsson established a matrix to categorize four sorts of actions (Wiktorsson, Bellgran, & Jackson, 2008):
Value improvement Cost decrease
Product focus
1. “PRIUS”
Material and technology selection improving customer value
2. “XEROX”
Material and component reuse. Remanufacturing.
Process focus 3. “ORGANIC AGRICULTURE”
Selling by sustainable processes
4. “SUSTAINABLE LEAN”
Waste reduction Table 3.4: Action-competitiveness matrix
This thesis is concerned about the fourth environmentally conscious action “Sustainable Lean” which decreases cost through process focus. In order to reach a sustainable lean production system, it is the first step that to see the current status of a production system or a value stream, including calculating. Following is a table comparing different analysis tools in several respects. It gives the answer, why VSM is preferred to take for a development. Feature VSM LCA Dynamic assessment Deterministic, standard or average parameter Deterministic, standard or average parameter Publicly available
data On-site obervation
Public LCA data available
Visualization 2D process map Limited process
view
Simplified User-friendly tool Experts tool
Standardized Industrial standard for lean manufacturing Standardized ISO 14040 ISO 14044 Framework for environmental impact analysis Methodology has
been presented The main tool
Table 3.5: Comparison between VSM and LCA
In the table above, VSM proves to be a better prototype of the needed visualization tool, because it can show the map of whole production process while LCA shows limited process and VSM is user-friendly.
3.5
Environmental
Performance
Measurement
Strategies
In real world, there are different kinds of companies in terms of their environmental attitudes. Giovanni Azzone and Giuliano Noci identified five categories of green manufacturing strategies in the light of internal factors describing how executives consider
“green” issues and external variables, such as environment-related regulations. Those strategies include (Azzone & Noci, 2009):
1) Evangelist strategy
An “evangelist” strategy follows an ethical objective and implying a radical approach to environmental issues. The sustainability of such strategy is dependent on manager’s value and organizational culture.
2) Pro-active green strategy
A pro-active “green” strategy is adopted by companies that aim to anticipate competitors through “systemic” initiatives affecting the whole value chain.
3) Responsive green strategy
With this pattern of environmental behavior, companies seek to anticipate competitors by introducing limited investments, almost all of a technical nature (change in the product bill of materials to favor the recycling process).
4) Reactive strategy
A company aims to comply with environmental regulations or customers’ environmental requirements.
5) Unresponsive behavior
Such “green” manufacturing strategy is typical, for instance, of small firms that, given limited financial resources, adopt a passive pattern of environmental behavior, thus trying to delay the adoption of “green” programs.
Different green manufacturing strategy has different environmental performance measurement strategies (EPMS).
For those who adopt evangelist strategy, PMS should completely report the indicators describing how a company’s activity affect environment. And the cost is less important. For the adopters of pro-active green strategy, PMS should consider the physical environmental indicators which are the main determinants of shareholders’ value.
For responsive green strategy practitioners, the focus of their environmental initiatives are mainly on the differentiation of products through take-back of end-of-life materials to be recycled, while less focus on production activities. Thus, LCA here is more preferable than EVSM. However, operational activities still should be notices. For instance, it is important to identify how take-back of end-of-life products modify the company’s transportation and energy cost.
For reactive strategy practitioners, its PMS should include the indicators which highlight how the company performs with respect to regulations. Thus, only a total evaluation of key indicators is need for a specific period.
For the adopters of unresponsive strategy, management aims at the lowest cost resulting from changes from changes in environmental regulations and/or growing customer requirements.
They investigated 16 firms operating in Italy from the industries that have great impact to the environment, such as automotive (Iveco, FIAT), chemicals, textile, etc. They found none of the firms deploying the two extreme green strategies – evangelist and unresponsive. And the reasons are but not limited to:
For evangelist strategy
- It requires very high technical and managerial skills;
- Companies are not prepared for radical change required by this strategy;
For unresponsive behavior
- There are external stakeholder’s (regulator) requirements on environmental
performance.
Namely, all the firms are on one of the remained three green strategies.
Different companies may have different consideration of environmental performance indicator. Take seven green wastes for example; they can be different in terms of the difficulty of measurement. The difficulty might in the behavioral forms, such as cost, required technique, required time, etc. Thus, the companies who have top keen aspiration for excellent environmental performance might take thorough waste measuring strategy, while those who are less ambitious in green improvement may just measure the wastes which are easy to measure or use rough measure methods.
Also, different company has different green goals.
For those who embrace reactive strategy, meeting the environmental regulations at the lowest cost is their goal;
For responsive strategy supporters, they would aim at keeping just a little advance of environmental performance to their rivals;
Pro-active strategy companies not only green itself before their rivals, but also green its supply chain/value chain by cooperating with the other chain members;
Evangelists are characterized by their extreme actions towards green. They take going green as their responsibilities, persistently strengthen their green awareness and pursue green excellence by radical organization-wide revolution. In addition, they contrive to improve their technical skill and managerial skill through all available means. Green talents are also given plenty of importance by evangelist.
3.6 An Inspiration from Theory
According to James Womack and Daniel Jones, lean manufacturing is a five-step process: defining customer value, defining the value stream, making it “flow”, “pulling” from the customer back, and striving for excellence (Jeffrey K, 2004).
In the first step, customer value should be defined, because you should know what customers (including internal customer and external customer) want and what customers do not want from production.
However, customers can be interpreted in different ways, so there must be different kind of waste, as is shown by the following chart.
Chart 3.8: Lean waste and environmental wastes derived from different perspective. When a producer produces products, wastes may also be produced in the same time. Wastes can be in different formats, such as human efforts (e.g. overprocessing, overproduction, unnecessary movement, unused human creativity, etc.), time (i.e. operator waiting aside machinery), materials (e.g. overproduction, defects), and environmental wastes.
Those activities which only add cost and consumption of resource but not add any value are regarded as wastes. This is a way in customers’ perspective (Jeffrey K, 2004).
Likewise, environmental wastes are those which are not wanted by its customer – environment. In order for production, manufacturers need resources from nature (coal, water, natural gas, etc.) and discharge wastes in various forms to environment. Both of the
Final products
Waste
Time Materials Recourse & Environment
Lean Green Management tools Technical improvement Management tools Technical improvement -ANDON -KANBAN -JIT -HEIJUNKA ….. -Process design -Machinery update ... -Regulation -Rationalization -ISO14001 …... -3R -Machinery update ... Human effort Cost reduced enviroment consumer
actions are not wanted by environment, because they impose negative impact to environment. Rather, the environment wants less or no non-renewable resources are exploited and that less or no harmful waste would be discharged. Thus, those which take negative value into environment are green waste.
In conclusion, there is common philosophy behind lean waste and green waste. No matter lean wastes or green wastes, both of them are defined by their direct customer. Consumer is the direct customer for defining lean wastes, because lean wastes add zero value while still economically charge customers. Environment and nature are the direct customers for defining green wastes, because green wastes harm the environment and nature by exploiting resource (i.e. nonrenewable resources), generating nondegradable garbage, emitting liquid and air pollutant, and so on. Hence, consumer and environment are the end clients of manufacturing in economic context and in green context respectively. Both of the clients have their own value. Lean wastes are not wanted by customer.
Because both lean wastes and environmental wastes can cause costs to companies, they should be eliminated. Some might argue that going green costs money, but going green can also save cost by the means of saving from disposition of garbage, emission and effluent; exemption from levies and fines due to pollution; using recycled materials and parts; and so on. There just is a break-even point between the cost and benefits of going green. For those with limited financial ability, they can try to find the break-even point and plan an appropriate investment in sustainability. However, for the long run, the environmental initiatives should be always progressing.
4. Data collection for EVSM
4.1 Measurement of Each Environmental Waste
We can identify the seven environmental wastes by checking items with waste definitions within a value stream, including the pure value stream activities which change the form and function of something, and support activities such as accounting, operations (i.e. purchasing, scheduling, health and safety), human resource, engineering (i.e. designing and developing products), and building envelope (i.e. lighting, plumbing, HVAC activities). However, to identify all the waste within a value stream is quite difficult, requiring plenty of carefulness. We can start from the obviously existing wastes, and keep our eyes on the operations, workplaces and even the outside of plant, until we find out all the possible environmental wastes.
After identification of each waste, measurement should be taken in order to represent a current-state green value stream map with real data.
4.1.1 Energy
There are two ways to measure how much energy each activity consumes. One simple way is to refer to the nameplate of equipment. Normally, the nameplate of equipment tells its specification including energy requirement. If a machine only consumes electricity, its nameplate always shows how much power (i.e. the amount of watts) it needs to get run. In the case of fuel is needed to run a machine, the nameplate should list how much gas it uses in cubic meter or BTUs (British Thermal Units). 1 BTU = 3.413 Watts. However, this way does not give an exact result value, because nameplate only tells a maximum amount of power that equipment might consume (Wills, 2009). To measure the exact amount of power used, the other way is a better choice – energy meter method. Following is a table for recording the energy waste source and amount.
Energy Waste
Activity or Area Value stream activity 1: Laser Cutting
Current State
Identify Measure
item source power usage/time
Consumption quantity cost
Table 4.1: Energy waste identification and measurement
4.1.2 Water
One important principle for and measuring water waste is that precision need not be executed to the last drop of water. A close estimate of how much water an activity cost is
enough. The aim is to find out the biggest “waster consumer”, so that elimination action would be focused.
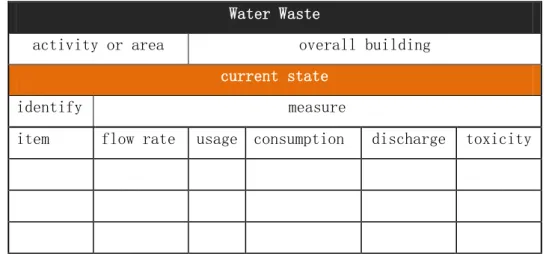
The first step to measure the water waste is to determine how much water flow out per use or per period. This could be found on the nameplate of machinery, or on the specification offered by the device producer. If neither of them is available, this can be done personally by filling a container of specified size and timing the whole course of process.
Second step is to calculate the usage of a timeframe (i.e. month, week, day, etc.). It is essential that the timeframe should be consistent across all activities and devices, so that the calculation of total waster waste would not be confused and go wrong. After this step, the quantity of consumption can be calculated by multiplying the flow rate and usage. The discharge of water is assumed equal to the consumption of water, even if water is retained or run up in the process.
Measuring toxicity is very important, because it has close relation with environmental impact. The more toxicity used water contains, the more significantly the used water will harm the environment. Measuring toxicity requires expert to perform. Let it done by an in-house expertise or a third-party laboratory.
Water Waste
activity or area overall building
current state
identify measure
item flow rate usage consumption discharge toxicity
Table 4.2: Water waste identification and measurement
4.1.3 Material
To identify and measure the material waste, the input and output of material into and out from every activity along the whole value stream should be observed. It will be quite a helpful way to refer to the bill of material (BOM) to find what materials and how many are used in order to finish the process at a given workstation, as well as the output. By asking the operations manager or plant manager, the amount of material input can be known.
Then, the makeup of materials both of input and output should be noted. For instance, if there is a screw going into a process, note its makeup such as stainless steel, cold-rolled steel etc. If the makeup of the screw is plastic, the type of plastic should be identified and noted. If the input is made up of two or more material, the percentage of each makeup should be written down.
It is a little harder to determine the chemical composition of the material input down to a very detailed level (i.e. 100-ppm). The most preferable way is of course to ask the suppliers for that information. If they do not have, web search might be a good alternative.
Otherwise, resort to a specialized laboratory for testing. This could be an expensive way, so just test the main materials.
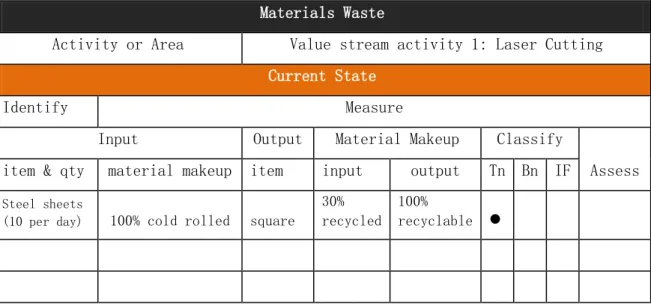
Determining how much of the input part is made of recycled material is also important, as it makes the starting point of going green clear. So does to the determining whether and how much percentage of the material outputs can be recycled or composted. The recyclable input does not necessarily mean the recyclability of the output, since the process may change material’s ability to be recycled or composted. By identifying the input and output and measuring the recyclability and biodegradability, ways through which the material will go after its life can be chosen (i.e. Technical Nutrient (Tn), Biological Nutrient (Bn), or Neither (LF).
Technical Nutrient: materials that can be used again to make a new product.
Biological Nutrient: materials that can biodegrade and go back to enrich the earth or soil. LF: Materials that cannot be reused or put back to earth, just stay in the landfill forever. Below is a identification and measurement sheet for material waste with an example on it.
Materials Waste
Activity or Area Value stream activity 1: Laser Cutting
Current State
Identify Measure
Input Output Material Makeup Classify
Assess item & qty material makeup item input output Tn Bn IF
Steel sheets
(10 per day) 100% cold rolled square
30% recycled 100% recyclable
Table 4.3: Material waste identification and measurement
The “Assess” column indicates the impact of the identified material on the environment. There are four categories of assess results, signified by four colors (i.e. green, yellow, red, gray) (Wills, 2009).
Green: little or no risk to the environment or human health from using this substance. Yellow: low to moderate risk associated with using this material. It is acceptable for use, if a material of green category can replace the yellow one.
Red: High impact and risk to the environment and human health from using this material. A strategy for phasing out this material and replace it with a green or yellow material needs to be developed.
Grey: Risk data is missing or incomplete. Further investigation and research in needed in order to rate the substance.
4.1.4 Garbage
The measurement to garbage should contain two parts. One is to measure the makeup of garbage in the value stream; the other one is to measure the hazardous substances contained in the garbage.
To measure the makeup of garbage, firstly, find out all the trash bins, cans, and bags. Then list the individual items or materials which comprise the garbage, because this will enable personnel focus on each of the items, and make it easier to minimize and eliminate them. The items can be measured either by counting them at the end of each day, week, or month, or by weighing each of the items or materials. This is subject to the countability and the size of the items or materials. Even though an item is countable, if the size or weight is quite distinct from piece to piece, then weighing them is considered a better way. Measuring will highlight the items and materials that contribute the greatest amounts and are costing the most money. The job can be done by manufacturer itself, or by outsourcing it to a waste management company (e.g. Stena in Sweden).
It is worth notice that the measurement may require a couple of days, weeks, or months continuously in order to get an average number, because the amount of waste can be quite different from day to day due to the production schedule.
Garbage could be harmful to environment because some pollutant might be contained within garbage. Thus, it is of importance to measure the hazardous substances in garbage. Hazardous substances are the most expensive to dispose of, for it requires special handling, transportation, final disposal, and so forth (Wills, 2009).
Normally, the garbage within a value stream is probably made up of offcut and defect. Measuring the hazardous substance might be excessive work, because this has been done by assessing material stated in last section. If the garbage is other kinds, for example, packaging, the same work ought to be done again. There are several ways to do such work: Check the legislation that company has to follow, hazardous substances should have
been listed and stated in it;
Check up the material safety data sheets (MSDS).
Ask purchasing/production manager, they are likely aware of what substances used in its production are hazardous.
Ask the vendor or producer of the product, they are required to know whether it is considered hazardous.
Following is an assumed table which can be used to record the measurement.
Garbage Waste
Activity or area Value stream activity 1: Laser Cutting
Current State
Identify Measure
item material quantity hazardous substances