Improving Player Engagement in
Tetris Through EDR Monitoring
Bachelor’s Essay
DD143X Degree Project in Computer Science
Authors:
Medya Acin
Elvis Stansvik
Supervisor:
Anna Hjalmarsson
12 April 2013
Abstract
When designing computer games, one is often interested in evoking feelings of engagement, enjoyment and challenge in the player. One way of doing so is dynamically adjusting the difficulty of the game. Traditionally, this adjustment has been based on the performance of the player. However, in recent years there has been an increased interest in dynamically adjusting the difficulty level of a game based on physiological signals from the player. In this Bachelor’s project, we have studied the effect of using an electrodermal activity (EDA) wristband sensor as the source signal for the difficulty adjustment algorithm and com-pared it to the traditional approach of using the performance of the player. We developed two Tetris games, one EDA controlled and one performance con-trolled, and let participants play them both. Each game session was followed by a questionnaire. Our results show that, although participants reported an increased sense of engagement and challenge when playing the EDA version, further research is necessary before the usefulness of EDA in this setting can be established.
Sammanfattning
I utformningen av datorspel är man ofta intresserad av att väcka känslor av engagemang, njutning och utmaning hos spelaren. Ett sätt att göra detta är att dynamiskt justera svårigheten i spelet. Detta har traditionellt gjorts genom att man låter svårigheten baseras på spelarens prestation. Under senare år har dock intresset ökat för tekniker där man låter svårigheten variera baserat på fysiologiska signaler från spelaren. I detta kandidatexamensprojekt har vi stu-derat effekten av att låta signalerna från en sensor för elektrodermal aktivitet (EDA) utgöra indatan till en algoritm för anpassning av spelsvårighet och jäm-fört detta med den traditionella prestandabaserade svårighetsanpassningen. Vi utvecklade två Tetrisspel, ett EDA-kontrollerat och ett prestandakontrollerat, och lät deltagare spela båda versionerna. Varje spelsession åtföljdes av en en-kät. Vårt resultat visar att, trots att deltagarna rapporterade en ökad känsla av engagemang och utmaning när de spelade EDA-versionen, så krävs ytterligare forskning för att EDA ska kunna anses användbart i detta sammanhang.
Table of Contents
1 Introduction 2
1.1 Anxiety and Challenge in Gaming . . . 2
1.2 Electrodermal Activity . . . 2
1.3 The Computer Game Tetris . . . 3
1.4 Previous Research . . . 3
1.5 Problem Statement . . . 4
2 Methodology 4 2.1 General Approach . . . 4
2.2 Game Design . . . 4
2.2.1 Performance Controlled Tetris . . . 5
2.2.2 EDA Controlled Tetris . . . 6
2.3 Experiment Setup . . . 8 2.4 Experiment Design . . . 9 3 Results 11 3.1 Questionnaire Data . . . 11 3.2 Statistical Analysis . . . 12 4 Discussion 12 4.1 Result Analysis . . . 12 4.2 Error Analysis . . . 13 4.2.1 Determining Thresholds . . . 13 4.2.2 Session Organising . . . 14 4.2.3 Number of Participants . . . 14 4.2.4 Delayed Response . . . 14 4.2.5 Assumptions . . . 14
4.3 Recommendations for Future Research . . . 14
5 Conclusions 15
1
Introduction
1.1
Anxiety and Challenge in Gaming
The quality of a computer game can to some extent be attributed to its ability to instill a feeling of engagement in the player. One way to reinforce this feeling throughout a game session is to always provide the player with an optimal level of challenge.
The technique of letting a computer game adapt to the current performance of the player is not new. One of the earliest examples is the 1986 game Zanac, in which the difficulty level is dynamically adjusted to the player’s skill level [Tho13]. The typical technique is to let the difficulty level of the game increase when the player performs well, and decrease when the player performs bad. The aim is to optimize the perceived challenge, allowing the player to feel a greater level of engagement and satisfaction than had the difficulty level been static. This is where a person’s anxiety level becomes a topic of interest, and techniques allowing us to study the peripheral physiological signals gives us a chance to individually adjust a game’s difficulty level.
In this paper, we investigate the effect of dynamically and individually ad-justing the difficulty level in the computer game Tetris. We make use of phys-iological signals determined from electrodermal activity to adjust the level ap-propriately.
1.2
Electrodermal Activity
Electrodermal activity (EDA) refers to the electrical conductance of the skin, which typically varies with its moisture level [Bou12, p. 69]. As sweat glands in the skin are controlled by the sympathetic nervous system [CSS07, p. 191], the conductance of the skin becomes a relatively good indicator of a person’s anxiety level [MEDB07]. By using signals from an EDA monitoring device, the difficulty level of the game can be adapted to psychological properties of the player such as stress and anxiety.
Electrodermal activity is typically divided into tonic and phasic activity: tonic activity represents physiological responses which are slow, and phasic those which are fast. The preferred method of measuring EDA is through skin con-ductance responses (SCR) which is found in the phasic activity. The SCRs are extracted and the amplitudes and frequencies of these are used to determine and identify emotions such as anxiety and stress. [MEDB07]
Electrodermal activity has been applied in various areas, such as psychology, psychiatry and psychophysiology. It is preferred over other autonomic nervous system response methods for being simple to analyze and producing rather re-liable and relevant data. Heart rate, pupil diameter and blood pressure may be more difficult to distinguish as they may be reflecting responses from sympa-thetic, parasympathetic or even both systems. Also, SCR responses are more clear with EDA signals, whereas other autonomic nervous system responses may be varying more rapidly, making it harder to identify the appropriate peaks. [MEDB07]
1.3
The Computer Game Tetris
Tetris was a reasonable choice, not only because it was in the original project proposal but also for several other reasons. It is a stress based game with the goal being to repeatedly clear rows of various-shaped pieces by fitting them gaplessly in a row. Pieces continuously flow downwards on the screen and if the pieces stack up too high and reach the top, the player loses. In the classic and most recognised version of the game, the difficulty increases over time, thus providing the player with a sense of challenge which may prove to be overwhelming for the player. This is where we believe our project will have the greatest impact; avoiding this overwhelming sensation and the inevitable defeat which would follow soon after. We hope to be able to allow the game to progress and be enjoyed for longer periods of time and to adjust its difficulty to the player’s personal stress level.
Tetris is also a classic game, familiar to many, which makes the game ideal and suitable for our study; there is little risk of game rules being unclear. Re-garding the technical aspect, the code for a Tetris game is rather straightforward.
1.4
Previous Research
In recent years, research has shown that letting the difficulty level of the game vary with the player’s anxiety level, instead of performance, may give the player a greater sense of engagement and challenge [RSL05]. It is believed that both performance and psychological factors should be taken into consideration when determining an optimal difficulty level in a game, as players are motivated for different reasons [LASC09]. Some players may prefer to lose multiple times only to feel more motivated the next try, while others may easily breeze through levels while analyzing details and finding motivation in simply perfecting the game-play. In both these cases, simply adjusting the difficulty level by performance might not suffice or reflect the person’s actual feeling of success.
Liu et al. performed experiments using multiple sampling methods to exam-ine how dynamic difficulty adjustment in the game Pong satisfied and engaged its players [LASC09]. The methods in their experiment were centralised around physiological signals; these signals are mostly involuntary, and therefore pre-ferred over physical expressions, which can be affected by culture, gender and/or age [LASC09]. The experiment was set up in two parts, the first part covering the classification and formation of an affective model based on physiological signals, and the second part using the model to identify emotional states and letting these dynamically adjust the game’s difficulty level. The results ob-tained showed that most participants felt the game was more challenging and satisfying with a physiological signal-based difficulty adjustment rather than a performance based one. Most players also performed better with the version controlled by physiological signals.
Chanel et al. investigated emotional states determined by physiological sig-nals in order to study the impact of different difficulties of a game. A Tetris game with three difficulty levels was designed, physiological data was extracted and self-reports were conducted. Similarly to Liu et al., they conducted the experiment by first determining and classifying different emotional states and then identifying these appropriately for the emotional states during gameplay. Results strongly related the low difficulties with states of low pleasure, low
pressure, low arousal and low motivation, identified as boredom; medium diffi-culties related with states of higher arousal, higher pleasure, higher motivation, and higher amusement, seen as engagement; and finally hard difficulty with high arousal, high pressure, and low pleasure - anxiety. They also concluded from their results that a player’s engagement decreases if the game difficulty stays static, stressing the importance of adjusting the game difficulty to satisfy the individual [CRBP11]. Research similar to this brought light to dynamically adjusting game difficulty.
1.5
Problem Statement
We will try to confirm the results established by Liu et al. by creating two versions of the classical computer game Tetris. In the first version, the difficulty level of the game will adjust according to the player’s performance. In the second version, it will adjust itself to the electrical conductance of the player’s skin, as measured by a wristband EDA sensor. We know from previous research that changing the difficulty level of Tetris with the player’s anxiety level increase the player’s feeling of satisfaction with the game. Our goal will be to find out whether EDA alone provides sufficient data in order to confirm these results.
2
Methodology
2.1
General Approach
Our general approach was to modify a Tetris clone which we picked from a num-ber of open source projects. Due to the popularity of Tetris, it was not a difficult task to find projects; the challenge was rather in finding well-documented and relatively easy to understand code.
The EDA monitoring device we used was the Affectiva QSensor device. QSensor was chosen for several reasons. The wristband was readily available to us and it was relatively cheap in comparison to other technologies, while still being small and effective. The support for real-time data streaming made it even more suitable and attractive [Wes11]. The device is designed to measure the skin conductance on the wrist; however, we had a modified version where the electrodes were designed to be put on two finger tips as those areas are more sensitive and produce better signals.
The idea was to implement two Tetris versions; one being EDA monitored and one adjusting according to player’s performance. The purpose of both versions was to personalise the game’s difficulty to suit the individual’s skills and needs, but in two different ways. The performance controlled version assumes that performing well indicates the need for more challenge and so the difficulty would rise. In the EDA monitored version, one tries to avoid such assumptions by identifying stress through physiological signals and decrease levels in times of anxiety and increase it in times of boredom.
2.2
Game Design
Two computer games were designed and developed. The two games consisted of modified versions of a Tetris game. In the first game, the difficulty is dynamically
adjusted to the current performance of the player. In the second game, the difficulty is dynamically adjusted to the level of stress the player is experiencing. After some initial research into finding a suitable game to use as a starting point, the Tetris clone Gottet [Got13] developed by Graeme Gott was picked as a basis for both games. In addition to its liberal open source license, a necessity for us to be able to do our modifications, Gottet offered several benefits. Firstly, the small size of its source code (roughly 1000 lines of code) made it easier to find the entry points for the modifications that had to be done. Secondly, the simple design of the game itself, essentially a replica of the 1984 original, meant our modified games would be free of any distractions that might skew the result of the experiment. Finally, the game is written in the C++ programming language using the Qt framework, a huge library of C++ classes for writing GUI applications [Dig13], and both these technologies were familiar to us.
Changing the difficulty of Tetris can be done in several ways. Perhaps the most obvious one is to the change the speed with which the current piece is falling. This technique can be seen in many versions of the game. Another way is to introduce distracting elements or behavior. After some experimentation with unconventional techniques such as switching the functionality of the left and right key, normally used for moving the piece sideways, we decided to stick to the more conventional changing of speed as our sole technique for altering the difficulty level. We introduced three levels of difficulty: Level 1, Level 2 and Level 3. In Level 1, the current piece would fall with a speed of one step per second, in Level 2 with a speed of two steps per second and in Level 3 with a speed of four steps per second.
2.2.1 Performance Controlled Tetris
For the performance controlled game, there were several possible methods for determining the current performance of the player. The task was to find a measure of performance that gives an accurate and dynamic indication of how well the player is currently performing. After considering a couple of alternative methods, such as using the total number of cleared rows or the frequency of cleared rows, we settled on using the height of the stack of pieces as a measure. When the player is doing bad in the game, the stack of pieces grow. This growth is slowed down, stopped and even reversed when the player performs better and starts clearing rows. This approach is better than using the total number of cleared rows since it’s dynamic - it gives a reasonably accurate indication of the player’s current performance. As soon as the player puts down a piece in such a way that the height of the stack grows, or in such a way that one or more rows are cleared, a new performance measure can be calculated. Less formally put, this is also how we think most people would intuitively judge the current performance of the player when observing a game of Tetris. For these reasons, this is the approach that was chosen.
The Tetris playing field consists of a 10× 20 grid of positions. Since we
de-cided to go with three difficulty levels, we needed to vertically divide the playing field into three sections corresponding to the three difficulty levels. The top of the stack would then be determined to be within one of the three sections, and the difficulty level set accordingly. After some preliminary testing we decided to let the section consisting of rows 1-6 (from the bottom) correspond to Level 3, the section consisting of rows 7-12 correspond to Level 2 and the section
Figure 1: The division of the playing field into three sections corresponding to different difficulty levels.
consisting of the remaining rows 13-20 correspond to Level 1. The division of the playing into the three sections is illustrated in figure 1. The code modifi-cations required to put this mechanism into place were small and amounted to the addition of a few lines of code to a pre-existing class Board.
2.2.2 EDA Controlled Tetris
As previously mentioned, the game Gottet that was used as a starting point for both games is written in C++ using the Qt development framework. Com-munication between objects in a Qt application is normally done through the signal/slot mechanism at the heart of the Qt framework. Signals are emitted by objects when they change state in a way that may be of interest to other objects. Signals are connected to slots which will then be called when the sig-nal is emitted. The calling of the appropriate slots when a sigsig-nal is emitted is handled asynchronously by Qt’s event loop. Together, signals and slots make up a powerful component programming mechanism and it turned out that this mechanism worked out quite well for our purposes.
In its unmodified state, Gottet consists of a few classes such as: Window, representing the main window containing menus, buttons and all the other game elements; Board, representing the visible region of the window containing the Tetris playing field as well as holding the game state; and finally Piece along with its auxiliary class Cell, which together represents a single piece in the game. For the EDA controlled game, we needed to extend the game to continuously collect and analyze raw data coming from the EDA sensor and also to react when the result of an analysis is ready. For this, we added two new components, Sensor and Analyzer.
Sensor is the component responsible for collecting the raw data from the EDA sensor. The sensor is wireless and communication with it happens over RFCOMM, a Bluetooth protocol providing an emulated RS-232 serial port. By first binding the Bluetooth device to a local serial port device and then using the third party Qt extension QtSerialPort, the Sensor component was made
to collect the data as it arrives from the EDA sensor. The sensor sends its data in the form of lines of comma separated values (CSV). Each line contains readings for g-forces from the built-in accelerometer, temperature, battery level and finally skin conductance in microsiemens (µS). The Sensor component continuously collects these readings and every five seconds it will emit a signal with the last five seconds of data as argument.
Analyzer is the component responsible for analyzing the data collected by Sensor. It connects the signal from Sensor to one of its slots. When the signal from Sensor arrives with a new batch of readings, Analyzer uses the MATLAB Engine library to make a call to Ledalab, a third party MATLAB software for EDA analysis. The output from Ledalab is a list of amplitudes of the SCRs that were detected in the data. Analyzer then proceeds to calculate the median of these amplitudes. Analyzer can be configured with two thresholds, a high threshold and a low threshold. If the median calculated at the end of the analysis is below the low threshold, Analyzer will emit a signal that signifies that the player has a low stress level. If the median is above the low threshold but below the high threshold, a signal that signifies that the player has a normal stress level is emitted. Finally, if the median is above the high threshold, a signal that signifies that the player has a high stress level will be emitted.
Figure 2: Overview of the threads and main classes.
A simplified diagram showing the main components of the EDA controlled game can be seen in figure 2. The diagram also shows how the Sensor component along with its auxiliary component SensorReading is running in a separate thread. This was required to avoid Sensor blocking the Qt event loop running the original game code, which would disturb the responsiveness of the game. For the same
reason, to avoid Analyzer disturbing the Sensor component while performing the relatively long-running MATLAB analysis, it was also put in a separate thread.
Figure 3: Transitions between difficulty levels based on stress levels High (H), Medium (M) and Low (L).
With these two components in place, we proceeded to make the necessary changes to let the game adjust the difficulty level according to the stress level of the player. A new slot was added to Board, the original Gottet component containing most of the game logic and state, and connected to the signals from Analyzer. When a signal arrives with a new stress level, the slot adjusts the dif-ficulty of the game according to the transitions shown in figure 3. The diagram shows that if the player is experiencing a low level of stress, the difficulty level will be increased (unless already Level 3), while if the player is experiencing a high level of stress, the difficulty will be decreased (unless already Level 1).
2.3
Experiment Setup
The set-up used for the experiment is shown schematically in figure 4. The computer C1 was configured with the two versions of the Tetris game and used by the participant during the experiment session. The EDA sensor worn by the participant was connected to C1 via a Bluetooth connection and was con-figured to use a sampling rate of 32 Hz, which was the highest sampling rate supported by the device. Right-handed participants wore the device on their left hand, while left-handed participants wore it on their right hand, to avoid any interference with the hand used to operate the game controls.
For monitoring purposes, a second computer C2 operated by the experiment supervisor was set up. The C2 computer allowed the supervisor to connect to C1 and ensure that the sensor was receiving a steady stream of data during the course of the experiment session.
The environment used for the set-up was a computer room at KTH. Most of the experiment sessions took place during the Easter break, and the computer rooms were relatively quiet during the sessions. Between the participant and the supervisor was a low dividing wall.
2.4
Experiment Design
There were 8 participants (P1-P8) in our experiment, 4 females and 4 males, all chosen among friends and random friendly students at KTH. Their ages ranged from 19 to 34, and their backgrounds were quite diverse. We kept most information about the study hidden, in order to prevent the participants from being influenced or biased. The information available to them was written as a short introductory text on the screen.
For each participant, two sessions were organized. All sessions took place during the course of a week. In the first session, the participant was asked to play the performance controlled version of Tetris for 15 minutes. During these 15 minutes, the participant was wearing the EDA sensor and the data, although not used to control the difficulty of the game, was recorded. In the second session, the participant was asked to play the EDA controlled version of Tetris for 15 minutes. Participants were told that they would be playing two versions of Tetris, but no further feedback about the nature of the differences between these versions were given, and they were not told which version of the game they would be playing at the start of the session. The game itself gave no extra feedback to the participant when the difficulty level was changed. The two sessions were held on different days, to minimize habituation effects.
Participant Low threshold High threshold
P1 0.728 0.802 P2 1.052 1.163 P3 0.358 0.456 P4 0.287 0.340 P5 0.805 0.886 P6 0.610 0.645 P7 0.975 1.105 P8 0.710 0.835
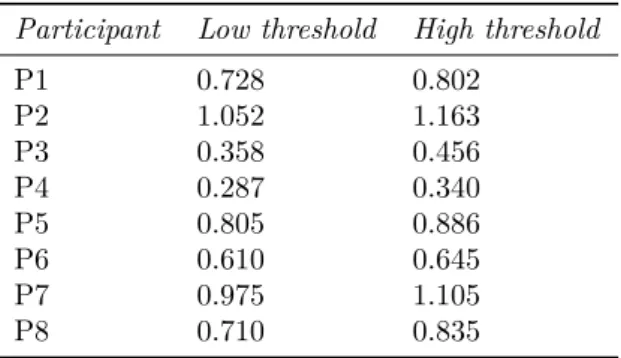
Table 1: Thresholds used during the EDA sessions for each participant. For the session with the EDA controlled Tetris, we needed threshold values to configure the Analyzer component with. These thresholds were calculated from the EDA data from the performance controlled session as follows: For each five second window of data the median of the detected SCRs within that window was calculated. This produced roughly 180 such medians. The medians were fitted to a normal distribution and the expected value µ and standard deviation
σ were calculated. The low and high thresholds for Analyzer, to be used in the
EDA controlled session, were then taken as
low = µ− 0.5σ high = µ + 0.5σ
The idea was that these thresholds would represent points at which the partici-pant would feel bored and stressed, respectively. The thresholds were found to vary quite a lot. Table 1 shows the calculated thresholds for each participant.
The questionnaire, available in figure 6 in Appendix A, at the end of each session consisted of a number of five-point Likert-type items [Lik32]. The items were designed to measure the participant’s perceived engagement, enjoyment, challenge and stress, since these are the factors which we believe forms the basis of an enjoyable and successful gaming experience. It also asked participants to give an appraisal of their own performance. The results were tabulated, graphed and statistically analyzed to see whether the EDA controlled difficulty adjustment had given rise to any significant change compared to performance controlled difficulty adjustment. Specifically, the questionnaire asked the par-ticipant to rate how strongly they agreed with the following statements:
• I experienced a high level of engagement. • I experienced a high level of enjoyment. • I experienced a high level of challenge. • I experienced a high level of stress. • I think my level of performance was good.
These statements are referred to in the results below as Engagement, Enjoy-ment, Challenge, Stress and Performance Appraisal, respectively. The responses available to participants for rating their agreement with each statement were: “Strongly disagree”, “Disagree”, “Neutral”, “Agree” and “Strongly agree”. For the analysis of the data from the questionnaire, these items were given the numeric values 1, 2, 3, 4 and 5, respectively.
3
Results
3.1
Questionnaire Data
Table 2 shows the results from the questionnaire for all participants across the performance and EDA controlled versions, along with the five-number sum-maries.
Engagement Enjoyment Challenge Stress Performance Appraisal Participant P E P E P E P E P E P1 4 5 2 5 4 4 3 3 2 5 P2 3 4 4 4 3 3 2 3 1 1 P3 4 4 4 4 2 3 2 3 4 4 P4 2 3 2 3 4 4 3 4 1 3 P5 4 4 4 3 3 4 2 3 3 2 P6 4 4 3 4 4 4 4 4 2 2 P7 4 5 4 3 5 5 4 5 2 1 P8 4 4 5 3 4 5 4 5 2 2 Minimum: 2 3 2 3 2 3 2 3 1 1 25-percentile: 3.75 4 2.75 3 3 3.75 2 3 1.75 1.75 Median: 4 4 4 3.5 4 4 3 3.5 2 2 75-percentile: 4 4.25 4 4 4 4.25 4 4.25 2.25 3.25 Maximum: 4 5 5 5 5 5 4 5 4 5
Table 2: Results from questionnaires for all participants across performance controlled (P) and EDA controlled (E) versions of Tetris, including five-number summaries.
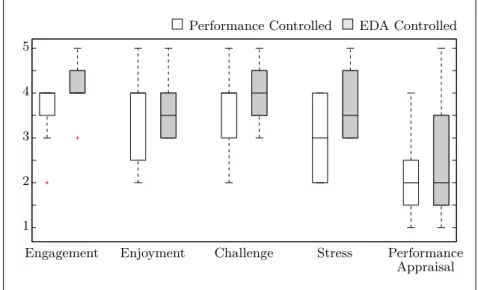
A box plot graph seen in figure 5 was derived from our five-number summary, based on the questionnaire data.
Performance Controlled EDA Controlled 5
4
3
2
1
Engagement Enjoyment Challenge Stress Performance Appraisal
Figure 5: Box plot graph showing the five-number summary of data.
3.2
Statistical Analysis
A Wilcoxon signed-rank test was conducted on the questionnaire data, using the statistics software SPSS. The resulting p-values for each of the Likert items can be seen in table 3.
Engagement Enjoyment Challenge Stress Performance Appraisal Z -2.000 -0.108 -1.732 -2.449 -0.736
Asymp. Sig. (2-tailed) 0.046 0.914 0.083 0.014 0.461
Table 3: p-values from the Wilcoxon signed-rank test for each tested variable.
4
Discussion
4.1
Result Analysis
Engagement
All participants reported a higher or unchanged level of engagement while play-ing the EDA controlled version compared to the performance controlled version. While playing the EDA version, four participants reported a higher level engage-ment and four reported no change. None of the participants reported a lower level of engagement with the EDA controlled version of the game. The Wilcoxon signed-rank test shows a statistically significant increase in engagement with the participants (p = 0.046 < 0.05, Z =−2.000).
Enjoyment
The sense of enjoyment varied greatly among participants. Three participants reported higher level of enjoyment while two participants reported an unchanged level. Three participants reported a decrease in enjoyment. The Wilcoxon signed-rank test showed no significant increase in enjoyment (p = 0.914 > 0.05,
Z =−0.108). Challenge
The sense of challenge was increased for three players, and the other five players perceived the same challenge in both game versions. While this is a noticeable increase from the performance controlled version, it is not statistically signifi-cant, with the Wilcoxon signed-rank test giving a p value of 0.083 > 0.05.
Stress
All participants perceived higher or unchanged level of stress during the EDA controlled version compared to the performance controlled. With the EDA con-trolled version, six participants felt higher stress and two felt no change. The Wilcoxon test showed this as a statistically significant increase in the level of stress reported by the participants, with a p value of 0.014.
Performance Appraisal
Participants gave quite varied appraisals of their own performance. Four par-ticipants reported their performance as unchanged between playing the two versions, two participants felt a performance level increase and two people a
decrease. The Wilcoxon test showed no signficant increase in the participants appraisal of their own performance, with a p value of 0.461.
To summarize the results from the questionnaire, we found that two out of five variables saw a statistically significant increase: engagement and stress. The increase in engagement being significant is rather interesting, as it is one of the three measured variables, along with enjoyment and challenge, which reflect the participant’s satisfaction with the game. It is a concern however, that engage-ment may have been affected by the order of our experiengage-ments; always doing the performance session before the EDA may have resulted in participants feeling more secure during the EDA session and could therefore have skewed the result. The changes in the other two variables regarding satisfaction, enjoyment and challenge, did not prove to be statistically significant. One reason could be that there was not enough data to establish a clear change; another reason could be incorrect difficulty adjustments due to the thresholds being based on data from a single session and not studied over a long period of time. The significant increase in stress may also have been due to this, since people may not have had accurate enough thresholds, the difficulty would not change according to the participant’s anxiety. Some of the participants expressed these feelings of stress during the experiment, being surprised at how difficult the game suddenly became.
Enjoyment is a rather sensitive emotion; many external factors may have af-fected the answer to this question and due to the low number of participants, the variability in their answers will have a great impact. Although not statistically significant, participants reported a definite increase in their sense of challenge. This makes sense since the game became more difficult for most participants who felt the game became more stressful. Again, this may have been a result of not calibrating the anxiety thresholds properly.
Participants rated their performance relatively positive. The two partici-pants who rated their performance to have worsened were also the only people to have rated their challenge and stress highest. This may be an indication of these two participants playing with incorrect threshold values, and therefore the game becoming too difficult. The performance appraisal data may also be negatively affected by participant’s modesty. A participant may have improved greatly in performance but did not feel it strong enough to have been reflected in the questionnaire.
4.2
Error Analysis
Due to our limited experience with experimental research, several potential flaws in how the experiment was conducted needs to be taken into consideration when looking at the results.
4.2.1 Determining Thresholds
Basing the threshold calculation on output from the first session and then using these thresholds for the second session may not have been the most optimal choice. The performance based version might not have reflected how stressed the person can potentially be, especially if the person found the performance version very easy and boring. It may be a better idea to organise a stressful
session of a different sort, and use the data from this session to determine the thresholds for the EDA version. This stressful session could for instance be a timed task which is impossible to complete, but not known to the player.
4.2.2 Session Organising
Due to several factors, we decided to first conduct the performance controlled session, followed by the EDA controlled session. This can be a source of error; participants may have grown feelings of boredom, annoyance or possibly even lost their interest in the game due to their experience with the first version, and the final data may reflect this. We were not able to do this as we needed the output from the performance session for our EDA session, but if time had allowed we could have avoided this possible error by randomising the order for each participant. Participants were also limited to one session for each type of game version; one session’s data can be sensitive to external factors such as a generally stressful day at work. One could have decided to have two or three sessions of each game type to avoid this error. Another issue with experiment sessions was the short time between them. We tried to avoid habituation by having the sessions on different days, but we could have increased the time between them even more.
4.2.3 Number of Participants
Apart from these errors, the low number of participants can also be consid-ered an error risk, as the low amount of data may be hard to generalise. We tried to minimize the error by picking people from different backgrounds and experiences.
4.2.4 Delayed Response
The participant may have felt a delay in response during the game play; the data from the EDA wristband had to be processed through Ledalab first, meaning the level adjustments may not have been dynamic enough. Ledalab had its limits, and although we managed to overcome many difficulties while working with the Ledalab code, there could be a possible error due to an experienced “lag”. The participant may have felt stressed but the corresponding change in difficulty may not have taken place until it was too late and a new game had started.
4.2.5 Assumptions
We performed the experiment under the assumption that there is a correlation between the amplitudes of SCRs and the participant’s perceived feelings of en-gagement, enjoyment, challenge and stress. The experiment could have been preceded by a preliminary study, where the correlation between EDA responses and the studied variables could have been established statistically.
4.3
Recommendations for Future Research
There is plenty of room for improvement when researching and performing an experiment for this purpose. Our greatest limitation was time. More time would
have allowed for more thorough research and more careful preparation of the experiment.
The number of participants could be greatly increased for more reliable data. More participants provide greater variety in backgrounds, larger cover-age of people with different skill levels, avoidance of “flukes” in data and as a result, generate smoother generalisation and easy-to-spot “noisy” data. Flukes and noisy data may consist of people who: do not respond to the device as expected, may never feel stressed from playing Tetris or completed the ques-tionnaire using false information. The latter being a vital source of information for our experiment on how the player perceived the game.
Another way of improving the experiment would be with additional resources to measure physiological signals. With more techniques and methods, determin-ing the point of anxiety becomes more distinct, and therefore better stress levels can be calculated to suit the individual’s needs.
5
Conclusions
In recent years, several researchers have studied the use of physiological signals to dynamically adjust the difficulty of various games. Most of these studies have used a variety of signals such as EDA, heart rate, perspiration and EEG/EKG. In this study, we have seen that using the signal of a single EDA sensor may be enough to have a significant effect on the engagement of the player while playing Tetris. However, we were not able to establish the same when it came to feelings of enjoyment or challenge.
Nonetheless, we still think the use of EDA as a difficulty adjustment tech-nique in computer games might have a future. The use of EDA as the only physiological signal has several benefits. One is the relatively low cost of the technology. Another is that EDA sensors are not as intrusive as some of the other techniques: It’s easy to put on and does not require puncturing the skin. For these reasons, we sincerely hope that other researchers will perform more thorough experiments in the future.
Our goal with this project was to find out whether EDA alone could provide sufficient data in order to confirm the results of other researchers in this area. It seems the results of Liu et al. is dependant on the multitude of physiological sampling methods they used. However, since we did find some significant data, we do not want to rule out the possibility that further research would show that EDA is a viable single source after all.
References
[Bou12] Wolfram Boucsein. Electrodermal Activity. The Springer series in behavioral psychophysiology and medicine. Springer
Science+Business Media, LLC, Second edition, 2012. [CRBP11] Guillaume Chanel, Cyril Rebetez, Mireille Bétrancourt, and
Thierry Pun. Emotion assessment from physiological signals for adaptation of game difficulty. Systems, Man and Cybernetics, Part
A: Systems and Humans, IEEE Transactions on, 41(6):1052–1063,
2011.
[CSS07] Valerie C. Scanlon and Tina Sanders. Essentials of Anatomy and
Physiology. F.A. Davis Company, Fifth edition, 2007.
[Dig13] Digia. Qt – A Cross-platform Application and UI Framework. http://qt-project.org/, 2013. [Online; accessed 2013-04-12]. [Got13] Graeme Gott. Gottet – A Tetris Clone.
http://gottcode.org/gottet/, 2013. [Online; accessed 2013-04-12].
[LASC09] Changchun Liu, Pramila Agrawal, Nilanjan Sarkar, and Shuo Chen. Dynamic difficulty adjustment in computer games through real-time anxiety-based affective feedback. Intl. Journal of
Human–Computer Interaction, 25(6):506–529, 2009.
[Lik32] Rensis Likert. A technique for the measurement of attitudes.
Archives of Psychology, 1932.
[MEDB07] Diane L. Filion Michael E. Dawson, Anne M. Schell and Gary G. Berntson. Handbook of Psychophysiology. pp. 159–164. Cambridge University Press, 2007.
[RSL05] Pramila Rani, Nilanjan Sarkar, and Changchun Liu. Maintaining optimal challenge in computer games through real-time
physiological feedback. In Proceedings of the 11th International
Conference on Human Computer Interaction, pages 184–192, 2005.
[Tho13] Lucas M. Thomas. Zanac Review – Ask your doctor if prescription Zanac is right for you.
http://www.ign.com/articles/2007/12/06/zanac-review, 2013. [Online; accessed 2013-04-11].
[Wes11] J Christopher Westland. Electrodermal Response in Gaming.
Appendix A: Questionnaire Design
Figure 6: Design of the questionnaire issued to participants at the end of each experiment session.