Journal of Civil Engineering
and Architecture
Volume 8, Number 6, June 2014 (Serial Number 79)
David Publishing Company www.davidpublishing.com P u b l i s h i n g Dav i d
Publication Information:
Journal of Civil Engineering and Architecture is published monthly in hard copy (ISSN 1934-7359) and online (ISSN
1934-7367) by David Publishing Company located at 240 Nagle Avenue #15C, New York, NY 10034, USA. Aims and Scope:
Journal of Civil Engineering and Architecture, a monthly professional academic journal, covers all sorts of researches
on structure engineering, geotechnical engineering, underground engineering, engineering management, etc. as well as other issues.
Editorial Board Members:
Dr. Tamer A. El Maaddawy (Canada), Prof. San-Shyan Lin (China Taiwan), Dr. Songbai Cai (China), Prof. Vladimir Patrcevic (Croatia), Dr. Sherif Ahmed Ali Sheta (Egypt), Prof. Nasamat Abdel Kader (Egypt), Prof. Mohamed Al-Gharieb Sakr (Egypt), Prof. Olga Popovic Larsen (Denmark), Prof. George C. Manos (Greece), Dr. Konstantinos Giannakos (Greece), Pakwai Chan (Hong Kong), Chiara Vernizzi (Italy), Prof. Michele Maugeri (Italy), Dr. Giovanna Vessia (Italy), Prof. Valentina Zileska-Pancovska (Macedonia), Dr. J. Jayaprakash (Malaysia), Mr. Fathollah Sajedi (Malaysia), Prof. Nathaniel Anny Aniekwu (Nigeria), Dr. Marta Słowik (Poland), Dr. Rafael Aguilar (Portugal), Dr. Moataz A. S. Badawi (Saudi Arabia), Prof. David Chua Kim Huat (Singapore), Dr. Ming An (UK), Prof. Ahmed Elseragy (UK), Prof. Jamal Khatib (UK), Dr. John Kinuthia (UK), Dr. Johnnie Ben-Edigbe (UK), Dr. Yail Jimmy Kim (USA), Dr. Muang Seniwongse (USA), Prof. Xiaoduan Sun (USA), Dr. Zihan Yan (USA), Dr. Tadeh Zirakian (USA). Manuscripts can be submitted via Web Submission, or E-mail to civil@davidpublishing.com or civil@davidpublishing.org. Submission guidelines and Web Submission system are available at http://www.davidpublishing.com, www.davidpublishing.org.
Editorial Office:
240 Nagle Avenue #15C, New York, NY 10034, USA
Tel: 1-323-984-7526, 323-410-1082 Fax: 1-323-984-7374, 323-908-0457
E-mail: civil@davidpublishing.com; civil@davidpublishing.org; shelly@davidpublishing.com.
Copyright©2014 by David Publishing Company and individual contributors. All rights reserved. David Publishing Company holds the exclusive copyright of all the contents of this journal. In accordance with the international convention, no part of this journal may be reproduced or transmitted by any media or publishing organs (including various websites) without the written permission of the copyright holder. Otherwise, any conduct would be considered as the violation of the copyright. The contents of this journal are available for any citation. However, all the citations should be clearly indicated with the title of this journal, serial number and the name of the author. Abstracted / Indexed in:
Database of EBSCO, Massachusetts, USA Cambridge Science Abstracts (CSA) Ulrich’s Periodicals Directory
Chinese Database of CEPS, Airiti Inc. & OCLC Summon Serials Solutions, USA
China National Knowledge Infrastructure (CNKI) Google Scholar
ProQuest, USA J-Gate
Subscription Information:
$640/year (print) $380/year (online) $700/year (print and online) David Publishing Company
240 Nagle Avenue #15C, New York, NY 10034, USA
Tel: 1-323-984-7526, 323-410-1082 Fax: 1-323-984-7374, 323-908-0457 E-mail: order@davidpublishing.com
Digital Cooperative Company: www.bookan.com.cn
David Publishing Company www.davidpublishing.com
DAVID PUBLISHING
Journal of Civil Engineering
and Architecture
Volume 8, Number 6, June 2014 (Serial Number 79)
Contents
Materials and Structures
673 Finite Element ANSYS Analysis of the Behavior for 6061-T6 Aluminum Alloy Tubes under Cyclic Bending with External Pressure
Kuo-Long Lee, Chen-Cheng Chung and Wen-Fung Pan
680 Cold In-Place Recycling as a Sustainable Pavement Practice Kang-Won Wayne Lee, Max Mueller and Ajay Singh
693 Mechanical Properties of Graphene within the Framework of Gradient Theory of Adhesion Petr Anatolevich Belov
Buildings and Construction Projects
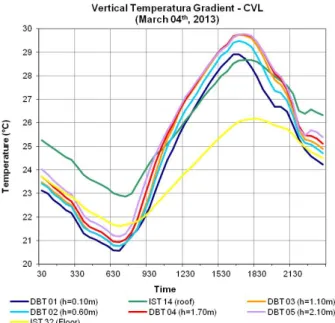
699 Spatial Distribution of Internal Temperatures in a LGR (Light Green Roof) for Brazilian Tropical Weather
Grace Tibério Cardoso de Seixas and Francisco Vecchia
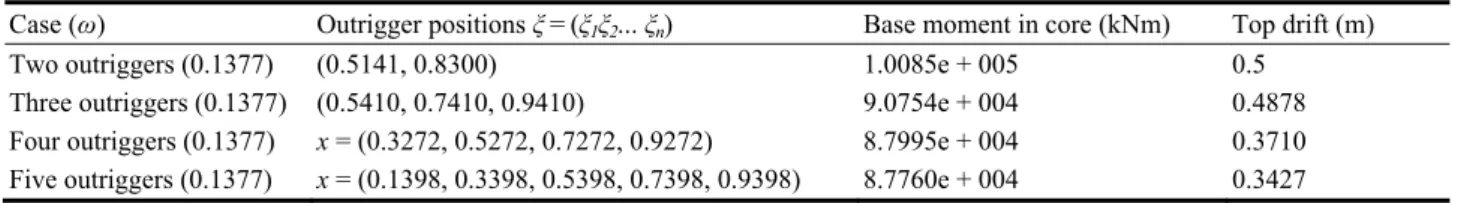
709 Optimum Design of Outrigger and Belt Truss Systems Using Genetic Algorithm Bianca Parv, Radu Hulea, Monica Nicoreac and Bogdan Petrina
716 Design and Management of Building’s Resources Ekaterina Sentova
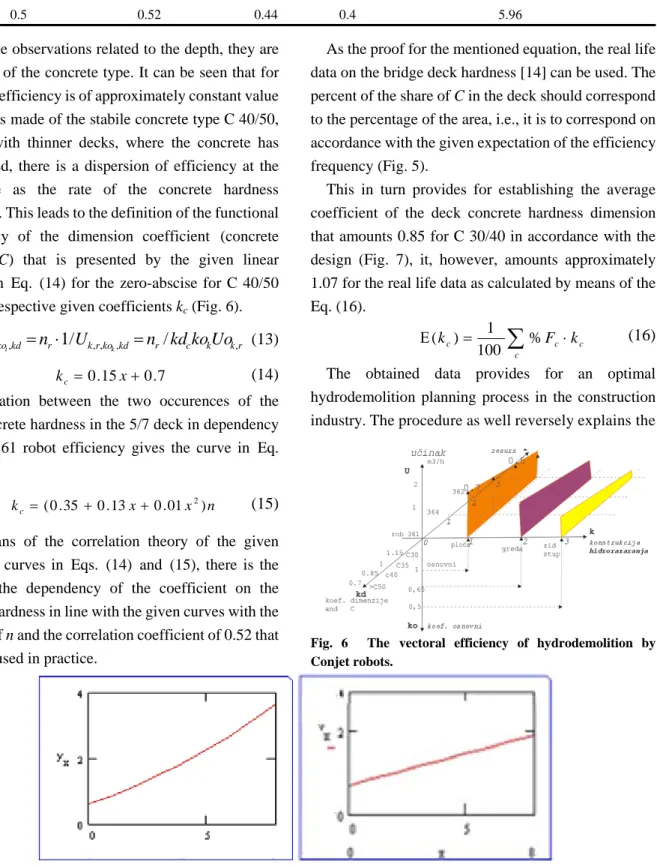
722 Application of Norms Models with Vectoral System in Construction Projects Vladimir Križaić
729 Wood Preservative Solutions for Creative and Sustainable Bridge Design and Construction Ted John LaDoux
738 Organizational Trouble Shooting through Integration between the Theory of the Restrictions Thinking Process and Lean Tools
Tatiana Gondim do Amaral and Vitor Hugo Martins Resende
Urban Planning
746 Narratives of Spatial Division: The Role of Social Memory in Shaping Urban Space in Belfast Clare Mulholland, Mohamed Gamal Abdelmonem and Gehan Selim
Raffaele Pernice
772 Absorbing the Rapid Growth of Shopping Centres in Poland after the Political Change Sławomir Ledwoń
Geotechnical and Environmental Engineering
783 Effective Utilization of Concrete Sludge as Soil Improvement Materials Seishi Tomohisa, Yasuyuki Nabeshima, Toshiki Noguchi and Yuya Miura
790 Climate Change and Future Long-Term Trends of Rainfall at North-East of Iraq
Journal of Civil Engineering and Architecture, ISSN 1934-7359, USA
Finite Element ANSYS Analysis of the Behavior for
6061-T6 Aluminum Alloy Tubes under Cyclic Bending
with External Pressure
Kuo-Long Lee1, Chen-Cheng Chung2 and Wen-Fung Pan2
1. Department of Innovative Design and Entrepreneurship Management, Far East University, Tainan 70101, Taiwan, R.O.C 2. Department of Engineering Science, National Cheng Kung University, Tainan 70101, Taiwan, R.O.C
Abstract: In this paper, by using adequate stress-strain relationship, mesh elements, boundary conditions and loading conditions, the
finite element ANSYS analysis on the behavior of circular tubes subjected to symmetrical cyclic bending with or without external pressure is discussed. The behavior includes the moment-curvature and ovalization-curvature relationships. In addition, the calculated ovalizations at two different sections, middle and right cross-sections, are also included. Experimental data for 6061-T6 aluminum alloy tubes subjected to cyclic bending with or without external pressure were compared with the ANSYS analysis. It has been shown that the analysis of the elastoplatic moment-curvature relationship and the symmetrical, ratcheting and increasing ovalization-curvature relationship is in good agreement with the experimental data.
Key words: Cyclic bending, external pressure, moment, curvature, ovalization, finite element ANSYS analysis.
1. Introduction
In many engineering applications, such as offshore pipelines, risers, platforms, land-based pipelines, and breeder reactor tubular components are acted upon both cyclic bending and external pressure. It is well known that the ovalization of the tube cross-section is observed when a circular tube is subjected to bending. If the loading history is cyclic bending, the ovalization increases in a ratcheting manner with the number of cycles. However, if the bending is combined with the external pressure, a small amount of external pressure will strongly influence the trend and magnitude of the ovalization. Therefore, the experimental and theoretical studies of the response of circular tubes under cyclic bending combined with external pressure are important for many industrial applications.
Since 1980, Kyriakides and co-workers [1] have conducted experimental and theoretical investigations
Corresponding author: Wen-Fung Pan, Ph.D., professor,
research fields: experimental stress analysis, finite element analysis and plasticity. E-mail: z7808034@email.ncku.edu.tw.
on the behavior of pipes subjected to bending with or without internal pressure or external pressure. Kyriakides and Shaw [1] performed an experimental investigation on the response and stability of thin-walled tubes subjected to cyclic bending. Corona and Kyriakides [2] investigated the asymmetric collapse modes of pipes under combined bending and external pressure. Kyriakides and Lee [3] experimentally and theoretically investigated the buckle propagation in confined steel tubes. Limam et al. [4] studied the inelastic bending and collapse of tubes in present of the bending and internal pressure. Limam et al. [5] investigated the collapse of dented tubes under combined bending and internal pressure.
Pan and his co-workers [6] also constructed a similar bending machine with a newly invented measurement apparatus, which was designed and set up by Pan et al. [6], to study various kinds of tubes under different cyclic bending conditions. Lee et al. [7] studied the influence of the Do/t (diameter/thickness)
ratio on the response and stability of circular tubes
DAVID PUBLISHING
subjected to cyclic bending. Chang and Pan [8] discussed the buckling life estimation of circular tubes subjected to cyclic bending. Lee et al. [9] investigated the viscoplastic response and collapse of sharp-notched circular tubes subjected to cyclic bending.
Corona and Kyriakides [10] experimentally investigated the response of 6061-T6 aluminum alloy tubes under cyclic bending and external pressure. In their study, the moment-curvature curves revealed a cyclic hardening for 6061-T6 aluminum alloy tube. The moment-curvature curve became steady after a few cycles. In addition, the moment-curvature response exhibits almost no influence by the external pressure. However, the ovalization-curvature behavior increases in a ratcheting symmetrical manner and is strongly influenced by the magnitude of the external pressure. Although Lee et al. [11] used endochronic theory combined with the principle of virtual work to properly simulate the aforementioned behavior, there are several flaws in their theoretical formulation. Firstly, the endochronic theory is too complicated and when it is combined with the principle of virtual work, the numerical method for determining the related parameters becomes extremely difficult. Next, their method treats the same response for every cross section for a circular tube under pure bending. However, based on the experimental data from Corona and Kyriakides [10], the moment and curvature are almost the same for every section, but the ovalization is different for each section. In addition, the response of the 6061-T6 aluminum alloy tube lacks of investigation.
Due to the great progress in computation speed and great improvement in the theory describing the elastoplastic response in finite element method in recent years, the accuracy of calculation by finite element method has become better [4-5, 12-13]. In this study, by considering adequate stress-strain relationships, mesh elements, boundary conditions and loading conditions, the finite element software ANSYS is used to analyze the response of circular
tubes subjected to cyclic bending with or without external pressure. Circular tube for 6061-T6 aluminum alloy is considered in this study. The experimental data tested by Corona and Kyriakides [10] are used to compare with the finite element ANSYS analysis. It has been shown that good agreement between the ANSYS analysis and experimental results has been achieved.
2. Finite Element ANSYS Analysis
In this study, the finite element software package ANSYS is used for analyzing the behavior of circular tubes subjected to cyclic bending with or without external pressure. The behavior is the relationships among the moment, curvature and ovalization. The elastoplastic stress-strain relationships, mesh element, boundary condition and loading condition of the finite element ANSYS are discussed in the following.
2.1 Elastoplastic Stress-Strain Relationship
According to the uniaxial stress-strain curves for 6061-T6 aluminum alloy tested by Corona and Kyriakides [10], the uniaxial stress ()-strain () curves are constructed in ANSYS as shown in Fig. 1. It can be seen that the curve is constructed by multilinear segments, the number on the curve indicates the order of the segment. In addition, the kinematic hardening rule is used as the hardening rule for cyclic loading.
2.2 Mesh Element
Due to the three-dimensional geometry and elastoplastic deformation of the tube, we use the SOLID 185 element for relative analysis. This element is a tetrahedral element built in ANSYS and is suitable for analyzing the plastic or large deformation. In particular, this element is adequate to analyze a shell component under bending. Due to the symmetry of the front and rear, right and left, only one fourth of the tube’s model was constructed. Fig. 2 is the mesh of the finite element ANSYS.
Fig. 1 Uniaxial stress ()-strain () curve for 6061-T6 aluminum alloy constructed by finite element ANSYS.
Fig. 2 Mesh constructed by ANSYS.
2.3 Boundary and Loading Conditions
Based on the coordinate system of Fig. 2, the pure bending is on the y-z plane. The points on the top and bottom of the tube are free to move in y-direction and
z-direction. But they can not move in x-direction. Fig.
3 shows the boundary condition of the finite element ANSYS. It can be seen that we use rollers on the top and bottom of the tube to represent the constraints.
In this study, the pure bending is controlled by curvature. The magnitude of the curvature cannot be directly input into ANSYS. Therefore, the corresponding displacements of the points (1, 2, …, N) on the center surface (neutral surface) are considered as the input data shown in Fig. 4. The points of the
Fig. 3 Boundary conditions constructed by ANSYS.
Fig. 4 Loading conditions of the finite element ANSYS.
undeformed center surface are indicated as 1, 2, …, N. Once the tube is subjected to pure bending, the points 1, 2, …, N move to points 1', 2', …, N', respectively. For pure bending, the curvature is:
L
1 (1) where, is the radius of curvature and L is the half of the original tube’s length. Since the loading is curvature-controlled, the magnitudes of , and L are known quantities. Thus, the magnitude of can be determined from Eq. (1). The vertical displacement of point 1 is: θ ρ ρ ' O ρ ' v 1 cos 11 (2) The horizontal displacement of point 1 equals zero. When we consider the displacement of point 2, the
Elements ANSYS OCT 10 2011 16:00:31 Model tube 2 Y X Z Elements ANSYS OCT 13 2011 09:00:18 Model tube 2 Y X Z
Table data ANSYS
OCT 1 2011 17:08:16 1 2 3 4 1112 13 14 15 0 0.04 0.08 0.12 0.16 0.20 500 400 300 200 100 0 ( MPa )
length 12 is a known quantity, the angle of 12 is determined to be: θ ρ O θ cos 12 tan 1 12 tan 1 1 12 (3)
The length O2 is found to be
2 2 2 2 cos 12 1 12 2 O ρ θ O (4) The length of 22' is determined as:2
22' ρO (5) The vertical and horizontal displacements of 22 ' are calculated to be:
12 12 22 22sin cos 22 22' ' θ , ' ' θ h v (6)
For the displacement of point N, the quantities of
1N, ON , NN are determined to be: '
ρ θ
, N ON , θ ρ N θ N 2 2 1 1 1 cos cos 1 tan ON ρ NN' (7) The vertical and horizontal displacements of NN'are calculated to be:
, cos 1N v NN' θ NN' N h NN' θ NN' sin 1 (8)
3. Comparison and Discussion
In this section, the behavior of 6061-T6 aluminum alloy circular tubes under cyclic bending with or without external pressure tested by Corona and Kyriakides [10] is compared with the finite element ANSYS analysis discussed in Section 2. In their experimental result, the magnitudes of the pressure, moment, and curvature are normalized by the following quantities [10]: 2 2 3 2 3 1 2 o l o o o o c D t t,κ D σ M , D t ν E P (9)
where, E is the elastic modulus, is the Poisson’s ratio, Do is the original outside diameter, t is the
wall-thickness, and o is the yield strength. For
6061-T6 aluminum alloy tube, the values of E, , Do, t
and o are 68.3 GPa, 0.33, 0.03091 m, 0.00089 m and
288 MPa, respectively [10].
3.1 Cyclic Bending without External Pressure
Fig. 5a presents the experimental result of cyclic moment (M/Mo)-curvature (κ/κl) curve for 6061-T6
aluminum alloy tube under curvature-controlled cyclic bending. The external pressure in this case is equal to zero. The Do/t ratio is 34.7 and the cyclic curvature
range is from +0.67 m-1 to -0.67 m-1. It is observed from the experimental M/Mo-κ/κl curve that the
6061-T6 aluminum alloy tube shows a steady loop on the first cycle. Fig. 5b shows the corresponding simulated result obtained from ANSYS analysis. It can be seen that there is not any cyclic hardening or
(a) Experiment [10]
(b) ANSYS analysis
Fig. 5 Experimental and ANSYS analysis moment (M/Mo)-curvature (κ/κl) curve for 6061-T6 aluminum alloy
tube. -0.8 → k/k 10.8 0.4 -1.2 P/Pc = 0 M/M0 1.2 Buckling 1.2 -1.2 M/M0 P/Pc = 0 → k/k10.8 0.4 -0.8
softening built in ANSYS, thus, only a loop of the
M/Mo-κ/κl curve represents all cyclic bending
responses. Fig. 6a depicts the corresponding experimental ovalization of tube cross-section (ΔD/Do) as a function of the applied curvature (κ/κl)
for Fig. 5a where ΔD is the change in outside diameter. It can be noted that the ovalization of tube cross-section increases in a symmetrical ratcheting manner with the number of cycles. As the cyclic process continues, the ovalization keeps accumulating. Fig. 6b is the corresponding simulated result of ΔD/Do-κ/κl curve.
3.2 Cyclic Bending with External Pressure
Fig. 7a presents the experimental result of cyclic
(a) Experiment [10]
(b) ANSYS analysis
Fig. 6 Experimental and ANSYS analysis ovalization (ΔD/Do)-curvature (κ/κl) curve for 6061-T6 aluminum alloy
tube.
moment (M/Mo)-curvature (κ/κl) curve for 6061-T6
aluminum alloy tube under cyclic bending with a constant external pressure Pc of 1.47 MPa. The cyclic
curvature range is from +0.43 m-1 to -0.43 m-1. Fig. 7b demonstrates the corresponding ANSYS analysis result. In their experimental study [10], the length of the tube was around 24Do. They measured the
ovalization at the position of 11Do indicated as point
A and 18Do indicated as point B from the right
(Fig. 8a). They discovered that the ovalization at point A (shown in Fig. 8a) increases slower than that at point B (shown in Fig. 9a). Figs. 8b and 9b show the corresponding simulation result of ΔD/Do-κ/κl curve at
point A and B, respectively.
(a) Experiment [10]
(b) ANSYS analysis
Fig. 7 The experimental result of cyclic moment (M/Mo)-curvature (κ/κl) curve for 6061-T6 aluminum alloy
tube. ΔD/D0 -0.8 -0.4 0 0.4 0.8→ k/k 1 0.06 0.03 0.06 ΔD/D0 -0.8 -0.4 0 0.4 0.8 → k/k1 0.03 → k/k1 P/Pc = 0.4 M/M0 P/Pc = 0.4 → k/k1 M/M0
(a) Experiment [10]
(b) ANSYS analysis
Fig. 8 Experimental and ANSYS analysis ovalization (ΔD/Do)-curvature (κ/κl) curve at point A for 6061-T6
aluminum alloy tube.
4. Conclusions
In this study, the finite element ANSYS with adequate stress-strain relationship, mesh elements, boundary conditions and loading conditions was used to simulate the response of circular tubes subjected cyclic bending with or without external pressure. The experimental data of 6061-T6 aluminum alloy tubes tested by Corona and Kyriakides [10] were used for comparison with the ANSYS analysis. It can be seen that the elastoplatic cyclic loops for moment-curvature
(a) Experiment [10]
(b) ANSYS analysis
Fig. 9 Experimental and ANSYS analysis ovalization (ΔD/Do)-curvature (κ/κl) curve at point B for 6061-T6
aluminum alloy tube.
relationship and the symmetrical, ratcheting and increasing ovalization-curvature relationship were properly simulated in Figs. 5b-8b, respectively. In addition, the ovalization at different position can also be well simulated in Fig. 9b.
Acknowledgments
The work presented was carried out with the support of the National Science Council under grant NSC 100-2221-E-006-081. Its support is gratefully acknowledged.
References
[1] S. Kyriakides, P.K. Shaw, Inelastic buckling of tubes under cyclic loads, ASME Journal Pressure Vessels and Technology 109 (1987) 169-178.
[2] E. Corona, S. Kyriakides, Asymmetric collapse modes of pipes under combined bending and external pressure, Journal of Engineering Materials and Technology 126 (12) (2000) 1232-1239.
[3] S. Kyriakides, L.H. Lee, Buckle propagation in confined steel tubes, International Journal of Mechanical Science 47 (2005) 603-620.
[4] A. Limam, L.H. Lee, E. Corana, S. Kyriakides, Inelastic wrinkling and collapse of tubes under combined bending and internal pressure, International Journal of Mechanical Sciences 52 (6) (2010) 37-47.
[5] A. Limam, L.H. Lee, S. Kyriakides, On the collapse of dented tubes under combined bending and internal pressure, International Journal of Solids and Structures 55 (2012) 1-12.
[6] W.F. Pan, T.R. Wang, C.M. Hsu, A curvature-ovalization measurement apparatus for circular tubes under cyclic bending, Experimental Mechanics 38 (2) (1998) 99-102. [7] K.L. Lee, W.F. Pan, J.N. Kuo, The influence of the
diameter-to-thickness ratio on the stability of circular
tubes under cyclic bending, International Journal of Solids and Structures 38 (2001) 2401-2413.
[8] K.H. Chang, W.F. Pan, Buckling life estimation of circular tubes under cyclic bending, International Journal of Solids and Structures 46 (2009) 254-270.
[9] K.L. Lee, C.M. Hsu, W.F. Pan, Viscoplastic collapse of sharp-notched circular tubes under cyclic bending, Acta Mech. Solida Sinica 26 (6) (2013) 629- 641.
[10] E. Corona, S. Kyriakides, An experimental investigation degradation and buckling of circular tubes under cyclic bending and external pressure, Thin-Walled Structures 12 (1991) 229-263.
[11] K.L. Lee, C.M. Hsu, C.Y. Hung, Endochronic simulation for the response of 1020 steel tube under symmetric and unsymmetric cyclic bending with or without external pressure, Steel Composite Structures 8 (2) (2008) 99-114.
[12] Y.P. Korkolis, S. Kyriakides, Inflation and burst of anisotropic aluminum tubes for hydroforming applications, International of Plasticity 24 (2008) 509-543.
[13] K.H. Chang, K.L. Lee, W.F. Pan, Buckling failure of 310 stainless steel with different diameter-to-thickness ratios under cyclic bending, Steel and Composite Structures, 10 (3) (2010) 245-260.
Journal of Civil Engineering and Architecture, ISSN 1934-7359, USA
Cold In-Place Recycling as a Sustainable Pavement
Practice
Kang-Won Wayne Lee, Max Mueller and Ajay Singh
Department of Civil and Environmental Engineering, University of Rhode Island, Kingston 02881, USA
Abstract: Pavement rehabilitation and reconstruction methods with CIR (cold in-place recycling) are alternatives that can effectively
reduce the high stresses and waste produced by conventional pavement strategies. An attempt was made to predict the performance, particularly low-temperature cracking resistance characteristics of CIR mixtures. These were prepared with the mix design procedure developed at the URI (University of Rhode Island) for the FHWA (Federal Highway Administration) to reduce wide variations in the application of CIR mixtures production. This standard was applied to RAP (reclaimed asphalt pavement) to produce CIR mixtures with CSS-1h asphalt emulsion as the additive. By adjusting the number of gyrations of the SGC (superpave gyratory compactor) for compaction, the field density of 130 pcf was represented accurately. To secure a base line, HMA (hot mix asphalt) samples were produced according to the superpave volumetric mix design procedure. The specimens were tested using the IDT (indirect tensile) tester according to the procedure of AASHTO T 322 procedure at temperatures of -20, -10 and 0 oC (-4, 14, and 32 oF, respectively). The obtained results for the creep compliance and tensile strength were used as input data for the MEPDG (mechanistic empirical pavement design guide). The analysis results indicated that no thermal or low-temperature cracking is expected over the entire analysis period of 20 years for both HMA and CIR mixtures. Thus, it appears that CIR is a sustainable rehabilitation technique which is also suitable for colder climates, and it is recommended to conduct further investigation of load-related distresses such as rutting and fatigue cracking.
Key words: Cold in-place recycling, sustainable pavement, asphalt pavement, pavement rehabilitation and reconstruction, superpave
gyratory compactor, indirect tensile test.
1. Introduction
Roadways are exposed to various loadings and stresses that reduce their serviceability like other infrastructures. Traffic as well as environmental stresses wear out pavement structures. Despite their consideration in the design and construction process, distresses can usually be expected to show in the pavement surfaces. The most efficient means to deal with these distresses and wearing appears to be to rehabilitate the pavement at a point where its condition can be improved with a reasonable amount of resources. This could be an adequate maintenance practice in order to avoid expensive reconstruction, and it needs to be planned throughout the expected pavement service period.
Corresponding author: Kang-Won Wayne Lee, Ph.D.,
professor, research fields: pavement and transportation engineering. E-mail: leew@egr.uri.edu.
Whenever rehabilitation or reconstruction measures are not avoidable, procedures to rebuild parts of the pavement structure are necessary. Layers of the roadway are milled up to a determined depth, which can include the surface or even the base course. Past and current practices often pursue the procedure of replacing the milled materials with virgin materials [1]. This requires great efforts in terms of purchasing and transporting new material which consumes time, energy and money [2]. Furthermore, the old material becomes waste, harming the environment and incurring further costs tied to disposal.
A method of reducing all these issues by considerable amounts is in-place recycling. This procedure allows the user to re-use materials that are already in the pavement. This process includes milling, screening and crushing of the broken pavement materials. Additives such as emulsified asphalt or fly ash are then incorporated [3]. This mixture is put back
DAVID PUBLISHING
in place and compacted. Finally, a protective overlay is placed above the recycled layer of asphalt concrete, which is typically HMA (hot mix asphalt) [4]. Therefore, multiple advantages arise from the lack of need for heating and for extensive transportation of the materials used and are as follows [5]:
less trucking;
conservation of materials, energy and time; preservation of the environment;
cost reduction.
These advantages pose major incentives to promote and support in-place recycling and allow the roadway rebuilding procedure to be conducted in a sustainable way [6].
In-place recycling can be performed at different temperature levels. Cold recycling typically uses materials at ambient temperatures. Examples show that temperatures are at around 25 oC (77 oF). The absence of the necessity to heat up the material considered to be major advantages which are listed above. Furthermore, pollution in the form of smoke, heat and noise is reduced. Thus, in-place recycling is an approach for green highways and streets. Less time is needed for cooling off, therefore allowing sooner openings for traffic.
What are still needed for a wide-spread application of this technique are standardized regulations for procedures, testing, and quality control [7]. Based on a mix design procedure developed under the leadership of the URI (University of Rhode Island), the present study deals with the prediction of performance of pavements with CIR (cold in-place recycling), particularly, low-temperature cracking resistance characteristics [8]. In order to be able to fairly evaluate the outcomes of the predictions and obtain comparable results, the predictions for the pavement structures involving recycled materials were compared to a pavement structure with virgin materials, in this case HMA, with the same boundary conditions. Even with varying thicknesses of different layers in the pavement structure, exposure to the same environmental
conditions ensures a fair comparison.
Standardized regulations for procedures, testing, and quality control are still needed for a wide-spread application of this technique. Based on the URI mix design procedure, the present study deals with the prediction of performance of pavements with CIR, particularly, low-temperature cracking resistance characteristics. In order to fairly evaluate the predictions, the pavement structures with CIR materials were compared to the ones with virgin materials, or HMA, with the same boundary conditions.
2. Current Status of Knowledge
The literature review comprised many fields of pavement engineering, starting from the specimen preparation, i.e., basic material handling, all the way to software-based predictions on the basis of analyzed test data [9]. This chapter will focus on the used emulsion, theoretical background of the conducted testing and the prediction tool.
2.1 Asphalt Emulsions
In general, “emulsified asphalt is simply a suspension of small asphalt cement globules in water, which is assisted by an emulsifying agent” [3]. As liquid asphalt is based on oil and does not dissolve in water, a chemical agent is needed to disperse the liquid asphalt in water. It forms droplets with a diameter ranging from 1 μm to 10 μm [10].
CSS-1h emulsions are usually a good choice for CIR projects. The slow setting rate is suitable for this type of road construction. The number refers to the emulsion’s viscosity. In this case, the emulsion has a lower viscosity than a “2”. The “h” designates the use of harder base asphalt, which is usually the case.
2.2 Indirect Tensile Testing
When conducting the IDT (indirect tension) test, a cylindrical specimen with a diameter of 150 mm (6 in) and a thickness of 38-50 mm (1.5-2 in) is exposed to a
single load imposed perpendicularly to the longitudinal axis with a static support on the opposite side. Fig. 1 shows a front view of the specimen during the test.
It was found that the IDT test is able to represent the most critical location of a pavement under a wheel load. Roque and Buttlar [11] stated that, “the critical location for load-induced cracking is generally considered to be at the bottom of the asphalt concrete layer and immediately underneath the load, where the stress state is longitudinal and transverse tension combined with vertical compression. The stress state in the vicinity of the center of the face of an indirect tension specimen is very similar to this stress state, except that tension is induced in one rather than two axes”.
According to Roque and Buttlar [11], the tensile stress along the vertical y-axis in the horizontal direction is constant, which also reflects the line along which failure can be expected once the tensile stress exceeds the tensile strength (Fig. 1).
The IDT test is conducted according to the AASHTO T 322 procedure [12]. Its purpose is to determine the creep compliance D(t) as well as the tensile strength St at low temperatures. Creep
compliance is defined as “the time-dependent strain divided by the applied stress” [12] and therefore has the unit of the reciprocal of stress. A constant load is to be applied on the specimen for a duration of 100 (MEPDG (mechanistic empirical pavement design guide) input values) or 1,000 s (complete analysis). Not only does superpave mixture analysis specify the temperatures of -20, -10 and 0 oC (-4, 14 and 32 °F, respectively), but also the input options for MEPDG are at these temperatures. In order to allow the specimen to cool down to the test temperature and establish an appropriate temperature distribution throughout the material, the sample has to remain inside the climate chamber at the test temperature for 2 1 h prior to testing.
During creep compliance testing, the deformations near the center of the specimen are recorded. The tensile strength test is to be performed immediately
after the creep compliance test. Now the loading ram movement is required to be constant with a speed of 12.5 mm/min until the load sustained by the specimen decreases. This is regarded to as failure and the maximum load therefore is the failure load.
2.3 AASHTO Pavement M-E Guide
The MEPDG, subsequently AASHTO Pavement M-E Guide was developed based on results of the LTPP (long-term pavement performance) program. The LTPP program started a comprehensive experiment about pavements in service by monitoring more than 2,400 asphalt and Portland cement concrete roadways across the United States and Canada. The data obtained help to develop the algorithms for the new performance prediction software. With the weather history known about the location where the future pavement is to be constructed, the pavement structure can be entered into the program. Then, the program output is a prediction of the serviceability of the roadway that can be expected under the given boundary conditions. MEPDG combines a variety of sub-programs that each treat different distresses such as rutting, fatigue cracking and thermal cracking.
TC MODEL is the program which analyzes the stresses due to low temperatures and is able to quantify thethermaldistresses. Itshouldbe noted at this point
Fig. 1 IDT specimen and gauge location to determine creep compliance and tensile strength.
that “TC MODEL does not consider traffic effects” [13]. This program is very user-friendly, as it offers a convenient way to enter the data input. It simplifies the problem by using linear elastic fracture mechanics in a one-dimensional stress evaluation model. Newer software aims to treat this problem with nonlinear finite element analysis engines. This allows for better reliability of the predictions due to a more accurate mathematical representation of the problem. This software is still under development for the full-scale deployment [14].
3. Asphalt Pavement Materials
The primary objective of this study was the evaluation of the performance of a CIR material for rehabilitation or reconstruction projects. A base line was established with HMA first.
3.1 HMA Specimens
HMA represents the current practice of road construction, and consists of mineral aggregates and asphalt binder. Specimens with four different binder contents from 5.5% to 7.0% with increments of 0.5% were tested, and the OBC (optimum binder content) was determined at the in-service air void content of 4.0%.
A loose (uncompacted) sample with a mass of approximately 1,000 g (2.2 lbs) was used to determine the theoretic maximum specific gravity according to the procedure of AASHTO T 209 [12]. Specimens with different binder contents were compacted with the SGC (superpave gyratory compactor) maximum number of gyrations, i.e., 175. It should be noted that the final compaction level is important for calculation purposes only, but not for testing. 175 gyrations would compact the specimens to a point where they would be denser than in the field and would not represent field conditions accurately, since the number of gyrations for design purposes would be 100 according to the procedure of AASHTO R 35 [12]. The obtained test results were only used for back-calculating purposes
and not for performance testing.
The compacted specimens were then tested for their bulk SG (specific gravity) (Gmb) and water absorption
according to the procedure of AASHTO T 166 [12]. The bulk SG after every gyration can be estimated because the specimen’s mass is known and the gyratory compactor yields the height of the specimen after every gyration in the compaction mold of known dimensions. By dividing the mass by the calculated volume and the density of water at 4.0 oC (0.999972 g/cm3), the estimated bulk SG (Gsb,est) can be computed. A
correction factor C is introduced to obtain the corrected bulk SG (Gsb,corr). It is determined and applied to every
gyration according to Eqs. (1) and (2) [15].
N
gyrations
G
G
C
est mb measured mb175
, ,
(1)C
G
G
mb,corr
mb,measured
(2) By dividing the corrected bulk SG by the theoretical maximum SG, the compaction level as a percentage of the maximum theoretical SG is computed. This calculation was done for duplicate specimens at four binder contents. Then, the binder content is plotted against the averaged air void contents. The results are shown in Fig. 2.Finally, the OBC at an air void content of 4.0% was determined graphically and numerically to be 5.8%. Therefore, the specimens for the planned indirect tensile testing were produced with this OBC. Also, compaction was accomplished with 100 designs instead of 175 maximum gyrations.
3.2 CIR Mixtures
RAP (reclaimed asphalt pavement) was acquired from a construction site of Rhode Island Route 3. Unfortunately, the material was stored uncovered for an unknown amount of time, and the influence of aging, oxidation and freezing, especially on the binder, may have been significant. However, since another source was not available, the RAP was used despite concerns
Fig. 2 Averaged air voids over binder conetent.
over different properties from fresh one.
In this study, CSS-1h emulsion was used. According to the CIR mix design procedure which was developed by a URI research team [8], the optimum emulsion and water content needed to be determined. The process was carried out by first keeping the water content constant and varying the emulsion content. For the determination of the optimum content, the unit weight is the parameter to be compared to field conditions. Either the maximum value or, if a maximum cannot be determined, the best representation of field condition should be chosen. Before any specimen can be produced, the appropriate number of gyrations for compaction needs to be determined. The URI procedure states that, “The load shall be applied for the number of gyrations that will result in achieving densities similar to those found in the field.” Therefore, a method was used that is somewhat similar to the determination of the amount of air voids for HMA materials [8]. It is based on representing field density, and the value of previous URI study, i.e., 130 pcf was used [16]. Following steps were used in this study:
determine the mass of the sample (aggregate + water + emulsion);
compact with 175 gyrations (like HMA) [7]; calculate estimated bulk SG after every gyration;
measure bulk SG after 175 gyrations (experiment);
correction factor C = (measured bulk SG after 175 gyrations)/(estimated bulk SG after 175 gyrations);
multiply bulk SG after every gyration by C to obtain corrected bulk SG;
find field density;
divide corrected bulk SG by field density; look for 100.0%.
The test specimen for this procedure was made with a water content of 3.0% and an emulsion content of 1.0%. Results showed that 116 gyrations are adequate for field density reproduction.
For any set of emulsion and water contents, 9,000 g of RAP were used. This was because duplicate specimens for bulk SG determination with about 4,000 g each were needed along with one sample for theoretical maximum SG determination (approx. 1,000 g). To ensure sufficient mass, 9,000 g for the RAP was chosen because emulsion and water still had to be added, which lead to a mass of more than 9,200 g before curing [5]. For the determination of the OEC, emulsion contents varied from 0.5% (of total mix mass) to 2.0% with increments of 0.5%, while the water content stayed constant at 3.0%.
After production, specimens were put in an oven at a
y = ‐0.449x + 0.066
R² = 0.670
0.0%
1.0%
2.0%
3.0%
4.0%
5.0%
5.0%
5.5%
6.0%
6.5%
7.0%
7.5%
Air
vo
id
s
Binder content
Air Voids over binder content
temperature of 60 oC (140 oF) for a period of 24 h for curing. This time was needed for the water to leave the specimen [8].
While the bulk SG specimens were being cured, the theoretical maximum SG of uncompacted specimens was determined. This was conducted according to the procedure of AASHTO T 209 [12]. After curing, bulk SG testing was performed, again according to the procedure of AASHTO T 166 [12]. Fig. 3 shows the unit weight with respect to emulsion content. The R2 error is in reference to a parabolic regression curve computed by the spreadsheet program.
In one aspect, the regression fits the data points very well which is indicated by the R2 value above 0.99 in both cases. However, the behavior of the curve was somewhat different than expected since it indicated that a higher unit weight was achieved using less emulsion. A similar behavior was observed [8] and a solution corresponding to the applied mix design procedure was applied.
Due to the highly variable nature of RAP materials and their mixture with emulsion and water, the relationship between unit weight and emulsion content, as described earlier, occasionally does not hold true for CIR mixtures. Such a case occurred with the Kansas mixture. The highest unit weight was achieved at the lowest emulsion content of 0.5%. However, 0.5%
emulsion does not supply enough asphalt to properly coat the RAP particles. Under such conditions, the OEC should be selected at the emulsion content that produces the same unit weight as found in the field.
In this study, the same option was chosen. Due to the close fit of the regression curve, it could be used to numerically determine at which emulsion content a unit weight of 130 pcf was achieved. Thus, the optimum emulsion content was determined to be 0.7%.
With the optimized emulsion content, the next step was to determine the OWC (optimum water content). This was very similar to the previous step with the exception that the emulsion content was kept constant at the optimum level while the water content was varied. Again, four sets of specimens were produced with 116 gyrations. However, the water contents were varied from 2.0% to 3.5%. The results are shown in Fig. 4.
While the behavior was expected to be less erratic, one maximum point could be identified easily to determine the optimum water content to be 3.0%.
4. IDT (Indirect Tensile) Testing
4.1 Specimen PreparationsA testing machine, Instron® 5582 was available in the RITRC (Rhode Island Transportation Research Center) laboratory at URI. An attempt was made to
Fig. 3 Determination of OEC at 3.0% water content.
y = 14,001X2‐ 615.65x + 133.55 R² = 0.9914 127 127 128 128 129 129 130 130 131 131 132 0.0% 1.0% 2.0% Unit weight (pcf) Emulsion content
Fig. 4 Determination of OWC at 0.7% emulsion content.
calibrate the machine. A malfunction was found in data acquisition system. Suitable new parts that would work with the machine were identified, but unfortunately the delivery and complete installation of the new software was too late for this project to take effect. Therefore, another way of testing needed to be found. Fortunately, the UConn (University of Connecticut) provided the required testing system for this project.
The superpave cylindrical samples have a height of about 110 mm (4.3 in), thus two IDT specimens with the required height could be produced. Due to the quality of the saw, a high level of accuracy could be maintained. In total, eight different specimens for each material were produced with thicknesses in the range of 41 mm to 44 mm. These met the requirement of the procedure of T 322, which are 38-50 mm [12]. It was observed that the different behavior of the materials could be seen even during specimen preparation. The fine materials of the recycled samples were less strongly integrated into the material and therefore chipping was increased during sawing. In order to still obtain usable specimens, care had to be taken to saw the specimens fast enough to minimize wobbling of the blade and at the same time slow enough not to rip out particles instead of cutting through them.
At least one day was required after sawing as the specimens had to be dried. Subsequently, metal mounting buttons were glued onto the specimens. For
testing, strain gauges were attached to them magnetically to detect the horizontal and vertical deflection of the sample in the center of the specimen. After gluing the buttons to the specimens, they were ready for testing.
4.2 IDT Testing Content
Testing had to be conducted at different temperatures. To ensure an appropriate temperature distribution over the entire cross-section of the specimens, keeping the specimens at test temperatures for 3 1 h before testing was mandatory. The entire testing procedure was conducted according to the procedure of AASHTO T 322 [12].
While the load was kept at a constant magnitude, the deflections were measured for both faces of the specimen. This is intended to reduce influences on the obtained measurements due to material in homogeneities by allowing the user to average them. After this testing phase, the load was removed. Although the specimen was not destroyed, it exhibited permanent deformation. However, it can still be used for the tensile strength test, as can be seen in the standard test method [12]. In this test, the loading ram had to maintain a constant movement of 12.5 mm/min (0.5 in/min), while only the imposed load needed to be measured. The deflections did not matter at this time. Since this test destroys the specimen, the strain gauges were removed to prevent damage that might have occurred due to the specimen’s collapse.
The ram movement must be maintained until the load sustained by the specimen starts to decrease. This is regarded as failure, and the maximum load was used. When testing materials at different temperatures, it was observed that the temperature had a significant influence on the behavior. The lower the temperature, the more brittle failure occurred. While the material allowed some ductile deformation before completely falling apart at freezing point. At -20 oC (-4 oF) there was mainly one sudden, loud crack, and the specimen collapsed.
R² = 0.350
123
124
125
126
127
128
1.5%
2.5%
3.5%
Unit
we
ig
ht
(pcf
)
Water content
4.3 Data Analysis
4.3.1 Creep Compliance, D(t)
The horizontal and vertical deformations at the analyzed temperature were averaged and normalized in order to compare them. This was accomplished using Eqs. (3) and (4) [12]. n avg avg n avg n t i t i n P P D D b b X X ,, , (3) n avg avg n avg n t i t i n P P D D b b Y Y ,, , (4) where,
ΔXn,i,t—normalized horizontal deformation of
specimen n for face i at time t (mm);
ΔYn,i,t—normalized vertical deformation of
specimen n for face i at time t (mm);
ΔXi,t—measured horizontal deformation of
specimen n for face i at time t (mm);
ΔYi,t—measured vertical deformation of specimen n
for face i at time t (mm);
bn, Dn, Pn—thickness, diameter, creep load of
specimen n;
bavg, Davg, Pavg—average thickness, diameter, creep
load of all replicate specimens at this temperature. Since all specimens have a diameter of 150.0 mm,
Dn/Davg is 1. In the test method, ΔX and ΔY are treated
as arrays. In this study, this is achieved by calculating single values in a table in the spreadsheet software. After executing these equations, normalized deformations are obtained that enable the user to directly compare the deflections of all three specimens to one another.
If the average was determined with all six curves or arrays, the accuracy would decrease due to these two curves that deviate from the mean value significantly. As an approach to this problem, the trimmed mean is used. A percentage of all measurements is chosen to be “cut off” or trimmed from the top and bottom of the numerically ranked array before calculating the arithmetic mean.
The average horizontal and vertical deformations for
every face are needed in order to determine the ratio of the horizontal to vertical deformations X/Y, Poisson’s ratio ν, and a coefficient, Ccmpl, needed for the
calculation of the creep compliance. The average deformations occur after half the total creep time and are obtained using Eqs. (5) and (6) from the procedure of AASHTO T 322 [12]. mid t i n i a
X
X
,
,,
(5) where,ΔXa,I—average horizontal deformation for face i;
ΔXn,i,t—normalized horizontal deformation at a time
corresponding to half the total creep test time for face i, here t = 500 s.
The vertical deformations were obtained by applying the same calculations to the ΔY values. Then, the trimmed mean of the deflections ΔXt and ΔYt needed to
be obtained. For this, the six ΔXa,i and ΔYa,i values were
ranked numerically and the highest and lowest values were disregarded. The average of the middle four values was determined, according to Eq. (6).
4
5 2 ,
j j r tX
X
(6) where,ΔXt—trimmed mean of horizontal deformations;
ΔXr,j ΔXa,i—values in ascending order.
The ratio of the horizontal to vertical deformations
X/Y was computed according to Eq. (7). t t
Y
X
Y
X
(7) Consequently, Ccmpl and ν were determined usingEqs. (8) and (10), respectively.
332
.
0
6354
.
0
1
Y
X
C
cmpl (8) while Eq. (9) must be true. cmpl avg avg C D b 213 . 0 704 . 0 avg avg D b 195 . 0 566 . 1 (9)
2 2 2 778 . 0 480 . 1 10 . 0 Y X D b Y X avg avg (10)
It may be noted that Poisson’s ratio ν should always be between 0.05 and 0.50 [12]. The calculations were carried out in a spreadsheet program (Microsoft Excel ©). They were performed for all temperatures for both mixtures.
Based on the trimmed mean of the deflections (deflection arrays) ΔXtm,t with respect to variable time t
following the same numerical ranking for the average deformations in Eq. (6), the creep compliance D(t) can finally be computed using Eq. (11).
cmpl avg avg avg t tm C GL P b D X t D , (11) where,D(t)—creep compliance (1/TPa);
GL—gauge length (0.038 for 150 mm specimen).
This formula allows the computation of the creep compliance for any time recorded, in the present study every half-second. The simulation program, MEPDG, requires the creep compliance only at certain time points. For greater precision of the requested data points ΔXtm,t, the results were averaged over the
surrounding 5 time points.
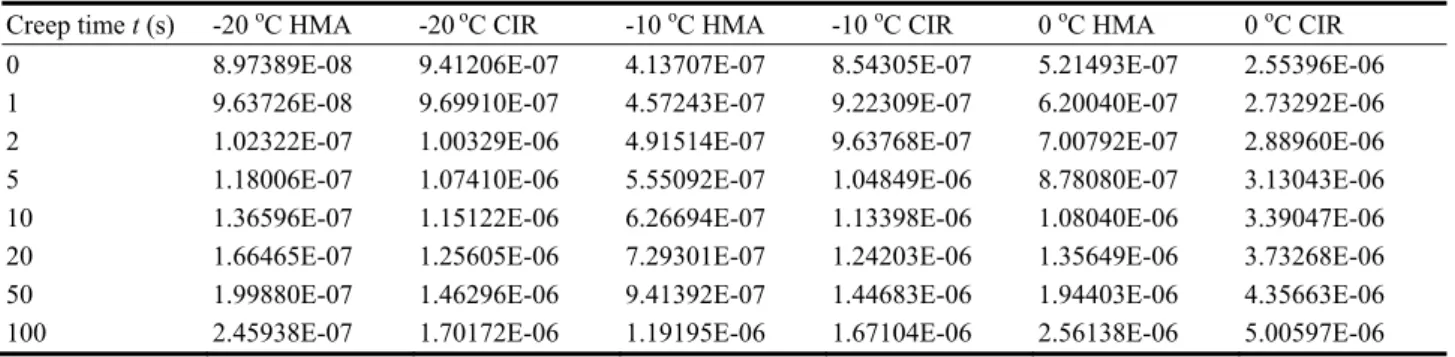
In summary, Table 1 was prepared as input material parameters for MEPDG analysis. As expected, CIR mixture has a higher compliance than HMA, because the former has lower modulus than the latter.
4.3.2 Tensile Strength (St)
The creep testing is not a destructive test, however, permanent deformation is exhibited due to the
viscoelastic reaction to a permanent load. The tensile strength test damages the specimen entirely which is why this test must, of course, be performed after the creep compliance test. AASHTO procedure T 322 schedules the strength test immediately after the creep compliance test but allows an unloading phase in between [12]. In the present study, this was necessary to remove the strain gauges to prevent damage to them as a result of specimen collapse.
The specimen is aligned in the same way as for the compliance test, but this time the loading piston is to move at a constant speed of 12.5 mm/min. During testing only the sustained load is measured until a decrease is detected. This may or may not come along with a brittle collapse of the sample, but the maximum load is interpreted as the failure load and is used to determine the tensile strength. When the failure load is known, Eq. (12) allows computation of the tensile strength [12]. n n n f n t
D
b
P
S
, ,2
(12) where,St,n—tensile strength of specimen n (GPa);
Pf,n—failure load of specimen n.
Although the tensile strengths were obtained for all temperatures, only the results at -10 oC (14 oF) are significant for the program. While HMA mixtures collapsed at an average stress of 858 psi, CIR specimens failed at an average stress of 97 psi, which means a reduction of almost 90%. However, strength of 97 psi is strong enough as base materials.
Table 1 Creep compliance of both mixtures with respect to creep time t.
Creep time t (s) -20 oC HMA -20 oC CIR -10 oC HMA -10 oC CIR 0 oC HMA 0 oC CIR
0 8.97389E-08 9.41206E-07 4.13707E-07 8.54305E-07 5.21493E-07 2.55396E-06 1 9.63726E-08 9.69910E-07 4.57243E-07 9.22309E-07 6.20040E-07 2.73292E-06 2 1.02322E-07 1.00329E-06 4.91514E-07 9.63768E-07 7.00792E-07 2.88960E-06 5 1.18006E-07 1.07410E-06 5.55092E-07 1.04849E-06 8.78080E-07 3.13043E-06 10 1.36596E-07 1.15122E-06 6.26694E-07 1.13398E-06 1.08040E-06 3.39047E-06 20 1.66465E-07 1.25605E-06 7.29301E-07 1.24203E-06 1.35649E-06 3.73268E-06 50 1.99880E-07 1.46296E-06 9.41392E-07 1.44683E-06 1.94403E-06 4.35663E-06 100 2.45938E-07 1.70172E-06 1.19195E-06 1.67104E-06 2.56138E-06 5.00597E-06
5. Performance Prediction of Both Mixtures
The final step of performance prediction would be using the obtained data for a fictional project to evaluate the performance of the CIR mixture comparatively. It includes the input to the model and program for the selected boundary conditions of the site. Consequently, the outputs of the program would include resistance to low temperatures cracking and would be interpreted to formulate recommendations.
5.1 Input for TCMODEL and MEPDG
The MEPDG software offers a user-friendly input framework, characterized by a checklist layout. Each bullet point allows the adjustment of parameters for general information, traffic, climate and pavement structure.
For this project a “minor arterial rural highway” was selected: Rhode Island Route 2 leads from South Kingstown to North Kingstown [17]. A section of the road in the southern part of the State was chosen since from that area a report offers a variety of data for traffic and subgrade soil information. The study was conducted by a URI research team for the RIDOT (Rhode Island Department of Transportation).
In terms of the traffic amounts and distributions, it may be noted that thermal cracking is not load-related and does not depend on the amount of vehicles for this project. However, the programs require a completed set of information for any project, so the traffic amount of 1,346 AADTT (annual average daily truck traffic) was entered [17].
The climate plays a very important role for this distress. In MEPDG, the climate files are created based on the history that is known for weather stations in the vicinity of the project site. There are three stations in the State of Rhode Island: Westerly, Newport and Providence. Newport, RI, is located on an island, and is also rather far away from the planned location. In addition, climate data from stations in neighboring States were available and were used for improved
accuracy.
Next to the weather data, the location for which the data are to be interpolated needs to be entered. As shown, a position was chosen in the southern part of the State, its coordinates are N 41.52o, E 71.55o. The elevation is approximately 220 ft; both information were found using “Google Earth”. The depth of water table was entered as 10 ft [18].
Next, the pavement structure needs to be given to the software. The bottom layer is subgrade soil classified by AASHTO standards as A-1-b, i.e., that a maximum of 50 and 25% of the aggregate would pass the No. 40 and No. 200 sieves, respectively [19]. The resilient modulus was 14,300 psi [17]. It is semi-infinite while the above layers are assigned finite thicknesses. The layer above the subgrade is granular subbase with a thickness of 12 in, as it is common in Rhode Island for a fill or embankment section. In the case of cut or excavation section, 18 in would be appropriate.
The base and surface courses need to be provided in the prediction software. This is the point where MEPDG, unfortunately, limits the possibilities to enter a pavement that would accurately reflect the way CIR is supposed to be used in reality. After application of CIR and curing, protection is required for “the surface of the CIR-treated material by either a surface wearing course, such as a seal or HMA overlay” [20]. Therefore, CIR would most likely be applied in combination with HMA. However, the program allows entering of only one set of creep compliance and strength test data for all bituminous layers of the entire setup, which prevents pavement structures that comprise layers of both HMA and CIR. So for comparison reasons, basically the two bituminous layers are entered with the creep compliance and tensile strength results from HMA in one case and from CIR in the other case. As it is practice in Rhode Island for deep strength pavements, the base and surface courses have thicknesses of 5 in and 2 in, respectively. In addition, a third setup was simulated with a base course thickness of only 2 in.
This, of course, must never be used in reality. However, it is intended to reveal how a very thin course of CIR mixture would perform in terms of thermal cracking.
5.2 Prediction Results and Interpretation
After simulating all three different cases, summaries of distresses revealed that none of the cases are expected to exhibit any distresses over the entire analysis period of 20 years. Not even the third case, where the pavement is by far too thin, showed any distresses. As an example, the output for the distresses of the pavement including CIR mixtures with a base course thickness of 5 in is shown in Table 2.
This is a rather unexpected result. Especially because of the observations about the bonding forces between the smaller particles of the material which appeared weaker than the HMA, apparently this property does not affect the distress of thermal cracking. It can be expected to affect the performance for a variety of load-related distresses such as longitudinal
or alligator cracking; however, this was not within the scope of this project but is rather recommended to be analyzed in future research.
The question of the performance cannot be answered entirely with the result that neither material will crack at the simulated weather conditions. Still, the result that CIR material performs very well in a climate found in the south of Rhode Island is more than desirable and supports this approach towards a more sustainable reconstruction practice immensely.
How can a CIR mixture with a tensile strength of less than 12% of HMA’s strength perform just as well? Apparently, not only the tensile strength, but the material’s behavior before failure plays a significant role for cracking. This distress is not load-, but temperature-related. The stresses do not arise from imposed loads that need to be sustained, but rather from shrinkage. As mentioned earlier, the creep compliance is a measure of strain over stress. The creep compliances over time in Table 1 reveal for both
Table 2 Simulation output.
Pavement age
Month Longitudinal cracking CIR (ft/mi) Longitudinal cracking HMA (ft/mi) Alligator cracking CIR (%) Alligator cracking HMA (%) Transverse cracking CIR (ft/mi) Transverse cracking HMA (ft/mi) Mo yr 1 0.08 August 85 0.04 0.31 0.0011 0 0 12 1.00 July 1,600 0.39 2.38 0.0067 0 0 24 2.00 July 3,520 1.19 4.90 0.0147 0 0 36 3.00 July 4,740 1.88 6.95 0.0211 0 0 48 4.00 July 5,800 2.77 9.07 0.0279 0 0 60 5.00 July 6,490 3.75 11.00 0.0349 0 0 72 6.00 July 7,150 4.84 13.00 0.0421 0 0 84 7.00 July 7,670 5.98 15.00 0.0493 0 0 96 8.00 July 8,100 7.34 17.10 0.057 0 0 108 9.00 July 8,450 8.82 19.10 0.0649 0 0 120 10.00 July 8,730 10.7 21.20 0.0738 0 0 132 11.00 July 8,920 12 22.80 0.0811 0 0 144 12.00 July 9,090 13.7 24.50 0.089 0 0 156 13.00 July 9,220 15.3 26.10 0.0971 0 0 168 14.00 July 9,350 17.1 27.70 0.105 0 0 180 15.00 July 9,470 19 29.30 0.114 0 0 192 16.00 July 9,570 21.1 30.90 0.122 0 0 204 17.00 July 9,660 23.3 32.60 0.131 0 0 216 18.00 July 9,740 26 34.20 0.142 0 0 228 19.00 July 9,800 28 35.50 0.15 0 0 240 20.00 July 9,860 30.3 36.90 0.159 0 0
materials that CIR exhibits a more ductile behavior, i.e., allows more deflection. As both mixtures are exposed to the same climatic situations, they both do not show temperature-related distresses, but behave differently. CIR mixtures reduce stresses by allowing higher deflections. HMA mixtures behave more brittle and deflect less, but do not fail because the tensile strength is higher than the actual stresses.
In summary, these results represent a more than desirable result for the analyzed problem. Thermal cracking of this type of recycled pavement material is of such a low extent that it can be recommended, although more works in terms of performance regarding load-related distresses are necessary.
6. Conclusions and Recommendations
As a pavement rehabilitation alternative, the CIR mixture was evaluated. Specimens were produced using a rational mix-design with SGC. IDT testing was also performed at -20 oC, -10 oC and 0 oC, and compliances and tensile strengths were determined as input parameters for TCMODEL and MEPDG. Although it revealed that the tensile strength of CIR mixtures was reduced by up to 90%, the creep deflection was increased allowing the CIR mixtures to increase strain at a given load. The simulated results showed that no significant thermal cracking is expected to occur over the entire analysis period of 20 years. Thus, the results support CIR as a viable option for roadway rehabilitations. Through the reduced stresses to the environment and the people, CIR can provide a greener and more sustainable approach.
While the performed simulations were limited to exposure to Rhode Island climate, further investigations should be conducted for the severe weather conditions in other US states.
Further questions offer plenty of research possibilities regarding other types of distresses, variations for the additives and more.
Concerning the sample production, two major improvements are recommended. One of them is the
production of more specimens to obtain an increased statistical reliability. In this project, the scope was limited, however, for future research projects more data are recommended. Also, a wet saw with a bigger blade could be better. It should be able to cut specimens with a diameter of 150 mm in one motion, i.e., without having to turn the specimen during cutting.
For the prediction, the used software simplifies the problem as it applies linear elastic fracture mechanics. Newer software is recommended for future use, e.g., “Low Temperature Cracking, TC Model” which contains non-linear approaches [21].
References
[1] Basic Asphalt Recycling Manual, AI (Asphalt Institute), NP-90 College Park, MD, 2011.
[2] Asphalt Paving Technology, Association of Asphalt Paving Technologies, Charlestown, SC, 1992, pp. 304-332.
[3] Understanding Emulsified Asphalts, Educational Series, AI (Asphalt Institute), Aug. 1979, pp. 1-5.
[4] Mix Design Methods for Asphalt Concrete, AI (Asphalt Institute), College Park, MD, 1984.
[5] In-Place Recycling, California Department of Transportation, Division of Maintenance, Feb. 19, 2008, http://www.dot.ca.gov/hq/maint/FPMTAGChapter13-In-Place-Recycling.pdf (accessed June 12, 2012).
[6] S.A. Cross, E.R. Kearney, H.G. Justus, W.H. Chesher, Cold In-Place Recycling in New York States, Final Summary report, SPR Research Project, No. C-06-21, NYSERDA-TORC Contract No. 6764F-2, NYDOT, Albany, NY, 2010.
[7] B.J. Coree, K. VanDerHorst, National Transportation Library, SUPERPAVE® Compaction[Online], 1998, http://ntl.bts.gov/lib/9000/9000/9079/264superpave.pdf (accessed Dec. 15, 2011).
[8] K.W. Lee, T.E. Brayton, H. Milton, Development of Performance Based Mix Design for CIR (Cold In-Place Recycling) of Bituminous Pavements Based on Fundamental Properties, Federal Highway Administration, Washington, D.C., 2002.
[9] M.S. Mamlouk, J.P. Zaniewski, Materials for Civil and Construction Engineers, 2nd ed., Upper Saddle River, Pearson Prentice Hall, NJ, 2006.
[10] D. Walker, Asphalt Emulsions 101, The Magazine of Asphalt Institute, Mar. 2012, pp. 7-10.
[11] R. Roque, W.G. Buttlar, The development of a measurement and analysis system to accurately determine
asphalt concrete properties using the indirect tensile mode, Journal of the Association of Asphalt Paving Technologists 61 (1992) 304-332.
[12] AASHTO Standard Method, American Association of State Highway and Transportation Officials, Washington, D.C., 2011.
[13] M. Marasteanu, W. Buttler, H. Bahia, C. Williams, Investigation of Low Temperature Cracking in Asphalt Pavements, Technical report, St. Paul, MN, 2007. [14] S. Leon, E.V. Dave, K. Park, Thermal cracking prediction
model and software for asphalt pavements, in: T&DI Congress 2011, American Society of Civil Engineers, Chicago, 2011, pp. 667-676.
[15] R.B. McGennis, R.M. Anderson, T.W. Kennesdy, M. Solaimanian, Background of Superpave Asphalt Mixture Design and Analysis, report No. FHWA-SA-95-003, Washington D.C., 1995.
[16] K. Steen, Prediction of rutting and fatigue cracking of cold in-place recycling asphalt pavements using the vesys computer program, Master Thesis, University of Rhode
Island, Kingston, 2001.
[17] K.W. Lee, A.S. Marcus, K. Mooney, S. Vajjhala, E. Kraus, K. Park, Development of Flexible Pavement Design Parameters for Use with the 1993 AASHTO Pavement Design Procedures, FHWA-RIDOT-RTD-03-6, Rhode Island Department of Transportation, Providence, 2003.
[18] Esri, ArcGIS Rhode Island Soil Permeability and Depth to Water Table[Online], 2011, http://www.arcgis.com/home/ webmap/viewer.html?services=4ca8feb53f504b3c9c2b8b cefe0afd4d (accessed June 20, 2012).
[19] H.N. Atkins, Highway Materials, Soils and Concretes, Prentice Hall, New Jersey, 2002.
[20] FHWA, Cold In-Place Asphalt Recycling Application Checklist, US Department of Transportation, Washington, D.C., 2005.
[21] E. Dave, W. Butllar, S. Leon, B. Behnia, G. Paulino, IllTC-low temperature cracking model for asphalt pavements, Road Materials and Pavement Design 14 (2) (2013) 57-58.


![Fig. 1 CRT (current reality tree) [17].](https://thumb-eu.123doks.com/thumbv2/5dokorg/5503573.143347/72.892.189.702.697.1093/fig-crt-current-reality-tree.webp)
