School of Innovation, Design and Engineering
A Framework for Achieving
Data-Driven Decision Making in
Production Development
Master thesis work
30 credits, Advanced level
Product and Process Development Production and Logistics
Natalie Agerskans
Commissioned by: Mälardalen University
Tutors (university): Jessica Bruch, Koteshwar Chirumalla and Erik Flores-García Examiner: Antti Salonen
ABSTRACT
Industry 4.0 and the development of novel digital technologies is forcing manufacturing companies to introduce drastic changes to their productions systems. These technologies provide unique opportunities for manufacturing companies to collect, process and store large data volumes, which can be used to facilitate the coordination of factory elements. Previous research indicate that decisions based on data can provide fact-based decisions which can contribute to an increased productivity. However, manufacturing companies are not fully exploiting data as support for decision-making, which is desirable for an increased competitiveness. Currently, much attention is pointed towards the technology instead of the humans responsible for interpreting data and making decisions. Adding to this, there is a lack of guidance on how manufacturing companies can go from current decision making practices (i.e., decisions based on gut feelings) to fact-based decisions driven by data. To address this gap, the purpose of this thesis is to propose a framework for achieving data-driven decision making in production development in the context of Industry 4.0. The purpose is accomplished by using a qualitative-based case study approach at a small and medium sized enterprise in the electronics industry. The results indicate that both challenges and enablers for achieving data-driven decision making in production development are related to perspectives and attitudes, processes for data quality, technology and processes for decision making. Four maturity levels of data-data driven decision making are also identified. The proposed framework can be used by manufacturing companies to help them plan and prepare for their own specific development path towards data-driven decision making. Contributing to current understanding, this thesis considers the human decision makers perspective to develop the ability to collect, process, analyze and use the data to support time efficient and high-quality decisions, an insight lacking in prior academic studies. Future research may include confirmation of the findings presented in this thesis with additional use cases and industry types.
SAMMANFATTNING
Industri 4.0 och utvecklingen av nya digitala teknologier tvingar tillverkningsföretag att introducera drastiska förändringar i sina produktionssystem. Dessa teknologier skapar unika möjligheter för tillverkningsföretag att samla, processa och lagra stora datavolymer, vilka kan användas för att stödja koordineringen av fabrikselement. Tidigare forskning indikerar att beslut baserade på data kan innebära faktabaserade beslut vilket kan bidra till en ökad produktivitet. Tillverkningsföretag utnyttjar dock inte data som underlag för beslutsfattande, vilket är önskvärt för en ökad konkurrenskraft. I dagsläget är mycket uppmärksamhet riktat mot teknologier istället för de människor som är ansvariga för att tolka data och fatta beslut. Dessutom saknas ledning gällande hur tillverkningsföretag kan gå från nuvarande beslutsrutiner (exempelvis beslut baserade på magkänsla) till faktabaserade beslut på data. Syftet med detta examensarbete är därför att föreslå ett ramverk för att åstadkomma data-baserade beslut genom produktionsutveckling i ett Industri 4.0 kontext. Syftet har uppnått genom en kvalitativ fallstudie på litet och mellanstort företag i elektronikindustrin. Resultaten påvisar att både utmaningar och möjliggörare för att åstadkomma databaserade beslut i produktionsutveckling är relaterade till perspektiv och attityder, processer för datakvalitet, teknologi och processer för beslutsfattande. Fyra olika mognadsnivåer för data-baserade beslut har också identifierats. Det föreslagna ramverket för datadata-baserade beslut kan användas av tillverkningsföretag i syfte att hjälpa dem planera och förbereda sig för deras egna specifika utvecklings mot databaserat beslutsfattande. Genom att bidra till nuvarande kännedom avser detta examenarbete de mänskliga beslutsfattarnas perspektiv gällande utveckling at förmågan att samla, processa, analysera och använda datan för att stödja tidseffektiva och högkvalitativa beslut. Detta är en insikt som saknas i tidigare akademiska studier. Framtida studier kan inkludera verifiering av resultaten presenterade i detta examensarbete med fler tillämpningsområden och typer av industrier.
Nyckelord: Beslutsfattande, Industri 4.0, Utmaningar, Möjliggörare, Mognadsbedömning
ACKNOWLEDGEMENTS
This thesis is a part of my studies in the program Master of Science in Engineering - Innovation, Production and Logistics at Mälardalen University. Further, this thesis is a part of the research project Digitala Stambanan.
I would like to express my deepest gratitude to my supervising team who helped me improve my work. Jessica, I am very thankful for your thorough and honest reviews of my report as well as your guidance during the process of writing this thesis. Koteshwar, thank you for your valuable feedback, advice and suggestions. Erik, I am grateful for your pedagogical feedback, support, friendship and for giving me the opportunity to write this thesis. I would also like to thank my supervising team for inviting me to work in the Innovation and Product Realisation research environment. This opportunity allowed extra support and advice from researchers and other colleges at Mälardalen University.
I am grateful for having had the opportunity to conduct a case study at a Swedish manufacturing company whose name I will not disclose. I would like to thank the employees at this company for their engagement, openness and warm welcome during my visits. A special thanks to my company supervisor who always took the time to patiently guide me. Likewise, I am thankful for have been involved in the Digitala Stambanan research project. This opportunity has allowed me to be a part of interesting and inspiring discussions as well as receiving valuable feedback on my work.
Finally, I would like to thank my family and friends for their support and love during my years of study. I owe a special thanks to my parents, Jens and Ingrid, for their endless support, love, encouragement and for giving me the opportunity to be where I am today.
Natalie Agerskans
Eskilstuna, December 2019
CONTENTS
1 INTRODUCTION ... 1
1.1 BACKGROUND ... 1
1.2 PROBLEM FORMULATION ... 1
1.3 PURPOSE AND RESEARCH QUESTIONS ... 2
1.4 SCOPE OF THE THESIS ... 2
1.5 OUTLINE OF THE THESIS ... 3
2 RESEARCH METHODOLOGY ... 4
2.1 RESEARCH PROCESS ... 4
2.1.1 CASE STUDY METHOD ... 5
2.2 DATA COLLECTION ... 5
2.2.1 THEORETICAL DATA COLLECTION ... 5
2.2.2 EMPIRICAL DATA COLLECTION ... 7
2.3 DATA ANALYSIS ... 9
2.4 VALIDITY AND RELIABILITY ... 11
3 THEORETIC FRAMEWORK ... 12
3.1 PRODUCTION DEVELOPMENT ... 12
3.2 INDUSTRY 4.0 ... 14
3.3 DATA-DRIVEN DECISION MAKING IN PRODUCTION DEVELOPMENT ... 15
3.3.1 CHALLENGES FOR DATA-DRIVEN DECISION MAKING ... 15
3.3.2 ENABLERS FOR DATA-DRIVEN DECISION MAKING ... 18
3.3.3 MATURITY OF DATA-DRIVEN DECISION MAKING ... 19
4 EMPIRICAL FINDINGS ... 23
4.1 INTRODUCTION TO THE STUDIED CASE ... 23
4.2 CURRENT DECISION MAKING PRACTICES ... 24
4.2.1 SHOP FLOOR MANAGEMENT ... 24
4.2.2 PRODUCTION MANAGEMENT ... 26
4.2.3 EXECUTIVE MANAGEMENT ... 27
4.3 OPPORTUNITIES OF DATA-DRIVEN DECISION MAKING ... 27
4.3.1 SHOP FLOOR MANAGEMENT ... 27
4.3.2 PRODUCTION MANAGEMENT ... 28
4.3.3 EXECUTIVE MANAGEMENT ... 29
5 ANALYSIS ... 30
5.1 CHALLENGES FOR DATA-DRIVEN DECISION MAKING IN PRODUCTION DEVELOPMENT ... 30
5.1.1 PERSPECTIVES AND ATTITUDES ... 30
5.1.2 PROCESSES FOR QUALITY DATA ... 31
5.1.3 TECHNOLOGY ... 31
5.1.4 PROCESSES FOR DECISION MAKING ... 32
5.2.1 PERSPECTIVES AND ATTITUDES ... 32
5.2.2 PROCESSES FOR QUALITY DATA ... 33
5.2.3 TECHNOLOGY ... 34
5.2.4 PROCESSES FOR DECISION MAKING ... 34
5.3 MATURITY OF DATA-DRIVEN DECISION MAKING IN PRODUCTION DEVELOPMENT ... 35
5.3.1 LEVEL 0–NO DATA-DRIVEN DECISION MAKING... 35
5.3.2 LEVEL 1–VISIBILITY AND TRACEABILITY ... 35
5.3.3 LEVEL 2–TRANSPARENCY ... 37
5.3.4 LEVEL 3–PREDICTABILITY ... 37
6 PROPOSING A FRAMEWORK ... 39
6.1 CHALLENGES FOR ACHIEVING DATA-DRIVEN DECISION MAKING ... 39
6.2 ENABLERS FOR ACHIEVING DATA-DRIVEN DECISION MAKING ... 40
6.3 MATURITY LEVELS OF DATA-DRIVEN DECISION MAKING ... 41
6.4 APPLICATION OF THE FRAMEWORK ... 44
7 CONCLUSIONS AND RECOMMENDATIONS ... 46
7.1 CONCLUSION ... 46
7.2 RECOMMENDATIONS FOR FUTURE RESEARCH ... 47
8 REFERENCES ... 48 9 APPENDICES ...I
9.1 APPENDIX 1–INTERVIEW GUIDE ROUND ONE ... I 9.2 APPENDIX 2–INTERVIEW GUIDE ROUND TWO ... II 9.3 APPENDIX 3–INTERVIEW GUIDE ROUND THREE ... III 9.4 APPENDIX 4–WORKSHOP ONE:AGENDA ... IV 9.5 APPENDIX 4–WORKSHOP TWO:AGENDA ... V
List of Figures
Figure 1: The research process for this thesis ... 4
Figure 2: The steps in conducting a literature review according to Creswell (2014) ... 6
Figure 3: The data analysis process used in this thesis ... 10
Figure 4: The production development process according to Bellgran & Säfsten (2010) ... 14
Figure 5: The Industrie 4.0 Maturity Index presented by Schuh, et al. (2017) ... 20
Figure 6: The application of the Industrie 4.0 Maturity Index ... 22
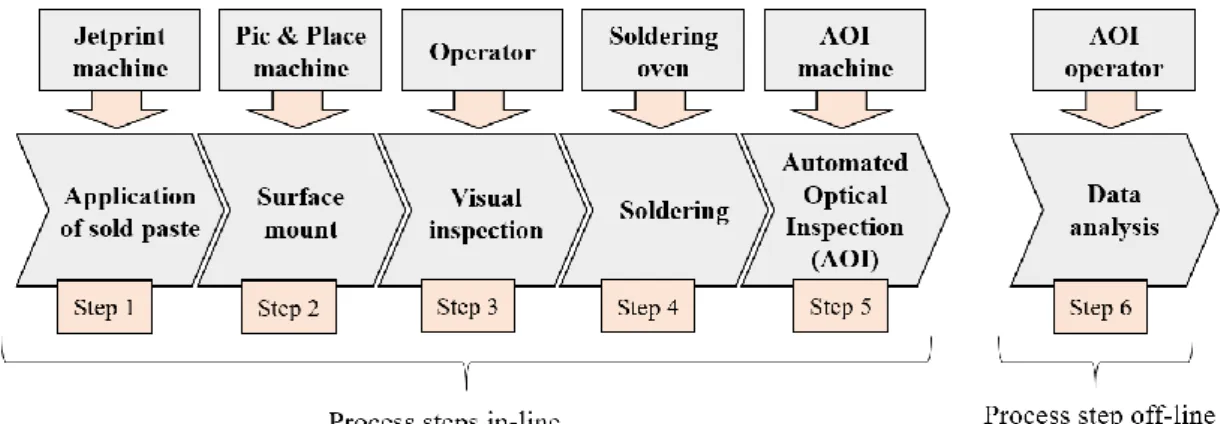
Figure 7: The studied assembly process ... 23
Figure 8: Data flow of the AOI data ... 26
Figure 9: A suggestion of a future assembly process ... 37
Figure 10: Maturity levels for data-driven decision making ... 38
Figure 11: Application steps of the presented framework for data-driven decision making ... 45
List of Tables Table 1: An example of the literature map result ... 7
Table 2: Overview of the data collected at the case company... 8
Table 3: The data quality dimensions presented by Cai & Zhu, (2015) ... 17
Table 4: Maturity levels of data-driven decision making ... 43
List of Diagrams Diagram 1: Radar diagram for the maturity level assessment ... 44
ABBREVIATIONS
Abbreviation Description
CPS Cyber Physical Systems
IoT Internet of Things
1
1 INTRODUCTION
C
HAPTERI
NTRODUCTIONThis thesis studies data-driven decision making in an Industry 4.0 context with focus on how manufacturing companies can achieve data-driven decision making in production development. This chapter describes the background, explains the studied problem area, defines the purpose and scope of the thesis, and outlines the content of this thesis report.
1.1 B
ACKGROUNDData-management practices can increase production performance and are considered to be even more important in decision making of future production systems (Miragliotta, et al., 2018). Currently, the manufacturing industry is in transition towards a new industrial revolution, meaning that manufacturing companies are facing bigger challenges than before. This revolution, commonly referred to as Industry 4.0, is driven by the continuous increase in customer demand and is the result of the novel digital development (Miragliotta, et al., 2018; Sjödin, et al., 2018). Thus, Industry 4.0 is forcing manufacturing companies to develop and to introduce new drastic changes into their production systems in order to keep a competitive advantage (Sjödin, et al., 2018).
Industry 4.0 aims to provide improved quality, flexibility and delivery capability, and also a reduction in production costs (Iansiti & Lakhani, 2014; Porter & Heppelmann, 2014). Manufacturing companies are expected to achieve these benefits by adopting faster and more efficient technologies resulting in integrated and flexible production systems with a continues data-flow through the entire value chain (Miragliotta, et al., 2018; Iansiti & Lakhani, 2014; Porter & Heppelmann, 2014). As such, Industry 4.0 technologies will generate considerably larger data volumes (Miragliotta, et al., 2018; Müller, et al., 2018), facilitating the interconnection and coordination of factory resources. This will provide smarter and more predictive production systems (Miragliotta, et al., 2018).
These technologies also create new opportunities to collect, process and store data. As a result, many managers at manufacturing companies that have already adopted these technologies have changed the way they make decisions. Instead of only relying on intuition managers intend to rely more on data (Brynjolfsson & McElheran, 2016a). Data-driven decision making describes the practices of basing decisions on data and statistical analysis rather than purely on human judgement (Brynjolfsson, et al., 2011). According to Provost & Fawcett (2013), data-driven decision making is the result of data science, which they define as following: “Data science involves principles, processes and techniques for understanding phenomena via the (automated) analysis of data” (p.53). Further, Provost & Fawcett (2013) state that data processing and data engineering are essential to support data science activities. Following Brynjolfsson (2011) and Provost & Fawcett (2013) interpretations, data-driven decision making in this thesis is defined as the practice of basing decisions on automatically analyzed data.
Research indicates that data-driven decision making can provide fact-based decisions, which can result in increased productivity and a competitive advantage (Brynjolfsson, et al., 2011; Müller, et al., 2018; Brynjolfsson & McElheran, 2016b). Therefore, data-driven decision making is predicted to play a key-role within decision making in future production systems.
1.2 P
ROBLEMF
ORMULATIONEven though research suggest many opportunities using data-driven decision making, several challenges still exists that manufacturing companies are not prepared for (Sharma, et al., 2014). Today, many companies are collecting large data volumes (Müller, et al., 2018), but only a small amount of the data collected is being used for decision making (Cai & Zhu, 2015; Dallemule & Davenport, 2017). Consequently, there is an inability to utilize and manage larger data volumes to enable better decisions
2
(Dallemule & Davenport, 2017). Instead, many decisions are commonly made based on the intuition of domain experts (Provost & Fawcett, 2013). This approach can be inefficient and/or biased because of the domain experts lacking a holistic perspective or pre-assumptions (Wong & Wang, 2003). In a Small Medium Enterprise1 (SME) it is not unusual that data collection is still performed manually using pen and
paper, which can obstruct decision making in a timely manner and to document problems correctly when they arise (Park, 2015).
In addition, manufacturing companies are lacking insight on how to go from current decision making practices to a successful data-driven decision making implementation (Sharma, et al., 2014). Much attention is focused on the adoption of new technologies and techniques to stay competitive in an Industry 4.0 context (Khosla & Kaur, 2018; Sjödin, et al., 2018; Cai & Zhu, 2015). Unfortunately, less attention is focused on what data is actually needed by decision makers. Therefore, more attention should be given to what problems can be addressed by applying new technologies (Patel, et al., 2017). In order to transform data into organizational value, it is also vital to consider aspects related to decision making and human judgement (Kahneman, 2003).
To summarize, research shows that data-driven decision making can generate increased business value. For this reason, manufacturing companies need to introduce changes to their production systems in order to facilitate the benefits of data-driven decision making (Bellgran & Säfsten, 2010). However, manufacturing companies are lacking guidance on how to go from current decision making practices to data-driven decision making in production development in order to arrive at better decisions.
1.3 P
URPOSE ANDR
ESEARCHQ
UESTIONSAgainst the described background and problem formulation, the purpose of this thesis is to propose a framework for achieving data-driven decision making in production development in the context of Industry 4.0. To meet this purpose, the following research questions are to be answered:
Research question 1: What are the challenges for achieving data-driven decision making in
production development?
Research question 2: What are the enablers for achieving data-driven decision making in
production development?
Research question 3: How can manufacturing companies assess the maturity of data-driven
decision making in production development?
1.4 S
COPE OF THET
HESISThe main focus of this thesis is to investigate how manufacturing companies can go from current decision making practices to data-driven decision making in production development in an Industry 4.0 context. This thesis will consider the decision makers perspective on developing the ability to collect, process, analyze and use the data to aid time efficient and high-quality decisions. A literature review will provide a general understanding of the concepts of production development, data-driven decision making and Industry 4.0. Since Industry 4.0 is a very broad topic, this thesis is limited to introduce the following Industry 4.0 concepts: internet of things (IoT), smart factory, big data and cyber physical systems (CPS). The literature review will also define the concept of data-driven decision making, identify enablers and challenges for data-driven decision making in production development, and identify how the maturity of data-driven decision making in production development can be assessed.
1 To qualify as a Small Medium Enterprise (SME), three criteria must be fulfilled. First, a SME must be considered
an enterprise meaning that a SME must be engaged in an economic activity regardless of its legal form. Second, a SME must employ less than 250 people. Third, a SME must have either an annual balance sheet total not exceeding EUR 43 million or an annual turnover not exceeding EUR 50 million (European Commission, 2015).
3
The thesis involves a single case study at a SME in the electronics industry. The case study will first analyze the current decision making practices related to a part of the production at the case company. This phase will identify challenges and enablers for current decision making practices. Different decision makers will be identified as well as their decision areas. Decisions that are critical to the case company, but currently difficult to make due to lacking data, will be further analyzed in the thesis. In order to improve these critical decision, challenges and enablers for a successful implementation of the best practice of data-driven decision making will be identified.
1.5 O
UTLINE OF THET
HESISChapter 2 describes the research method used in this thesis. Chapter 3 presents the theoretical framework. Chapter 4 presents the empirical findings from the conducted case study. Chapter 5 analyzes the theoretical and empirical findings in regard to the defined research questions for this thesis. Chapter 6 fulfills the purpose of this thesis by synthesizing the results presented in chapter 5. Finally, chapter 7 concludes the outcome of this thesis and suggests directions for future research.
4
2 RESEARCH
METHODOLOGY
C
HAPTERI
NTRODUCTIONThis chapter describes the methodology used for this thesis. The chapter includes a description of the research design, data collection and data analysis. Finally, the chapter ends with a discussion on the validity and reliability of the thesis.
2.1 R
ESEARCHP
ROCESSWhen conducting a research study, it is essential to follow a clear and structured research process (Yin, 2018). The research process (see Figure 1) for this thesis started by selecting a research topic before an initial literature review on the chosen topic. According to Karlsson (2009), an initial literature search can provide an overlook of existing literature which is beneficial for defining the research objective. The initial literature search resulted in an overview of what is already known within the selected research area as well as research gaps. As a result, a problem definition for this thesis could be defined, enabling the formulation of the thesis purpose and three research questions.
5
2.1.1 C
ASES
TUDYM
ETHODThe purpose of this thesis is to propose a framework achieving for data-driven decision making in production development in the context of Industry 4.0. In order to fulfill the purpose of this thesis an appropriate research method is required. When selecting the research method, three conditions should be considered. The first condition relates to the formulation of the research questions (Yin, 2018). This thesis includes exploratory research questions, which according to Yin (2018) both can be answered by using a case study. The second condition is related to whether the research study focuses on contemporary events, which is the opposite of historical events (Yin, 2018). Since the purpose of this thesis is to propose a framework for achieving data-driven decision making in production development in the context of Industry 4.0, contemporary events are considered. According to Yin (2018), this type of events are suitable when conducting a case study. Thirdly, Yin (2018) suggests that a case study should be conducted when the researcher lack control over behavior events. This thesis aims to study events happening in a manufacturing company setting, and not in a controlled environment. Therefore, there is a lack of control over the studied subject.
Yin (2018) describes that one potential benefit of applying the case study method is to gain a holistic perspective in a real-world scenario. As earlier mentioned, the purpose of thesis is to propose a framework for achieving data-driven decision making in production development in the context of Industry 4.0. Therefore, it was considered highly appropriate to develop this framework by analyzing the activities needed for a certain manufacturing company to go from current decision making practices to data-driven decision making. Taking these facts into consideration, a case study was a suitable research method for this thesis.
In order to enable an in-depth study for this unit, within the timeframe given for this thesis, a single case study was selected. The case selection followed two criteria. First, the case should involve a SME in the manufacturing industry. Second, the case should focus on a limited part of the production where data was collected.
The case study involved data collection at the selected case company over a time period of 20 weeks. During these weeks, I was at the case company 1-5 days per week, mostly for eight-hour days. This allowed for attending weekly meetings and participating in several daily informal meetings, which provided a deeper insight of the studied case. The data collection techniques and procedures used for the case study were interviews, observations, workshops and collecting documentations.
2.2 D
ATAC
OLLECTIONThis thesis includes both theoretical and empirical data. This section describes how data have been collected and applied in this thesis.
2.2.1 T
HEORETICALD
ATAC
OLLECTIONBy conducting a literature review, theoretical data was provided to this thesis. A literature review is explained as locating and summarizing existing studies related to a topic (Creswell, 2014). In order to develop a good research design, Yin (2018) expresses the importance of first building a good theoretical understanding of the studied research area. Further, author suggest that a literature review should be used for generalizing the results from a case study. This thesis has applied the findings from the literature review for both mentioned purposes. Firstly, an initial literature review contributed to a deeper understanding of the studied research area, which was beneficial for designing the case study. Secondly, the findings from a more comprehensive literature review were used for generalizing the empirical findings in order to develop new scientific knowledge.
Even though there is no single way to conduct a literature review, a systematical path is commonly used to collect, evaluate and summarize the literature (Creswell, 2014). The literature review in this thesis was based on the seven steps suggested by Creswell (2014), see Figure 2. The first step was to identify useful keywords in order to locate relevant literature, which was established by preliminary readings within the
6
research area. The following keywords were selected: data management, information management, data analysis, internet of things, IoT, big data, industry 4.0, industri 4.0, data-driven, decision support, decision making, decision management, data analytics, production development, production system development, manufacturing, production, challenges, enabler*, maturity and readiness. The second step was to search for relevant literature by applying the selected keywords in a database. Search strings were created using the selected keywords and the operators “OR” and “AND”. Scopus was used as database for this thesis, since Scopus is the largest database for peer-reviewed literature. The search was limited to articles and conference papers in English published within the years 2009-2019. The third step was to initially identify studies that were related to the research topic. This was achieved by reading the title and abstract of all search hits. The fourth step was to determine if the identified studies (from step three) would make a useful contribution to the thesis. By reading abstract, introduction, headings and conclusion for each study (identified in step three), literature central to the thesis topic were identified. Criteria for further evaluation were based on the purpose and research questions for this thesis. Studies that satisfied these criteria were selected for further review.
Figure 2: The steps in conducting a literature review according to Creswell (2014)
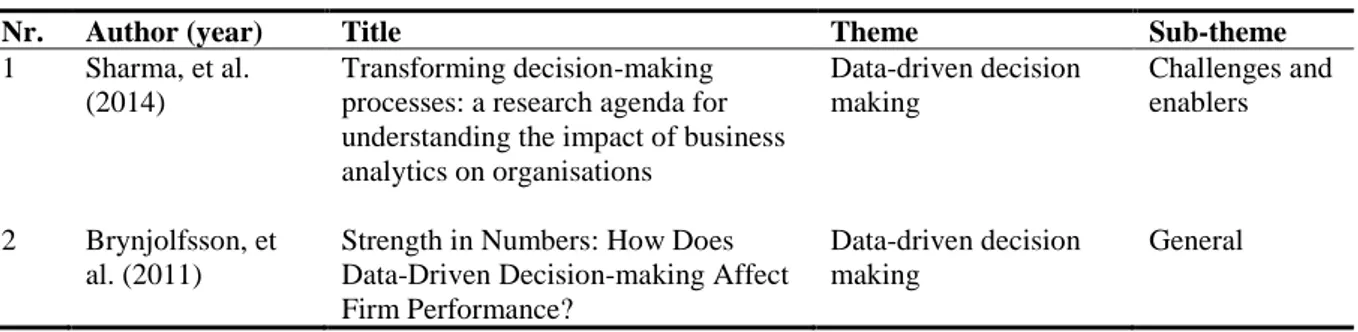
The fifth step involved more thorough reading of the selected literature and the design of a literature map. The literature map provided an overview of the selected literature for this thesis. This was done using an Excel sheet by giving each study a unique number, descriptive theme and sub-theme, see the example in Table 1. This allowed the sorting of articles according to different themes and sub-themes. Additionally,
7
each electronic document was named by its unique number, author, publishing year and title. The electronic documents were stored in different folders named by its sub-theme which turn were stored in a folder named by its theme. This made it easy to keep track of the electronic documents.
Table 1: An example of the literature map result
Nr. Author (year) Title Theme Sub-theme
1 Sharma, et al. (2014)
Transforming decision-making processes: a research agenda for understanding the impact of business analytics on organisations Data-driven decision making Challenges and enablers 2 Brynjolfsson, et al. (2011)
Strength in Numbers: How Does Data-Driven Decision-making Affect Firm Performance?
Data-driven decision making
General
Step six involved drafting summaries of relevant content identified in the literature. The precise references were at the same time included in the summaries. While reading the literature, additional sources of interest were found by tracing the references used in the read literature. When searching for these additional sources the following databases were used: Scopus, Google Scholar, Primo and Web of Science. Step seven was the last step of the literature review and involved assembling summaries and structuring the summaries thematically before finalizing the literature review. The result can be found in the chapter THEORETIC FRAMEWORKFramework.
2.2.2 E
MPIRICALD
ATAC
OLLECTIONEmpirical data was collected at the case company by conducting interviews, participant observations and document collection. An overview of the empirical data collected can be found in Table 2.
One of the most essential data collection techniques of the case study method is the interview (Yin, 2018), therefore several interviews have been conducted at the case company. According to Blomkvist & Hallin (2014) interviews provide the opportunity to, in a relatively simple way, gather information on how different individuals relate to different issues. The interviews conducted in this thesis were of a semi-structured character, meaning that questions related to the topic to be discussed were prepared in advanced. Semi-structured interviews allow to ask follow-up questions which provides a flexibility in the interview and an enhanced understanding of the studied situation (Bryman, 2008). The first round of interviews was conducted in order to gain an overall understanding of what employees were working at the case company and their responsibilities. Therefore, the respondents were asked to explain their overall work assignments and decision areas. The respondents were also asked to explain how they made decisions and what data they considered to be missing for making these decisions. The interview guide used can be found in Appendix 1 – Interview Guide Round One. During these interviews, field notes were made using pen and paper. After each interview, the interview was transcribed in a word document. The outcome from the first round of interviews allowed identifying three decision levels and how different employees were related to the studied case. This was helpful for creating questions and selecting relevant respondent for the second round of interviews.
The objective of the second round of interviews was to, in more detail, map the current practices of decision making and to identify the opportunities of data-driven decision making. These interviews were recorded and afterwards summarized in an Excel sheet. The interview guide used can be found in Appendix 2 – Interview Guide Round Two. The respondents were first asked to tell about their background at the case company and their current responsibilities at the case company. Then, the respondents were asked to explain what type of decisions they were making in their daily work and how they were making these decisions. Challenges related to decision making were also covered. Questions related to data-driven decision making were also asked. These questions considered data missing for decision making and optimal practices of data-driven decision making. The potential opportunities of data-driven decision
8
making were also discussed. The data collected during the second round of interviews allowed the planning of Workshop One, which is described later in this section.
Table 2: Overview of the data collected at the case company Technique No. Duration
(minutes)
Type of data collected Semi structured interviews:
Interview round one 8 10-45 General description of work tasks, current decision making practices, missing data, expectations of data-driven decision making
Respondents: 2 Operators, AOI Operator, 2 Production engineers, Process inspector Production manager, CEO
Interview round two 8 15-56 Description of participant background, work tasks, current decision making practices, challenges related to current decision making practices, missing data, expectations of data-driven decision making Respondents: 3 Operators, AOI Operator, 2 Production engineers, Process inspector Production manager, CEO
Interview round three 7 10-130 Challenges and enablers of data-driven decision making
Respondents: 4 Operators, AOI Operator, 2 Production engineers, Production manager
Participant observations:
Workshop one 1 105 Selection of production decisions for further studies Participants: Operator, AOI Operator, 2 Production engineers, Process inspector
Production manager
Workshop two 4 20-80 Feedback on preliminary findings
Participants: 5 Operators, AOI Operator, 2 Production engineers, Process inspector Production manager, CEO
Shop floor observations Daily Information related to production and routines Informal conversations Daily Wide range, e.g. feedback, opinions
Various meetings 38 Feedback on preliminary results and final results, potential improvements, information about software applications and databases, long-term objectives, information about the overall case company performance
Documents 36 Information about the case company, data available, data, data sources available, software applications
The third round of interviews were conducted after Workshop One. During the time of the third round of interviews, the respondents had been given 1,5-4 weeks since the second round of interviews. This allowed time for the respondents to reflect upon the implementation of data-driven decision making. Therefore, the third round of interviews involved questions related to future practices, data quality requirements and challenges of data-driven decision making. The interview guide used can be found in Appendix 3 – Interview Guide Round Three.
9
Observations are commonly used to provide additional information within the studied area and can for instance be used to complement data collected from interviews (Yin, 2018). This thesis involves passive and participant observations. Participant observations are when the observer participate in the fieldwork situation (Yin, 2018). Participant observations were conducted at the shop floor on daily bases in order to understand the production processes, terminology, practices and current production status. During these observations, questions were asked to the employees in order to ensure a correct understanding of the observed events. Informal conversations with the employees were seen as opportunities of participant observations since these conversations allowed for discussions, feedback and opinions related to the case study. Therefore, informal conversations were conducted on daily basis.
During the case study, various meetings were held to discuss different aspects related to the case study. For instance, software applications, data quality problems, long-term objectives, data quality requirements, and steps for the case company to take after the thesis. Since these meeting allowed the collection of data as well as feedback on findings, these meeting were seen as participant observations. The participants during these meetings were either employees at the case company only or employees at the case company and competence from external parties, for instance one vendor and researchers. Participant observations were also conducted by two organized workshops. The activities performed during the two workshops can be found in Appendix 4 – Workshop One: Agenda and Appendix 4 – Workshop Two: Agenda. The first step of Workshop One was to identify important production decisions related to a limited area at the case company. This was accomplished by letting the participants write important production decisions related to the limited area on post-its. These post-its were afterwards placed on the wall based on themes. Each participant was asked to explain their own post-its. Then, the post-its were categorized by three decision levels. These decision levels were based on decision makers, time horizon and the impact of the decision. At this point, 1-2 decisions could be found at each decision level. Therefore, these decisions were selected for further studies in this thesis. During Workshop Two, preliminary findings from the case study were presented. This considered current decision practices and data-driven decision making for the three decision levels. During the presentation, participants were encouraged to discuss the findings presented which allow for feedback.
Passive observations are when the observer does not participate in the fieldwork situation (Yin, 2018). This thesis involved passive observations during weekly meetings at the case company when the author did not actively participate. These meetings considered weekly updates related to the overall company performance, overall company information, ongoing projects, overall production performance and issues related to production. This gave an overall understanding of how the case company operates.
Secondary data were collected at the case company in the form of documents. According to Yin (2018), the main objective of applying document collection in case study research is to verify and augment data from other sources. For instance, documents can help in confirming the right spellings and titles of names that have been mentioned during an interview. Documents can also provide details that are beneficial to confirm information collected from other sources (Yin, 2018). In this thesis documents were collected and studied in order to verify information gathered from interviews. Spellings related to for instance people names and terminology were also verified by documents. Documents were also used for complementing data collected during interviews by studying more specific and detailed data. To ensure a correct understanding of the documents collected, each document was first explained by a person familiar with the document.
2.3 D
ATAA
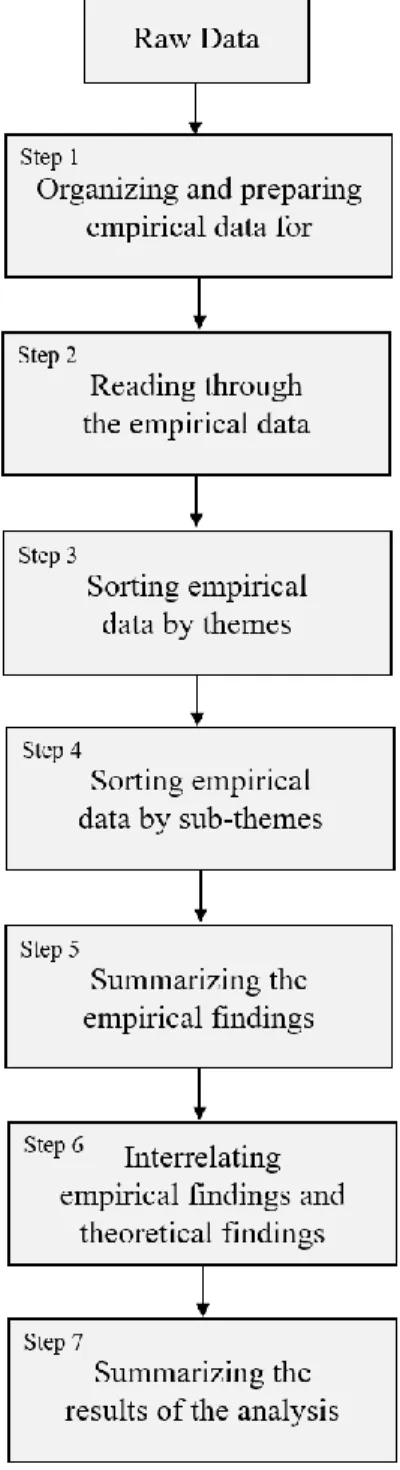
NALYSISThe data analysis applied in this thesis followed the five steps presented in Figure 3. The empirical data collected in this thesis involved transcripts of conducted interviews and field notes from observations, meetings, and workshops. Step 1 was to organize and prepare the empirical data for analysis. This involved summarizing interviews and typing field notes into Word documents. These data were printed
10
and organized according to data type and data source. Step 2 was to read through all empirical data to gain an overview of the data collected and to reflect upon its overall meaning. During this step, the research questions for this thesis was used as guiding criteria. While reading the empirical data, the following themes were identified: case description, current decision making and data-driven decision making.
Figure 3: The data analysis process used in this thesis
Step 3 involved a second reading of the empirical data. During this reading, the data were sorted according to the identified themes. Additionally, sub-themes were identified and documented by handwritten notes. The sub-themes identified were related to three decision levels: shop floor management, production management and executive management. Step 4 was to sort the empirical data according to the identified sub-themes. This was conducted by reading the empirical data by theme and organizing the data based on sub-theme. Step 5 was to summarize the empirical findings which resulted in the chapter EMPIRICAL FINDINGS. Step 6 was to interrelate the empirical findings and the theoretical findings with the research
11
questions for this thesis as guiding criteria. This was conducted by searching for similarities and differences between these data which was accomplished by handwritten notes while reading the data. After reading the data, these notes were typed into an Excel sheet. Step 7 was to summarize these results in text which can be found in the chapter ANALYSISnalysis which provided answers to the three research questions used for thesis. Since the purpose of this thesis was to propose a framework for achieving data-driven decision making, the answers to the three research questions for this thesis were combined to fulfill this purpose. This was presented in the chapter PROPOSING A FRAMEWORK .
2.4 V
ALIDITY ANDR
ELIABILITYWhen conducting a research study, it is important to consider both validity and reliability (Bryman, 2008). In qualitative research, validity refers to whether the findings correctly reflect the studied situation and that research findings are supported by evidence. During this thesis, the author was present at the case company 1-5 days per week which helped in generating a deeper understanding of the studied area. This involved participating in both formal and informal meetings. This provided an overall understanding of the organization which was helpful for this study. A method commonly used in qualitative research is triangulation, which is applied to verify and establish validity in a study by analyzing each research question from several perspectives (Guion, et al., 2002), using multiple data sources to build consistent justifications related to a certain topic (Creswell, 2014). To ensure validity in this study, triangulation was achieved in the empirical data collection by conducting interviews with different key stakeholders, performing observations and document collection. During these interviews, field notes were taken or recordings were made to document the data. Additionally, theoretical data was collected by a literature review. Empirical and theoretical findings were compared to identify areas of agreement and areas of divergence. Another tactic to establish validity is for a key informant to review a draft of the case study report (Yin, 2018; Creswell, 2014). In this thesis, workshops were held to verify the empirical findings to key informants. During these workshops, empirical findings were presented and discussed by all people present during the workshop. This allowed verifying that the collected data had been interpreted in a correct way. Additionally, this allowed for discussions regarding the empirical findings which allowed for different perspectives and many details. The supervisor at the case company also reviewed a draft of the empirical finding from the case study before finalizing the report. This was done to verify a correct reflection of the empirical findings in the report.
Reliability refers to whether a conducted study can be repeated and obtain the same results. The key enabler for reliability is to document all activities and procedures in a study (Yin, 2018). To establish reliability in this thesis, a weekly diary has been written where activities and people involved were documented on a weekly basis. The diary also involved topics and areas that had been addressed. Additionally, interview guides and workshop guides were created and saved. These can be found in the section APPENDICESppendices. In order to enable repeating the literature review, the process was thoroughly documented, see the section Theoretical Data Collection.
12
3 THEORETIC
FRAMEWORK
C
HAPTERI
NTRODUCTIONThis chapter presents the theoretical findings in this thesis. The concepts of production development, Industry 4.0 and data-driven decision making in production development are presented. The chapter also presents challenges, enablers and maturity levels of data-driven decision making.
3.1 P
RODUCTIOND
EVELOPMENTThe increased range of products variant, shortened product lifecycles, new manufacturing technologies and processes have resulted in a high competitiveness between manufacturing companies (Hu, et al., 2011). To meet these challenges, there is a need for manufacturing companies to constantly develop and introduce changes into their production systems to stay competitive (Bellgran & Säfsten, 2010; Holweg, 2008). Production development considers the changes that aim to improve existing production systems or to create completely new ones in order to facilitate new products and processes. The objective of production development is for manufacturing companies to accomplish effective production processes and to develop its production ability (Bellgran & Säfsten, 2010).
In production development, Bellgran & Säfsten (2010) defines two degrees of change: minor and major. A minor change involves modifications to an existing production system. This type of change is typically executed as part of the daily work tasks. A major change involves creating an entirely new production system and is commonly executed in project form (Bellgran & Säfsten, 2010). Porras & Robertsson (1992) distinguish between degrees of change by the concepts of first degree and second degree changes. In a first degree of change, the fundamental principles of the system enabling a desired performance are intact post-change. A first degree of change could involve developing an assembly system similar to a previous system (Bellgran & Säfsten, 2010). A second degree of change, is a change resulting in a paradigm shift due to radical adjustments of the production system, which includes the involvement of several organizational levels. For instance, the transition from manual production to automated production would be considered a second degree change (Porras & Robertsson, 1992).
The production development process involves integrating people, machines, tools, materials and information into a system that creates value to the customer (Bellgran & Säfsten, 2010). Therefore, production development also requires developing organizational capabilities and a holistic view of subsystems as well as their elements and interrelations (Bruch and Bellgran 2014). When developing a production system, it is therefore important for all elements throughout the value chain to work towards a common goal to achieve a system level optimization (Aslam, et al., 2018). Thus, objectives and goals of an organization must be aligned and combined through different organizational levels. Misalignment of organizational goals and objectives may instead result in consequences such as increased costs, decreased utilization of resources, increased cycle times, loss of competitiveness and agility (Yan, et al., 2016).
Since production development is a complex task, there is a need for a structured development process. One way to structure a production development process is to first define a number of fundamental phases. A second step is to define detailed activities that should be included in these phases (Bellgran & Säfsten, 2010). Bellgran & Säfsten (2010) presented a structured process for developing a production system, which is presented in Figure 4. The first phase, management and control, involves the preparation of an investment request and the development planning. This phase should also involve the planning for establishment of acceptance among the stakeholders, evaluation, information management and learning during the development project. Additionally, questions related to available resources in terms of financing, personnel, and time should be discussed. This is important since the relations between these variables have a significant impact on what priorities should be made. The outcome of this phase is a plan for the production development project. The seconds phase, preparatory design, involves a background
13
study and a pre-study. The background study aims to analyze existing production systems within the manufacturing company as well as benchmarking production systems at other manufacturing companies. Data related to products to be produced in the production system are also collected (Bellgran & Säfsten, 2010). When analyzing the existing production system, the following areas should be considered: current technologies and systems and how they operate within the company (Schuh, et al., 2017). The pre-study is a forward looking analysis where the manufacturing company’s goals and strategies are considered (Bellgran & Säfsten, 2010; Schuh, et al., 2017). In this activity it is important to clarify what competitive advantages are desired. A roadmap could be used to support the planning of future developments as well as guiding the subsequent alignment of strategies and objectives (Kostoff & Schaller, 2001; Schuh, et al., 2017). A roadmap is a tool which allows the definition of an organizations current state and objectives, and to discover suitable paths (Schuh, et al., 2011). The results from the background study and the pre-study can be used to determine the capabilities the company needs to acquire in order to meet its strategic objectives (Schuh, et al., 2017). The outcome should be translated into a requirement specification for the development project. Consequently, the requirement specification should reflect the production strategy and include desired characteristics for the new production system. In the third phase, design specification, the production system is being designed. First, conceptual production systems are designed meaning that ideas are developed related to physical hardware, information systems, organization of work tasks and work environment. Second, alternative production systems are evaluated with consideration to the requirement specification and costs. Results from the evaluation should be summarized and communicated to stakeholders before a decision is made. The chosen production system is then communicated and acceptance among the stakeholders is established. Third, the chosen production system is designed in detail with consideration to the design of work space and work tasks. Different solutions are evaluated and selected solutions are established among the stakeholders. The outcome of this phase is a detailed description of how the new production should be designed. The fourth phase is realization and planning. In this phase technical equipment is procured and installed. The function of the technical system is also verified. This phase also involves the planning of the start-up which includes preparation of the organization, selection of a start-up strategy, appointing responsibilities related to the start-up and planning for training of employees. The outcome is a physical production system in place. The fifth phase, start-up, involves executing the start-up plan developed in the previous phase. When the new production system is in operation, the results as well as the development process getting there should be evaluated.
14
Figure 4: The production development process according to Bellgran & Säfsten (2010)
3.2 I
NDUSTRY4.0
With the development of Industry 4.0, manufacturing companies are facing a new era of intelligence, connection and digitalization (Miragliotta, et al., 2018). The goal is for companies to generate knowledge from data to support decision making in the entire organization (Schuh, et al., 2017), for example production development. This makes data management an essential element of Industry 4.0 (Miragliotta, et al., 2018). Industry 4.0 includes the concepts of horizontal and a vertical integration. The horizontal integration refers to a data flow throughout the entire value chain, while the vertical integration refers to the data exchange between organizational functions - from development to finished products (Hozdić,
15
2015). By adopting a combination of merging digital and physical technologies (Ustundag & Cevikcan, 2018), factories of the future are predicted to have manufacturing solutions that can provide an extremely high flexibility and adaptation in regard to production processes. Industrial equipment will communicate with each other, humans, automated processes and functions that enable real-time interaction between the production floor and the market (Iansiti & Lakhani, 2014; Porter & Heppelmann, 2014). The outcome is a fully integrated system enabling fast problem solving at the production floor and for manufacturing companies to respond to rapid changes in customer demand (Hozdić, 2015). This type of factory is usually referred to as a Smart Factory (Sjödin, et al., 2018). To understand how a Smart Factory is built from a digital perspective, some key technologies and systems will be explained.
Cyber Physical Systems (CPS) are systems that deal with the integration of physical elements and computational capabilities (Mohamed, 2018). Using sensors and actuators embedded in physical objects (McKinsey Digital, 2015), CPS can collect real-time data from different processes which are converted into digital signals. Further, CPS are able to share this data and access data that provides a connection to digital networks (Mohamed, 2018) This forms an Internet of Things (IoT), which is the part of CPS that allows an internet-connection between physical objects, humans, systems and products (Mohamed, 2018). Consequently, this generation is about managing large volumes of data (Miragliotta, et al., 2018). The term Big Data can be defined as the set of unstructured, semi-structured, and structured data, collected from diverse sources (Rehman, et al., 2016). By collecting and analyzing big data from different sources, these large amounts of data can act as support for several decisions (Cai & Zhu, 2015). To uncover the valuable information that these large data volumes holds, substantial resources are required to process the data. Big Data Analytics can be applied to support a quick data-driven decision making process, by a rapid transformation of data into information (Rehman, et al., 2016).
3.3 D
ATA-D
RIVEND
ECISIONM
AKING INP
RODUCTIOND
EVELOPMENTData-driven decision making can be connected to technical disciplines, such as, business intelligence (Chen, et al., 2012), data mining and knowledge discovery (Fayyad, et al., 1996) and decision support systems (Arnott & Pervan, 2008). To transform data into organizational value, it is vital to also consider aspects related to decision making and human judgement (Kahneman, 2003). Consequently, there is a need for a system where both technology and humans are considered. In this thesis, this will be referred to as a system for data-driven decision making.
3.3.1 C
HALLENGES FORD
ATA-D
RIVEND
ECISIONM
AKINGEven though the overwhelming evidence highlights many opportunities of using knowledge generated from data to inform decision making, practice indicates that this knowledge does not always result in good decisions (Sharma, et al., 2014). This section presents challenges that can be linked to data-driven decision making in production development.
PERSPECTIVE AND ATTITUDES
The fundamental element in all organizations are the people (Jacobsen, 2012). Therefore, people have a huge impact on a development project. As stated by Bellgran & Säfsten (2010, p. 149): “How, what, and in what way people think affects of course the final result, and not least – the way to get there”. However, a development project can overlook the human aspects of change and instead focus on the technical aspects (Bellgran & Säfsten, 2010). Resistance towards change is a common phenomenon (Jacobsen, 2012) that can hinder a successful implementation (Alves, et al., 2015). There could be different underlying reasons for resistance towards change, for instance fear of the unknown, disagreements, and extra workload as a result of the change (Jacobsen, 2012).
Adding to this, much attention is focused on technologies that allow manufacturing companies to collect and store data (Patel, et al., 2017). But, as pointed out by Sharma et al. (2014): “despite the hopes of many, insights do not emerge automatically out of mechanically applying analytical tools to data. Rather, insights emerge out of an active process of engagement between analysts and business managers using the data and analytic tools to uncover new knowledge” (p. 435). A common mistake is to start with the
16
wrong problem formulation, or not having a clear problem formulation at all (Leek & Peng, 2015). This could be overcome by composing a multi-disciplinary project team that possess domain experts, statistical and computational skills (Sharma, et al., 2014). This team could be seen as the designers of a system for data-driven decision making. These designers are responsible for making essential decisions regarding what data should be selected and what conclusions should be drawn from the data (Lycett, 2013). Since these designers are human, it means that the designers are prone to human biases (Tversky & Kahneman, 1974). This could have an impact on the insight generated from the data as well as the decisions made based on the data (Thiess & Müller, 2018). Consequently, human “sense-making” can have an impact on the process of transforming data to insights (Lycett, 2013).
Sharma, et al. (2014) stated that the process of converting knowledge into a decision is influenced by both psychological and contextual factors. Some decision makers may select the course of action that will satisfy the lowest requirements necessary to achieve a specific goal, but these decisions are not necessarily the most optimal alternatives. This decision making approach is referred to as satisficing (Simon, 1956). Another factor that can hinder decisions based on data to generate a higher organizational value is that there is no guarantee that effective decisions will be successfully implemented. “Decision acceptance” refers to whether the stakeholders responsible of implementing the decision to commit to the decision (Sharma, et al., 2014). This could be caused by fear of misunderstanding the meaning of the data (Machado, et al., 2019). Decision acceptance can therefore be affected by the comprehensibility of a decision support system (Gregor & Benbasat, 1999; Kayande, et al., 2009). Too high complexity in decision support systems can obstruct the decision makers understanding and, therefore, also use the output of the system. This occurs when there is a large gap between the decision support system model and the individual decision maker’s mental model. As a result, the output provided by the system is likely to conflict with the decision maker’s own experience and intuition. In these situations, the risk-averse decision maker is likely to rely on his or her “gut feeling” instead of the results gained from the decision support system (Kayande, et al., 2009).
PROCESSES FOR QUALITY DATA
According to Schuh, et al. (2017), data should be collected, processed and stored in a way that supports decision making. The quality of the data plays a crucial role for how well the data supports decision making (Morbey, 2013). Data quality can be defined as: “… the degree of fulfilment of all those requirements defined for data, which is needed for a specific purpose” (Morbey, 2013, p. 4). Considering this, comprehensible statements regarding data quality can only established after appropriate requirements for the data have been defined. According Cai & Zhu (2015), data quality can be divided into five dimensions: availability, usability, reliability, relevance, and presentation quality, see Table 3
. Considering these five dimensions, achieving quality data can be complex task. As the data volumes are tremendously large in big data, it is difficult to assess data quality and transform unstructured data into structured data within a reasonable timeframe. Another issue is related to the fast changes of data, which makes the “timelines” very short. If companies are not able to analyze the data within the required timespan, they risk obtain invalid and outdated data. Adding to this, unified and approved data quality standards have not yet been formed (Cai & Zhu, 2015).
17
Table 3: The data quality dimensions presented by Cai & Zhu, (2015) Dimension Elements Availability Accessibility Timeliness Usability Credibility Reliability Accuracy Consistency Integrity Completeness Relevance Fitness Presentation quality Readability
TECHNOLOGY
To enable quality data for decision making, certain technologies will be required for collecting, processing and storing data (Davenport & Harris, 2007). A company that does not possess the required technologies must instead have the financial resources for upgrading existing technology or the investment of new ones. Since these investments can be costly the implementation of new technologies to facilitate decision making highly relies on the availability of financial resources (Mittal, et al., 2018). Additionally, the complexity of Industry 4.0 technologies (Sjödin, et al., 2018) and lacking internal knowledge about new technologies (Machado, et al., 2019) makes it difficult to define potential benefits of new investments which creates an uncertain business case (Machado, et al., 2019; Sjödin, et al., 2018). It can also be difficult to define the adoptions needed to the current production system when implementing new technologies (Sjödin, et al., 2018). Therefore, a company must have the right resources in terms of people with the right skills. This involves people with knowledge to identify and integrate the required technologies and techniques. However, people with expertise in technologies such as big data analytics can be hard to find (Janssen, et al., 2017).
Within an organization, separated data sources and systems are commonly used (Schuh, et al., 2017). The integration of data from multiple sources into a single system enables an easier access to data as well as an overview of the data (Ziegler & Dittrich, 2007). Since multiple sources of industrial data can involve differences in source type, format and dimension, the integration of data does not come without challenges (Corallo, et al., 2018; Morton, 2014; Yan, et al., 2017). To extract useful information from multisource data, the unstructured and semi-structured data must be transformed into structured data (Yan, et al., 2017).
PROCESSES FOR DECISION MAKING
Other challenges for data-driven decision making relates to the selection of decision making procedures and authority to make decisions. If decentralized decisions are taken, the local decision-makers will be closer to the facts which could provide a better picture of the circumstances. Achieving the same quality in a centrally taken decision would be more expensive because of the cost of conveying the information to the central level. On the other hand, decentralized decisions also generate costs either because they are not properly coordinated with each other and therefore potentially fail to consider what is best for the company as a whole or because they require additional management input to align them with the company’s overall goals. Consequently, certain decisions must be taken centrally, for instance decisions concerning the company’s strategy, whereas other decisions can be made more cost-effectively if they are decentralized (Schuh, et al., 2017).
18
3.3.2 E
NABLERS FORD
ATA-D
RIVEND
ECISIONM
AKINGPERSPECTIVES AND ATTITUDES
Davenport & Harris (2007) explaines the importance of preparing the empleyees for a change towards a data-driven organization. This considered all levels within an organization. Davenport & Harris (2007) presented two alternative paths aiming to demostrate the value of data. The first path is to initiate a small pilot project that aims to show the value of data driven decision making. The objective of a pilot project is to create a success story that will inspire people within the company to work with data. Therefore, it is essentail to select a case that will guarantee succes and easily obtainable results. Consequenlty, the pilot project should involve a minimum input that will guarantee a high output. The second path involves a more straight forward approach. A company with a Chief Executive Officer (CEO) (or other top executive) that strongly advocates data-driven decisions could set a good example towards working with data. It is important for the CEO to inspire the entire company to make decisions based on data instead of intuition. Additionally, there is a need to express a clear need for change towards a data-driven organization (Davenport & Harris, 2007).
Bellgran & Säfsten (2010) described the importance of establishing acceptance among the employees during the development project. Active participation by empleyees and good communication during the development project facilitates the establishment of acceptance among the employees. Clear communication with upper management is also important. These people are usually not familiar with terminology related to analytics and data issues. When facing business goals, it is important to clarify what is possible to accomplish in order for upper management not to mistrust or set overwhelming goals (Vodenčarević & Fett, 2015).
To address challenges related to decision acceptance, key stakeholders could be involved in the decision making process. This may, on the other hand, slow down the decision making process, and therefore, the number of participants in the decision making process should be carefully considered (Vroom, 2003). Since high complexity in a decision support system can obstruct the decision makers in understanding the generated data, the comprehensibility of a decision support system should be prioritized (Gregor & Benbasat, 1999).
PROCESSES FOR QUALITY DATA
A fundamental requirement for generating value of data is to use the right data, meaning that data must be collected and processed to supports decision making (Schuh, et al., 2017). Therefore, it is important to thoroughly define what data is needed to make a decision (Bärring, et al., 2018). To understand what issues needs to be address in an organization, the domain experts are the people who can identify where the challenges and opportunities are (McAfee & Brynjolfsson, 2012). Saaty (1990) stresses the importance of first defining the problem underlying a certain decision and to clarify the purpose of the decision. The criteria and sub-criteria of the decision must be defined along with stakeholders affected by the decision. At this stage, the alternative actions to be taken should also be identified (Saaty, 1990). It is important to define what data quality is required for making a decision (Janssen, et al., 2017). Since data-driven decision making highly relies on the data being used for making a decision, it can quickly be noted that poor data quality will affect the quality of a decision (Divan, 2017; Janssen, et al., 2017; Schuh, et al., 2017). The quality of the data does not only depend on the data itself, but also on the process in which the data are being acquired and how data are processed (Janssen, et al., 2017).
TECHNOLOGY
Depending on what data is needed for decision making and what data is available within the company, it might be necessary to define a new system for data management that fulfills the decision maker’s data quality requirements (Power, 2008). Data management can be defined as the practice of managing digital data and resources, considering a wide range of activities, such as collection, storage and discovery (Li, et al., 2013). All stages of the data management life cycle involve both technical and management challenges that can have a huge impact on a company’s ability to make high quality decisions (Marchand,