ABSTRACT OF THESIS
ALTERING THE CALCIUM-PHOSPHORUS
RATIO FOR FATTENING STEERS
Submitted by
Roy Wilkes
In partial fulfillment of the requirements
for the Degree of Master of Science
Colorado State College
of
Agriculture and Mechanic Arts
Fort Collins, Colorado
April , 1943
- t:1 ...COLORADO
C\.~\·~~'th
lll~l~illl~lllillilllilll~ 111111~111~~11111~11~1~
U18400 90736783.7t/J, 7CC~
AO
I
q
3
I I
a,
ALTERING THE CALCIUM-PHOSPHORUS
1RATIO FOR FATTENING STEERS
Research workers have shown that gain in weight by
steers can be enhanced by adding a calcium and/or
phos-phorus supplement to many common rations, but there is
still uncertainty regarding the optimum amount or ratio
of calcium and phosphorus to include in the steer
fatten-ing ration. This problem is complicated by several
fac-tors: for instance, (1) the calcium and phosphorus in
various feeds and supplements are not available to the
same extent, (2) there are certain other minerals which
hinder the absorption of calcium or phosphorus, (3)
un-der some conditions calcium and phosphorus are
precipi-tated in the digestive tract as insoluble tricalcium
phosphate, (4) vitamin D affects calcium and phosphorus
utilization, and (5) there are physiological differences
I
in steers which cannot be gauged accurately at the
pres-ent time.
In addition to the abov·e complications, there is
Ianother angle to the problem apparently overlooked by
research workers; that is, the optimum quantity and
ra-tio of calcium and phosphorus may not be constant for
the whole fattening period. From two standpoints, at
least, this possibility has promise. First, the
feed-ing period may encompass two phases; the preliminary
part being concerned more with promoting growth and the
-~
latter part predominantly a fattening process . Each of
these phases might require different amounts of calcium
and phosphorus . From the second viewpoint, steers are
normally taken off a grass pasture and put into the
feed-lot for fattening, and since grass ordinarily has a high
ratio of calcium to phosphorus, it seems possible that
the feeding of a ration high in phosphorus would
stimu-late gro~~h for at least a temporary period .
Therefore, the objects of these experiments have
been as follows:
(1) To determine in what respects, if any , the
cal-cium and phosphorus metabolism of the yearling beef steer
differs at the beginning as compared with the end of the
fattening period.
(2) To determine what effect on gain in weight is
induced by altering the amounts and ratio of calcium and
phosphorus in the ration du~ing the fattening period.
(3) To obtain some indication of the time, manner,
and extent of change to which the amounts and ratio of
calcium and phosphorus may be subjected with favor•able
results during the fattening period.
The study on the effects of altering the amounts and
ratio of calcium and phosphorus was made as a
supplemen-tary part of two feeding experiments conducted by the
Animal Investigations Section, using eight lots of 10
yearling Hereford steers each in 1941-42 and seven
-3-similar lots in 1942-43. However, there was
consider-able variation in the kinds and amounts of feeds fed in
the different lots and not nearly all the variation in
gains could be attributed directly to the different
amounts or ratios of calcium and phosphorus in the
ra-tions.
For more direct and specific data, blood analyses
and digestion-balance trials were used. Blood samples
were taken from the jugular veins of two average steers
from each lot at the beginning and at the end of the
ex-periment in 1941-42 and every 30 days during the
experi-ment in 1942-43. These samples were analyzed for
cal-cium and phosphorus content. Two digestion-balance
trials were conducted each year, one when the steers
had reached the feed level at which they were to be
main-tained and the other near the end of the fattening
exper-iment. In 1941-42, each trial extended for a period of
14 days. In 1942-43, each trial covered a period of 22
days, with the first seven days being a preliminary
pe-riod during which time no collection or sampling was
done. Six steers were used for each trial in 1941-42,
each steer from a different lot. Only six
digestion-balance stalls were available, and it was believed the
six lots selected would best represent the whole
experi-ment . In 1942-43, four steers were used for each trial,
two from lot I, in which the standard ration was fed,
-4-and two from lot IV, in which the calcium-phosphorus
ra-tio was altered during the feeding period.
In the first year's experiment, one lot of steers
made temporarily accelerated gains following the
addi-tion of phosilage, a rather concentrated phosphorus
sup-plement, to their ration early in the feeding period.
However, this increased rate of gain only lasted
slight-ly more than a month, and at the end of the feeding
pe-riod these steers had about average gains compared with
those in the other lots . Within a month after the
addi-tion of phosilage to their raaddi-tion, the steers developed
a luster and sheen to their hair coat not evidenced by
the steers in any of the other lots, and they retained
this appearance for the remainder of the experiment .
The steers used in the digestion-balance trials retained
more phosphorus during the first trial and more calcium
during the second, excreting far more calcium in the
urine during the first trial . This indicated that a
phosphorus supplement would be more likely to induce a
favorable response if added to the ration during the
first part of the feeding period and a calcium
supple-ment if added during the latter part . Also tending to
indicate the same thing, there was an average loss of
both calcium and phosphorus content of the blood from
the beginning to the end of the experiment, calcium
being decreased more than phosphorus .
-5-In the second year•s ·experiment, greater gains
a-gain followed the addition of phosilage to the ration
of one lot of steers early in the feeding period, and
also followed the addition of calcium carbonate and
re-duction of phosilage late in the experiment, but again
these increa sed gains were temporary. The steers
re-ceiving phosilage again developed glossy hair coats
which persisted well into the summer. In the
digestion-balance trials, the retention of calcium and phosphorus
tended to vary in accordance with the amount of each of
these minerals included in the ration, provided the
steers had sufficient time to -adjust themselves to any
changes in the ration . There was an increase from the
beginning to the end of the feeding experiment of both
c~lcium and phosphorus in the blood; these results
dif-fering from those of the previous year mainly because
of a variation in the amount of calcium and phosphorus
in the blood at the beginning of each year's
experi-ment .
LJeRA Y
JOLORADO
STATE COLLEGE
OF A.
THESIS
ALTERING THE CALCIUM-PHOSPHORUS RATIO FOR FATTENING STEERS
L 18h.AR"l
l0~i\L10 , i.' :
C(JII
ECE OF A.
& •
A.
FO 7 Cu:...L )NS COLGRAOQ.
Submitted by Roy Philip Wilkes
In partial fulfillment of the requirements for the Degree of Master of Science
Colorado State College of Agriculture and Mechanic Arts
Fort Collins, Colorado .July 27, 1945
- - - -- - -- -- - - ~~ ~ ~ ,.._ _ __ _ __...-'-..,-. . -.-•-· ... L ... ~.06 ,_ ,i
COLORADO STATE COLLEGE OF
AGRICULTURE AND MECHANIC ARTS
··· ... }.w.i ...
i.7 ...
194 .~ ... .I HEREBY RECOMMEND THAT THE THESIS PREPARED UNDER MY SUPERVISION BY .. F.:9Y .. f~;iJ.;i; P. ..
W
.. . . .. . . . .. .. . . .. . . .. .. . . . ... . . ... .
ENTITLED ....
/µ/.f~HQ.
r.~.
9~91.V:.::-P .. m)R . .f.fiQ@.$..J.½'.J;'J.9. .. f.9.:R .. fA+'.T~LrnG ...
STEERS... ... ··· ... ... ... ... . BE ACCEPTED AS FULFILLING THIS PART OF THE REQUIREMENTS FOR THE DEGREE OF MASTER OF. .. .. .. $.Q;I~.C~ ... ... . MAJORING IN ... .... ...
J.J'J;'_~;:p.JQ~ .... ... .
CREDITS ...
l.0 ... .
... ~ £.c.0 .
-Examination Satisfactory
... \:l~ ..
... .
Dean of the Graduate School
Permission to publish this thesis or any part of it mus t be obtained from the Dean of the Graduate School.
ACKNOWLEOOMENTS
This is to acknowledge the cooperation of
Mr.
H. B. Osland andMr. R. C. Tom, through whose courtesy these experiments were made
possible, and the valuable advice and counsel of Dr. L.E. Washburn
in planning and conduct ing the digestion-balance trials and in per-forming the chemical analyses •
TABLE OF CONTENTS
Page
INT'RODUCTION... 7
REVIEW OF LITERA.TtJRE. • • • • • • • • • • • • • • • • • • • • • • • • • • • • • • • • • • • • • • • • • 9 MA.TER.IALS AND METHOOO... • • • • • • • • • • • • • • • • • • • • • • • • • • • • • • • • • • 12
DIGESTION-BALANCE TRIALS --- 194l-42 •...•.•...•••....••.• 17 BLOOD ANALYSES -- 1941-42... 20
STEER GAINS -- 1941-42... 25
RESULTS OF 1941-42 EXPERIMENT... 24 DIGESTION-BALANCE TRIALS - 1942-43... 27 BLOOD ANALYSES -- 1942-45... 30 STEER GAINS -- 1942-45 ••••••••••••••••••••••••••••••••••••••• 35 RESULTS OF 1942-43 EXPERIMENT ••••.••••••••••••••••.•••.•••••.• 35s
tJMM.A..BY • • • • • • • • • • • • • • • • • • • • • • • • • • • • • • • • • • • • • • • • • • • • • • • • • • • • • • • 56CONCLUSIONS... 38
.APPEN"DIX. • • • • • • • • • • • • • • • • • • • • • • • • • • • • • • • • • • • • • • • • • • • • • • • • • • • • • 39 BIBLIOGMPHY. • • • • • • • • • • • • • • • • • • • • • • • • • • • • • • • • • •. • • • • • • • • • • • • • • • 55 _.,._....
---·----
... _,,,...
_______
_:/
LIST OF TABLES
Page
I. DIGESTION-BALANCE TRIALS - 1941-42 •••••••••••••••••• 16 II. BLOOD .ANALYSES - 1941-42 •••••••••••••••••••••••••••• 19 III. STEER GAINS - 1941-42••••••••••••••••••••••••••••••• 22 IV. DIGESTION-BALANCE TRIALS - 1942-43 •••••••••••••••••• 26
V. BLOOD ANALYSES - 1942-43•••••••••••••••••••••••••••• 29
..
VI. STEER GAINS - 1942-43••••••••••••••••••••••••••••••• 32 VII. STEER FEEDING EXPERIMENT -- 1941-42 ••••••••••••••••• , 39 VIII. MINERAL INT.AKE DURING FEEDING EXPERIMENT -- 1941-42. • 40 IX-A. DIGESTION-BALANCE TRIAL I -- Jan. 29 - Feb . 11, 1942• 41 IX-B. DIGESTioN.:..BAL.ANCE TRIAL I - Jan. 29 - Feb . 11, 1942. 42X-A. DIGESTION-BALANCE TRIAL II - April 12 - April 26 ,
1942 •••••••••••••••••••••••••••••••••••••••••••••••. 45
X-B. DIGESTION-BAL.ANGE TRIAL II - April 12 - April 26,
1942 •••••••••••••••••••••••••••••••••••••••••••••••. 44 XI-A. CHEMICAL .ANALYSES OF FEEDS USED IN STEER FEEDING
EXPERIMENT - 1941-42•••••••••••••••••••••••••••••• 45
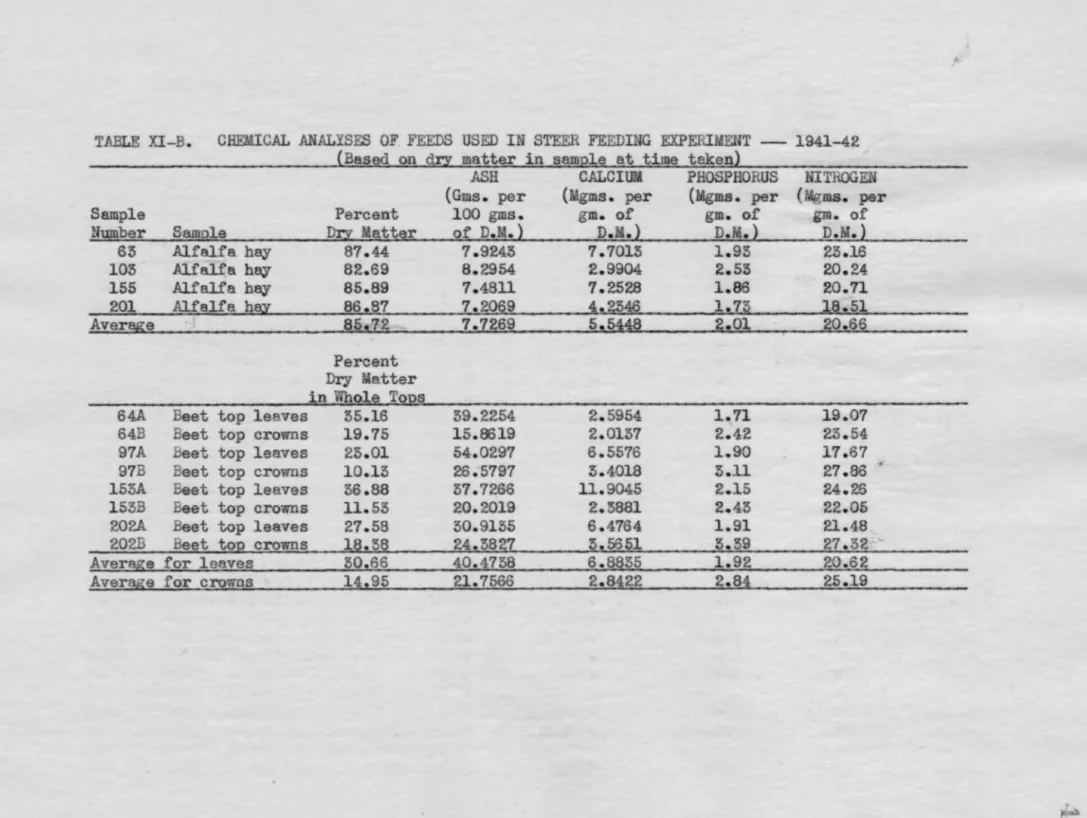
XI-B. CHEMICAL ANALYSES OF FEEDS USED IN STEER FEEDING
EXPERIMENT -- 1941-42•••••••••••••••••••••••••••••• 46 XII . CHEMICAL ANALYSES OF FEEOO AND FECES FROM
DIGESTION-BALANCE TRIALS -- 1941-42 •••••••••••••••••••••••••• 47 XIII . CHEMICAL .ANALYSES OF URINE - 1941-42 •••••••••••••••• 48 XIV. STEER FEEDING EXPERIMENT - 1942-43 •••••••••••••••••• 49 XV. MINERAL INTAKE DURING FEEDING EXPERIMENT - 1942-43 •• 50 XVI . DIGESTION-BALANCE TRIAL I - Feb. 28 - arch 15, 1943 51 XVII. DIGESTION-BALANCE TRIAL II - ay 24 - June 8, 1943 •• 52 XVIII. CHEMICAL ANALYSES OF FEEDS - 1942-43 •••••••••••••••• 53 XIX. CHEMICAL ANALYSES OF FECES AND URINE - 1942-43 •••••• 54
,..-... a , , . . ~
PLATE
Page
i/
INTRODUCTION
During the last few decades, since the time that minerals were found to be essential for adequate nutrition, much work has been done in trying to determine the optimum amounts of each mineral for dif-ferent kinds of animals. It has been shown that calcium and phos-phorus together make up by far the greater part of the boo ash, and this fact has turned the attention of most workers to a study of these two minerals. They have repeatedly shown that gain in weight by steers can be enhanced by adding a calcium and/or phosphorus sup-plement to many common rations. Occasionally, an experiment has shown a disadvantage of adding too much. There must, therefore, be a favorable quantity somewhere between these limits.
The problem of establishing either an optimum amount or ratio of calcium and phosphorus in the steer fattening ration is complicat-ed by several factors. For instance, (1) the calcium and phosphorus in various feeds and supplements are not available to the same ex-tent, (2) there are certain other minerals which hinder the absorp-tion of calcium or phosphorus, (5) under some condiabsorp-tions calcium and phosphorus are precipitated in the digestive tract as insoluble tri-calcium phosphate, (4) vitamin D affects tri-calcium and phosphorus uti-lization, and (5) there are physiological differences in steers which cannot be gauged accurately at the present time.
In addition to the above complications, there is another angle
to the problem apparently overlooked by research workers; that is, the optimum quantity and ratio of calcium and phosphorus may not be
---·
constant for the whole fattening period. From two standpoints, at least, this possibility has promise . First, the feeding period may encompass two phases; the preliminary part being concerned more with promoting growth and the latter part predominantly a fattening pro-cess. Each of these phases might require different amounts of cal-cium and phosphorus. From the second viewpoint, steers are normally taken off a grass pasture and put into the feedlot for fattening, and since grass ordinarily has a high ratio of calcium to phosphorus, it seems possible that the feeding of a ration high in phosphorus would stimulate growth for at least a temporary period.
Therefore, the objects of these experiments have been as fol-lows:
(1) To determine in what respects, if any, the calcium and phosphorus metabolism of the yearling beef steer differs at the be-ginning as compared with the end of the fattening period.
( 2) To determine what effect on gain in weight is induced by altering the a.mounts and ratio of calcium and phosphorus in the ra-tion during the fattening period.
(3) To obtain some indication of the time, manner, and extent of change to which the amounts and ratio of calcium and phosphorus may be subjected with favorable results during the fattening period.
REVIEW OF LITERATURE
The field of literature is well supplied with r ef erences to calcium and phosphorus in livestock nutrition. This review is by no
means compl ete, but is meant to point out some of the work which is more direct ly applicable to t he object of this experiment.
Speaking of an experiment with 18-month-old steers and 15-month-old heifers, Theiler, Du Tait, and Malan (22) stated; "A daily intake
of 19 grams of P2
o
5 of which 53 percent was retained by the steers and of 24 grams of P£05 with a r etention of approximately 63 percent by the heifers provided suff icient phosphorus for normal growth and development while 13 grams and 10 grams were insufficient for the steers and .heifers respectively."Otto (19), working with steers wei ghing1 about 500 pounds, fonnd
that rations containing 16.4 grams of calcium and 8.5 grams of phos-phorus were adequate for growing steers; 12.0 grams of calcium and 5.8 grams of phosphorus and less were insufficient.
Results obtained by Watkins (24), using steers 13 to 18 months old, showed that a daily' intake of 14.7 grams of phosphorus r esulted in uniformly positive balances, but 11"6 grar.1s of calcium and 8.5 grams of phosphorus daily was not enough.
A detailed experiment by Weber, McCampbell, Hughes, and Peter-son (25) also indicated that a f attening calf needs more than 11 gr ams of calcium daily .
,
Schmi dt (20) said; "Growing bovine shoul d receive at least three gr ams of calcium and two gr ams of phosphorus per day for each
100 pounds of body weight. These amounts may be reduced by one-half for cattle approaching maturity . These are minimal amounts and may be greatly exceeded without harr~ as long as these minerals remain r easopa:bly in proporti n.11
An experiment by Beeson, Bolin, and Hickman (2) showed that the
minimum phosphorus requirement for fattening 600 pound steer calves is slightly less than 12 gr ams daily or an intake of about two grams daily per 100 pounds live weight .
Guilbert and Rochford (10) stated; flAbout 0.2 percent of phos-phorus in the dry matter of feeds for young growing cattle appears to be the lower limit for optimum growth of normal bone. The require-ment decreases with maturity, so that about 0.12 percent of phos-phorus in the dry matter suffices for mature cattle if conditions are
favorable for its utilization. 11
Mitchell and McClure (17) said; "For calves growing from 300 to 1000 pounds in weight the average necessary percentages of calcium and phosphorus in the dry ration are , respectively, 0.25 and 0.25 percent for growing beef calves, 0. 29 and 0.25 percent for growing and f attening· beef calves, and 0.19 and 0.22 percent for growing dairy calves. For r ations l ess efficiently utilized with respect to their contents of calcium and phosphorus than
70
percent, these es-timated percentages would be larger.~These reports indic~te that about two grams of phosphorus daily per 100 pounds live weight is adequate for growing and f attening steers, while the smallest amount of calcium shown to be adequate for 500 pound steers is 16.4 grams daily, or approximately t hree
,lN-:,,ri,~H...,._...,_,., _ _ _ _ _ , _ _ _ _ _ _ _ _ _ _ _ _ _ _ _ _ __, _ _ _ _ , _ _ _ _ _ .,.:
grams per 100 pounds live weight .
Regarding the ratio of calcium to phosphorus in the steer fat-tening ration, Morrison (18) said it should be between 1:1 and 2:1, Meynard (15) said between 1:2 and 2:1, while both admitted that ade-quate nutrition was possible outside of these limits.
According to Mitchell and McClure (17), UThe utilization of any given source of dietacy calcium and phosphorus depends upon (a) the
concentration of each in the diet, (b) the ratio of one concentration to the other, (c) the presence or absence of vitamin Din the diet or its equivalent in ultraviolet irradiation, and (d) the rate of food consumption and hence the rate of growth. A failure to control all of these factors may seriously impair the significance of an experi-ment, while the assertion that any one, such as the ratio of calcium to phosphorus , is more important than another is logically absurd.:n
Experiments by Theiler,
nu
Toit, and Malan (22) and by Otto (19) showed that the ratio of calcium to phosphorus became increas-ingly important as the amount of these minerals was reduced. When the ratio of calcium to phosphorus was high, and the amount of phos-phorus insufficient, the steers soon lost their appetite, but re-gained it to some extent later on. However, when the steers were on a low calcium high phosphorus ratio, their appetite was not particu-larly affected and gains were normal .The controversy regarding the availability of calcium and phos-phorus in different mineral supplements can be simplified by accept-ing Maynard's (15) statement: nAssumaccept-ing no harmful substances are present in the supplements and that the animals are in a suitable
physical condition, all may be considered to be of equei value per unit of calcium and phosphorus present • • • While the minerals must be
in solution in order to be absorbed, the factors which determine
solubi lity in the intestine are more important than the f o:rm ingest-ed.lfl
While t he literature thus contains numerous reports on the quan-tity and ratio of calcium and phosphorus for fattening steers, it still leaves the issue in doubt, and surprisingly seems not to con-sider that the amount and r atio might be changed with advantage
dur-ing the f attening period.
MATERil\LS AND 1'J ET HODS
The regular steer f attening experiments conducted by the Animal Investigations Section involved 80 yearling Her eford steers in 1941-42 and 70 in 1942-43 . These steers were selected for uniformity of
size and t ype and most of them C8.Jne from the same ranch each year. From the time of their arrival at the College until the beginning of the experiment, a period of approximately two weeks, they were fed only alfalfa hay, salt, and water. During this time, the steers were
e er-tagged with duplicate numbers , one in each ear, and were t ested by the College Veterinarians for tuberculosis and Bang's disease. Also, th~y were vaccinat ed against blackleg and hemorrhagic septi-cemia.
At the beginning of the experiment, each steer was weighed thre consecutive days and these weights averaged for his initial weight.
During the first day, each steer was graded on his type, condition, and color. Then the steers were allotted, as fairly as possible, in-to lots of 10 steers each. On t he second day, the steers were sort-ed into their proper lots and placsort-ed on feed.
The steers in lots I, II, III, and IV received practically the same rations both years, except for variations in mineral supple-ments. In 1941-42, the steers in lots V and VI r eceived a low level of grain and: hay and were fed beet tops, while in lots VII and VIII, they received a high grain level and less hay. In 1942-45, the steers in lot VI received a high grain level fed in a cut mixture, while lot VII corresponded to the previous year's lot VI . The exact rations which the steers received -are given in appendix tables VII and XIV, but the above serves to show that all variations in gains of the steers c~nnot be attributed directly to different amounts or ratios of calcium and phosphorus in the rations.
For more direct and specific data, blood analyses and digestion-balance trials were used. Blood samples were t aken from the jugular veins of two average steers from each lot at the beginning and at the end of the experiment in 1941-42 and every 30 days during the ex-periment in 1942-45. These samples were analyzed for calcium and phosphorus content. Two digestion-balance trials were·conducted each yeax, one when the steers had reached the feed level at which they were to be maintained and the other near the end of the fattening ex-periment. In 1941-42, each trial extended for a period of 14 days. In 1942-43, each trial cover ed· a period of 22 days , with the first seven days being a preliminary period during which t ime no
..
, ...~.---...:
collection or sampling was done . Six steers were used for each trial
in 1941-42, one averege steer from each o~ lots .I, II, IV, V, VII, and VIII. Only six digestion-balance stalls were available, and it was believed the six lots selected would best represent the whole ex-periment. In 1942-45, four steers were used for each trial, two from lot I, in which the standard ration was fed, and two from lot IV, in which the calcium-phosphorus r atio was altered during the feeding period.
The digestion-balance stalls were constructed in such a manner that a steer, held in place by a stanchion, would stand with his rear feet either on or immediately in front of an iron grill built across an opening in the floor. The feces would drop through this grill, on through a metal chute, and into a pan in the basement. The urine was collected by means of a rubber funnel held in place with a spe-cial harness . To the bottom of the funnel was fastened a rubber tube which led to a carboy in the basement.
Weights were recorded in gra~s for all feeds and water fed and refused, as well as for all urine and feces excreted. Samples were taken daily of urine and feces, and samples of feed and of alfalfa hay and beet tops refused were taken every three days. Much care was used in obtaining representative s amples. The urine and the feces were each collected at the same time every afternoon, each thoroughly mixed, and one-one hundredth by weight of the urine and one-thirtieth by weight of the feces taken as samples. Toluene was added to the urine and chlorofonn was sprinkled on the feces to reduce mold and bacterial action •
.
Analyses were conducted in the chemical laboratories of the
.An-imal Investigations Section. All samples of each feed and feces were made into composites and analyzed by accepted chemical methods for dry matter, ash, calcium, phosphorus, and nitror en. The urine samples were analyzed for all of these except dry matter and were further analyzed for specific gravity and hydrogen-ion concentration. The results thus obtained were applied to the consumption and ex-cretion figures from each digestion-balance trial and the calcium and phosphorus balances for each steer determined .
In 1941-42, sampl es were taken weekly of each feed used in the f attening experiment and composites made of all except wet beet pulp. The samples ~f wet beet pulp were dried each week and analyzed separ-ately . The composite samples of each of the other feeds were brought
in about the middle of the experiment and another group brought in at the end. of the experiment.
All samples, except urine, were reduced to an air-dry basis in a large drier, then ground, and preserved in air-tight glass jars until th~re w s sufficient time to analyze them.
TABLE I. DIGESTION-BALANCE TRIALS - 1941-42
{Figures in terms of grams 2er steer Eer dgz)
DIGESTION-BALANCE Lot I Lot II Lot IV Lot V Lot VII Lot VIII
TRIAL I Steer 49 Steer 44 Steer 45 Steer 79 Steer 58 Steer 48
Jan. 29 - Feb. 111 1942 Ca.
P.
Ca. P. Ca. P. Ca. P. Ca.P.
Ca. P.Ground corn 0.445 6.749 0.686 10.598 0.495 7.474 0.365 5.538 0.649 9.836 0.709 10.749
Cottonseed cake 0.180 2.069 0.241 2.768 0.211 2.421
Wet beet pulp 1.857 0.585 2.4.6 5 0.510 1.253 0.255 3.037 0.629 2.386 0.494 0.667 0.138
Beet tops 7.093 2.928
-.AJ.falfa hay 5.464 3.325 5.868 3.591 4.695 4.159 2.843 '2.851 4.031 3.617 4.569 5.800
Phosilage 12.051
-Bone meal 7 .965 3.767 8.546 . 3.946
Water 0.062 0.001 0.061 0.001 o.080 0.001 0.067 0.001 0:105 0.001 0.100 0.001
AVERAGE DAILY INT.AKE 6 .008 12.529 15.045 18.267 6.501 25.920 15.646 14.715 7.580 16.569 14.197 18.654
Urine 1.404 0.085 4.685 0.100 1.724 9.460 5.274 0.155 1.824 0.552 2.015 0.577
Feces 6 .169 8.674 11.322 12.755 7.596 10.150 16 .688 15. 104 8.272 10.986 10.392 9.402
AVERAGE DAILY OUTPUT 7.573 8.759 16 .007 12.855 9.520 19.610 21.962 15.259 10.096 11.5581
12.407 9.779
AVERA.GE DAILY 13.ALANCE -1.565 3.770 -0.962 5.412 -2.819 4.510 -8.516 1.456 -2.716 5.051 1.790 8.855
DIGESTION-BALANCE Lot I Lot II Lot IV Lot V Lot VII Lot VIII
TRIAL II Steer 49 Steer 44 Steer 45 Steer 79 Steer 58 Steer 48
AEril 12 - AEril 261 1942 Ca.
P.
Ca.P.
Ca.P.
Ca.P.
Ca.P.
Ca.P.
Ground corn 0.356 5.529 0.521 8.560 0.428 7.045 0.598 6.541 0.401 6.600 0.595 9.755
Cottonseed cake 0.155 1.925 0.207 2.604 0.165 2.056
Wet beet pulp 0.452 0.155 0.4.65 0.159 0.556 0.167 1.547 0.463 0.656 0.190 0.575 0.172
Beet tops 4.968 5.518 Alfalfa hay 6.005 ·2.486 6.679 '2.756 6.772 2.789 5.764 1.598 4.686 1.927- 4.924 2.022 Phosilage 7.137 Bone meal 4.298 2.055 Phosphate 16 .175 5.914 Water 0.080 0.001 0.077 0.001 0.104 0.001 0. 079 0.001 0.089 0.001 0.107 0.001
AVERAGE DAILY INTAKE 7.026 10.074 12.040 15.489 7.860 17.159 10.965 14.525 5.975 10.774 2'2.370 17 .864
Urine 0.111 0.659 0.007 0.075 0.255 4.006 0.118 0.095 0.151 1.105 0.151 0.697
Feces 7.f61 8.699 8.556 10.677 2.002 9.492 10.505 9.863 5.712 5.495 6.577 9.600
AVERAGE DAILY OUTPUT 7 .672 . 9.558 8.425 10.752 2.257 15.498 10.621 9.958 3.845 6.600 6.528 10.297
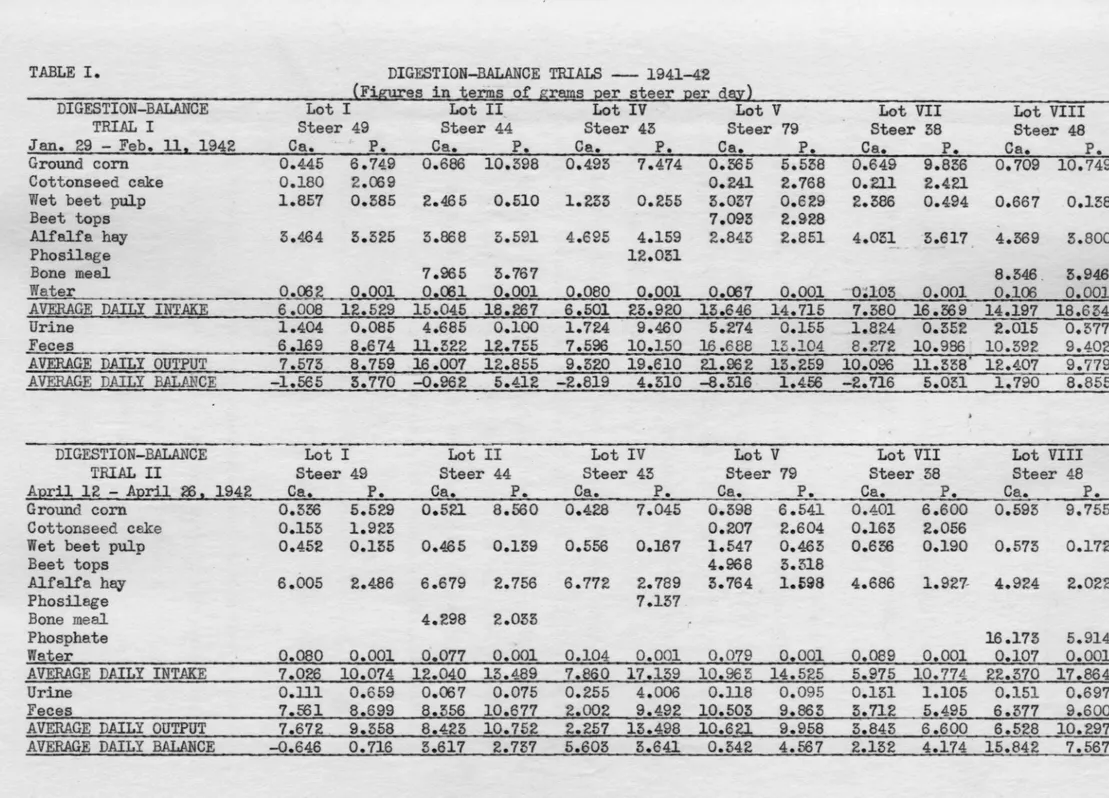
DIGESTION-BALANCE TRIALS -- 1941-42
Each of the digestion-balance trials extended for a period of 14 days . ill figures are in terms of grams, and represent one average day .
In trial I , the average daily calcium intake ranged from 6.008 to 15.045, the output was from 7.573 to 21 . 962, and the balance was negative in all lots but one , ranging from - 8. 316 to 1 .790. The average caily phosphorus intake ranged from 12.529 to 23.920, the output was from 8.759 to 19.610, and t he balance was positive in Ali lots, ranging from 1.456 to 8.855.
In trial II , the average daily calcium intake ranged from 5. 975 to ·22. 570, the output was from 2. 257 to 10.621, and the balance was positive in all lots , with one exception. The average daily phos-phorus intake r anged from 10.074 to 17.864, the output was from 6 .600 to 15. 498 , and the balance was again positive in all lots, though the r etention was not as high, with one exception, as during trial I .
Therefore, the r etention of calcium was greater during trial II than trial I, and the retention of phosphorus was opposite , being greater during trial I.
In trial I , the calcium exqretion seemed to be somewhat depend-ent upon calcium int:1ke, whereas the phosphorus varied considerably.
In trial II, tbe phosphorus excretion w s apparently more dependent upon intake and t he calcium excretion more variable.
The urine, in trial I, w~s much higher in calcium content than
it was in trial II, ranging from 7.5 to 78 . 27 times s much. The urine, with one exception in each case, was higher in calcium than in
phosphorus during trial I and higher in phosphorus than in calcium during trial II.
This calcium and phosi;)horus in the urine must first have been
absorbed f rom the intestines and thus made available for use by the
body . Since calcium was nevertheless thrown off in such rel atively large quantity during digestion_-balance trial I , conducted in the first part o tre fattening feriod, it is suggestive that the body was not in need of additional calcium at that time . However, during trial II , conducted near the end of the fattening period, far less calcium was excret ed in the urine and more was retained in t he body . On the other hand, more phosphorus was retained by five of the six steers during trial I than during trial II. From these f acts , it seems reasonabl e to expect that a calcium suppl ement woul have been more likely to induce a favorable response if added to the r ation
during the latter part of the fattening period, and a pho·sphorus sup-plement i f added during the first part.
TABLE II BLOOD .ANALYSES -- 1941-42
(Mgms. per 100 cc. blood plasma) At Beginning At End of
of Experiment Experiment Difference
Lot Steer Ca..
P.
Ca.P.
Ca.P.
49* 11.66 9.47 7.96 7.59 -5.70 -2.08 I 97 8.14 8!57 8.90 0.55 44* 12.58 10.51 7.95 7.44 -4.45 -5.07 II 75 9.1;2 8.12 8.75 8.17 -0.69 0.05 2 10.10 10.65 6.47 6.75 -5.65 -5.88 III 65 9.34 10161 6160 7.14 -2.74 -5.47 45* 9.,44 9.15 8.25 8.90 -1.19 -0.23 IV 86 10.22 9.16 a.so 12.so -1.z2 5.54 26 9.72 8.29 5.95 6.55 -5.77 -l.94 V 79* 9.94 10.99 6.50 8.17 -5.64 -2.82 11 8.52 10.58 8.40 7.77 -0.12 -2.61 VI 75 8.64 10.Ql 9.40 7.84 0.76 -2.47 10 8.88 8.61 7.95 8.17 -0.95 -0.44 VII 58* 9.01 8.86 6160 8.90 -2.41 0.04 l 10.18 10.18 8.40 6.97 -1.78 -5.21. VIII 48* 9.21 8.75 7.84 -1.57 AveraJ!.e 9.82 9.56 7.67 8.08 -2.14 -1.49
*
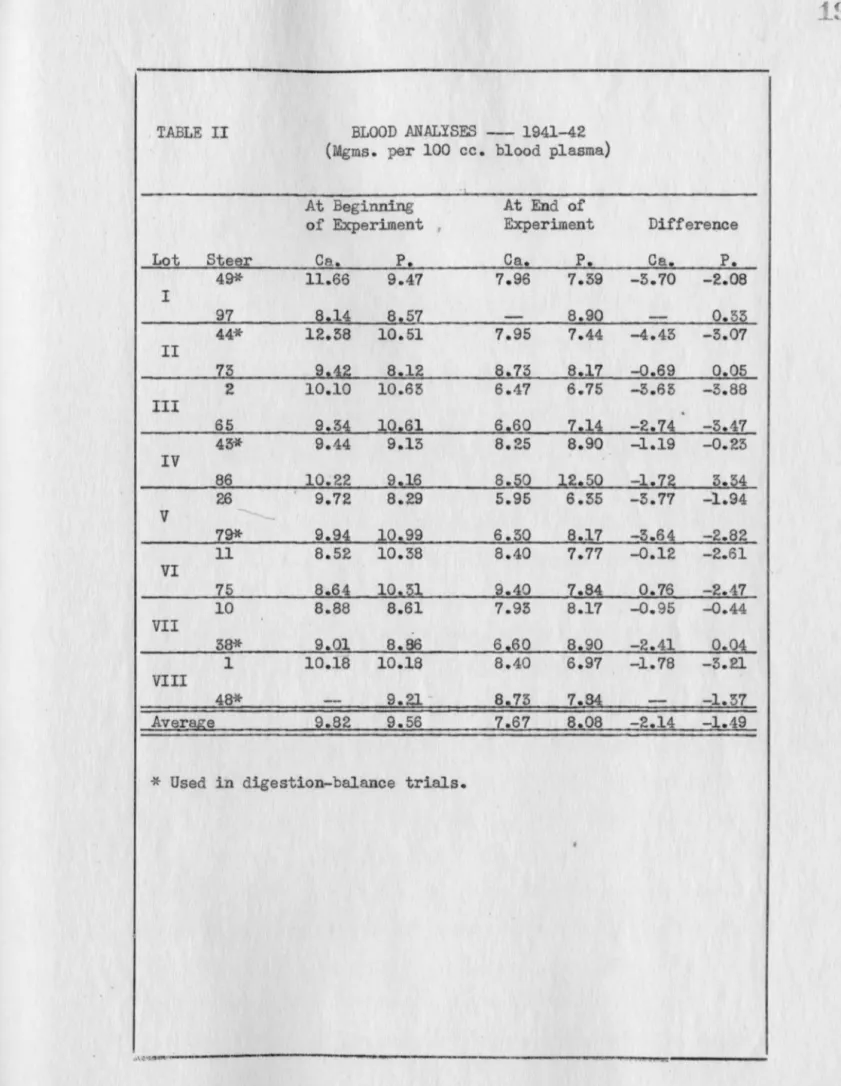
Used in digestion-balance trials •BLOOD ANALYSES -- 1941-42
.Blood samples were taken from the two most representative steers from each of the eight lots at the beginning and t the end of the feeding experiment and analyzed for inorganic calciwn and phosphorus . The figures are expressed in terms of milligrams of calcium and of phosphorus per 100 cubic centimeters of blood plasma.
During the process of analyzing for calcium content, one sample from each of steers 48 and 97 was accidentally destroyed; therefore neither of the other two blood calcium analyses for these steers is included in the averages.
The range in calcium content of blood at the beginnin5 of the experiment was from 8. 52 to 12.38, and the average was 9.82. At the end of the experiment, the range was from 5.95 to 9.40, and the average was 7.67. The difference ranged from a gain of 0.76 to a loss of 4. 43, with the average loss being 2.14.
The phosphorus content of blood at the beginning ranged from 8.12 to 10.99, and the average was 9.56. At the end , it ranged from 6 . 55 to 12.50, Rnt'l the average was 8 .08 . The difference ranged from a gain of 3. 54 to a loss of 3. 88, with the average loss being 1.49 .
Thus, from the beginning to the end of the fattening period, there was a reduction of both calcium and phosphorus in the blood,
though calcium was lost to the gre ter extent . This is in line with
the h;ypothesis that additional calcium would more likely be of benefit during the latter part of the steer fattening period.
The change in tte calcium and phosphorus content of the blood
~-~~.,,,.---·---generally varied in accordance with the max:irnum and minimum amounts of each of these minerals :included in the ration; that is, the steers receiving the most calcium or phosphorus in their r ation (see
appen-dix table VIII) gained the most calcium or phosphorus , respectively, in their blood, while those receiving the least amount of phosphorus
in their r ation lost the most in their blood. The least amount of
calcium intake in the ration, however, did not result in the greatest amount of calcium loss in the blood •
I
TABLE III . STEER GAINS - l94l-42(Figures in terms of daily average per steer)
Lot I Lot IV
Gain Ca.
P.
Ca.-P. Gain Ca. P. Ca.-P.Period (Lbs.} (Grams} (Grams} Ratio (Lbs.} {Grams) (Grams} Ratio
N2v1 lQ - 2Q l5 ll 1.2:1 -0.30 20 ll 1.8:l NQ:£1 2~ - Il~~- Q 1~ 14 1.0:1 B.10 21 15 1.4:1 II~~. - lQ 0.72 15 16 0.9:1 1.10 21 58 0.6:1 D!il~ .. l~ - 2,5 16 16 1.0:1 4.60 22 53 0. 4:1 Dec. 25 - Jan. 2 29 22 1.5:1 2.80 25 51 0.5:1 Jan. 2 - 12 5.61 29 25 1.5:1 0.85 24 59 0. 4:1 Jan. 12 - 22 50 25 l.5:1 2.60 25 fi6 0.4:1 Jan. 22 - Feb. l 29 25 1.5:1 25 55 0.5:1 -Feb. l - ll 2.ll 21 19 1.1:1 5.05 20 51 0.4:l Feb. ll - 21 21 21 1.0:l 2.50 20 55 0~4:l Feb. 21 - Mar. 5 19 2l 0.9:l 1.95 20 56 0.4:l Mar. 5 - 15 2. 52 19 21 0.-9.;l 2.55 20 fi6 0!4:1 Mar. 15 - 25 19 22 0.9:1 5.00 22 57 0.4:1 Mar. 25 - AEril 2 2.50 16 20 0.8:1 1.45 22 57 0.4:1 AEril 2 - 12 1.67 16 19 0.8:1 5.50 22 57 0.4:1 · AEril 12 - 22 15 17 0.9:1 15 51 0.5:1 AEril 22 - M~ 2 1.61 15 18 0.8:l o.a8 15 53 0.5:1 Mey 2 - 12 2.11 15 19 0.8:1 1.85 14 55 0.5:1 1 Mey 12 - 22 2.70 15 19 0.8:1 1.55 15 55 0.5:1 • V
STEER GAINS - 1941-42
One steer was r e,r,oved from lot I on March 28, and corrections were made up t o that time for feed consumed and weight gained. Be-cause of this , the average daily geins of the remaining nine steers could only be calculated from t he individual weights taken every 30 days . No weights were taken during the digestion-balance trials .
The calcium-phosphorus r atio in lot I varied somewhat during the early part of the feeding period while the steers were getting ad-justed to their feed , but from that time until the end of the experi-ment the ratio gradually decreased. There was hardly enough vari-ation in the r atio, however, to materially affect the rate of gain.
In lot IV, the calcium-phosphorus r atio was r ather quickly re-duced from 1 . 8:1 to 0. 4:1 . This change was effected by mixing phos-ilage, a rather concentrated supplement similar to phosphoric acid, in with t he wet beet pulp. In t he second 10-day period following the addition of phosil age to the r ation, the steers gained more weight than was gained by any other lot of steers during any 10-day period
of the experiment . They continued to gain well until sometime be-tween April 12 and May 2, when the final digestion-balance trial and a lowered calcium-phos_horus r atio of 0. 3:l together apparently de-pr essed the r ate of gain.
These results indicate that the steers in lot IV were stimulated by the phosphorus supplement early in the feeding period, and might have made better gains during the latter part had the amount of phos-phorus been reduced, or a caJ.cium supplement added, or both •
...,,,
___________________________
__,,....,,..,,..,,_____
RESULTS OF 1941-42 EXPERIMENT
When phosil8.f,e, a r ather concentrated phosphorus supplement, was added to the ration of one lot of steers ear]y in the feeding exper-iment, these steers gained rapidly enough within two weeks to out-weigh the steers in any other lot, and maintained this lead for an-other two weeks .
During digestion-balance trial I, conducted early in the feeding experiment, the urine from each of the six steers used was from 7.5 to 78 times as high in calcium as it was from the same steers during digestion-balance trial II, conducted near the end of the feeding ex-periment, though the average daily intake of calcium was comparable for each steer in both trials .
The average daily calcium balance was negative, with one except-ion, in trial I and positive, with one. exception, in trial II.
The retention of phosphorus was higher during trial I than dur-ing trial II , with one exception .
In trial I , the excretion of calcium tended to be roughly in proportion to its intake, whereas the phosphorus varied considerably . In trial II, the phosphorus excretion was apparently more dependent upon intake and the calcium more variable.
Blood analyses at t he beginning and end of the fattening experi-ment showed the inorganic calcium and phosphorus contents reduced an average of 2.14 end 1.49 milligrams , respectively, per 100 cubic centimeters of blood plasma.
Within a month after phosilage was added to their r tion, the
steers in lot IV developed a luster and sheen to their hair coat not evidenced by the steers in any other lot, and they retained this ap-pearance for the remainder of the fattening experiment.
Although incidental, there was a distinct variation in the con-dition of the livers of those steers receiving phosilage compared with those not receiving it. Liver flukes caused condemnation of two livers in the lot receiving phosil age and from five to nine liv-ers in each of the other seven lots; telangiectasis caused
condemna-tion of six livers in the. lot receiving phosilage and from none to two livers in each of the other lots .
---l
TABLE IV. . DIGESTION-B.ALMWE TRI.ALS--1942-45 (Figures in terms of grams per steer per da..y)DIGESTION-BALANCE Lot I Lot I Lot IV Lot IV
TRI.AL I Steer 52 Steer 22 Steer 8 Steer 55
Feb. 28 - March 151 1945 Ca.
P.
Ca.P.
Ca.. P.
Ca.P.
Ground corn 0.705 9.027 0.702 9.015 0.767 9.851 0.762 9.781
Cottonseed cake 0.508 2.879 0.506 2.865
Wet beet pulp 1.625 0.126 1.741 0.155 1.725 0.154 1.705 0.155
Alfalfa hay 14.547 5.957 19.796 5.512 19.255 5,.556 18.454 5.105
Phosilage
-
29.148 28.995Water 0.087 0.001 0.102 0.001 0.110 0.001
o.oao
0.001AVERAGE DAILY INTAKE 17.270 15.970 22.647 17 .5'28 21.855 44.490 21.001 44.015
Urine 0.059 2.577 0.407 0.069 0.205 5.l21 0.125 14.412
Feces 10.444 6.787 10.644 7.042 9.675 15.857 10.455 ll.1'25
AVERAGE DAILY OUTPUT 10.505 9.564 ll.051 7.lll 9.878 · 18.978 10.578 '25.557 AVERAGE DAILY BALANCE 6 .767 6 ."606 ll.596 10.417 ll.957 25.512 10.425 18.476
DIGESTION-BALANCE Lot I Lot I Lot IV Lot IV
TRI.AL II Steer 52 Steer 22 Steer 8 Steer 55
May 24 - June 81 1945 Ca. P. Ca. P. Ca. P. Ca.
P.
Ground corn 0.819 17 .569 0.915 19.552 0.901 19.102 0.767 16.257 Cottonseed cake 9.276 2.767 0.278 2.795
Wet beet pulp 1.805 0.268 2.175 0.525 1.881 0.279 2.098 0.512
.Alfalfa hay 10.455 2.655 15.602 5.216 14.476 5.552 11.908 2.870
Phosilage 8.556 9.'597
Calcium carbonate 8.251 9.'251
Water O.lll 0.001 0.111 0.001 0.158 0.001 0.105 0.001
AVERAGE DAILY INT.AKE 15.446 25.040 17.079 25.687 25.647 51.290 24.127 29.057
Urine 0.086 .J....104 0.560 0.086 0.554 0.099 0.049 4.795
Feces 8.887 7.551 8.215 7.975 18.686 16.518 15.510 7.507
AVERAGE DAILY OUTPUT 8.975 8.655 8.575 .8.059 19.220 1.6.417 15.559 12.102
DIGESTION-BALANCE TRIALS - 1942-43
In lot I , during trial I , t he intake of calcium and phosphorus was in a ratio of approximately 1 :1 and the retention also 1:1; in trial II, the intake was near 1: 2 and 1:1 . 5 for each steer, respec-tively , and the retention 1:3 and 1:2.
In lot IV, during trial I , the intake was about 1: 2 and the re-tention 1 : 2; during trial II, the intake was almost 1 :1 and the re-tention 1:2 and 1:1 . 5 for each steer.
In lot I, the calcium intake and retention were greater during trial I than during trial II; in lot IV, the calcium intake was less during the first trial , yet the calcium retention was greater for one steer and approximately the same f or the other.
In lot I , the phosphorus intake and retention were less during trial I , while in lot IV, they were greater.
The amount of calcium excreted in the urine was about the same during each trial; the amount of phosphorus in the urine was gener-ally less during trial II.
The retention of calcium and phosphorus in lot I varied in the same direction and almost to the same extent as the intake of each of these minerals. A somewhat similar variation in the phosphorus retention occurred in lot IV, but the calcium retention apparently was not dependent upon intake.
Since the calcium carbonate supplement had been introduced into the ration of lot IV only a mo~th previous to balance trial II , it is possible the steers had not completely adjusted themselves to
this increased calcium intake and were still not efficiently utiliz-ing all of it.
The r esults of these two digestion-balance trials indicate that the retention of calcium and phosphorus varied in accordance with the amount of each of these minerals consumed, provi ded the steers had sufficient time to adjust t hemselves to any changes in the ra-tion.
TABLE V.
BLOOD ANALYSES - 1942-43 (Mgms . per 100 cc. blood plasma)Calcium
Lot Steer 12L2B 1L22 2L21 BL25 4222 5Z22 6Z21 Gain
22* 6.20 6.47 8.26 6.88 7.60 ll.22 11.02 4.82
I
52* 6.08 6.54 8.04 7.40 7.98 9.18 25 6.00 8.82 9.62 8.50 7.80 ll.80 10.02 4.02II
54 6.40 6.47 6.54 8.84 7.80 9.04 8.54 1.94 14 6.80 12.55 10.20 7.26a.oo
12.26 10.06 5.26III
82 7.40 10.00 8.46 5.42 7.40 ll.58 10.22 2.82 55* 7.60 7.06 5.46 6.62 7.80 6.90 9.80 2.20IV
za
7.20 4.42 8.66 8.80 14.66 10.58 5.18 50 5.80 15.92 6.92 8,.08 10.00 13.96 8.64 2.84V
55 7.20 10.59 10.58 7.70 10.10 15.20 9.52 2.52 4 7.40 6.67 6.74 8.66a.so
ll.42 8.10 0.70VI
21 6.60 4.80 7.42 7.60 15.52 10.60 4.00 l 6.60 8.82 6.54 6.96 8.60 9.58 8.84 2.24VII
48 6 . 20 8.65 8.46 a.so 9.80 9.56 8.68 2.48 Average 6!72 8.8i 7.24 7.67 8.41 11.16 9.55 2.81 Phos:ghorusLot Steer 12Z25 1222 2Z21 5z25 4222 5222 6Z21 Gain
22* 4.56 7.18 7.74 8.72 7.58 7.00 2.64
I
52"* 5.69 6.90 4.56 8.56 6.68 8.12 8.74 5.05 25 5.98 8.62 9.06 7.90 9.14 9.42 5.44II
5~ 6.;i5 7.59 8.02 8.98 7.58 7.48 8.60 2.07 14 6.55 6.59 7.44 7.48 8.12 5.84 8.48 1.95III ag
6.42 8.17 9.26 6.56 9.56 7.58 0.96 55* 6.96 7.65 9.20 9.80 9.14 7.28 8.60 1.64IV
1e
6.27 4!35 10.20 9.44 8.00 7.48 1.21 50 5.99 4.28 6.44 7.20 8.24 7.28 7.06 1.07V
55 5.76 4.08 5.44 6 .20 7.58 6.60 9.00 5.24 4 7.16 8.72 8.24 8.70 5.84 8.60 8.24 1.08VI
21 4.59 8.86 7.00 9.54 z.s8 7.20 9.00 4.41 l 7.27 5.65 9.26 7.90 5.78 7.90 0.65VII
8.15 4.67 5.26 9.56 7.00 7.28 8.86 0.71 Average 6.26 6.65 6,82 8.67 7.75 7.54 8.27 2.01 * Used in digestion-balance trials.BLOOD ANALYSES - 1942-43
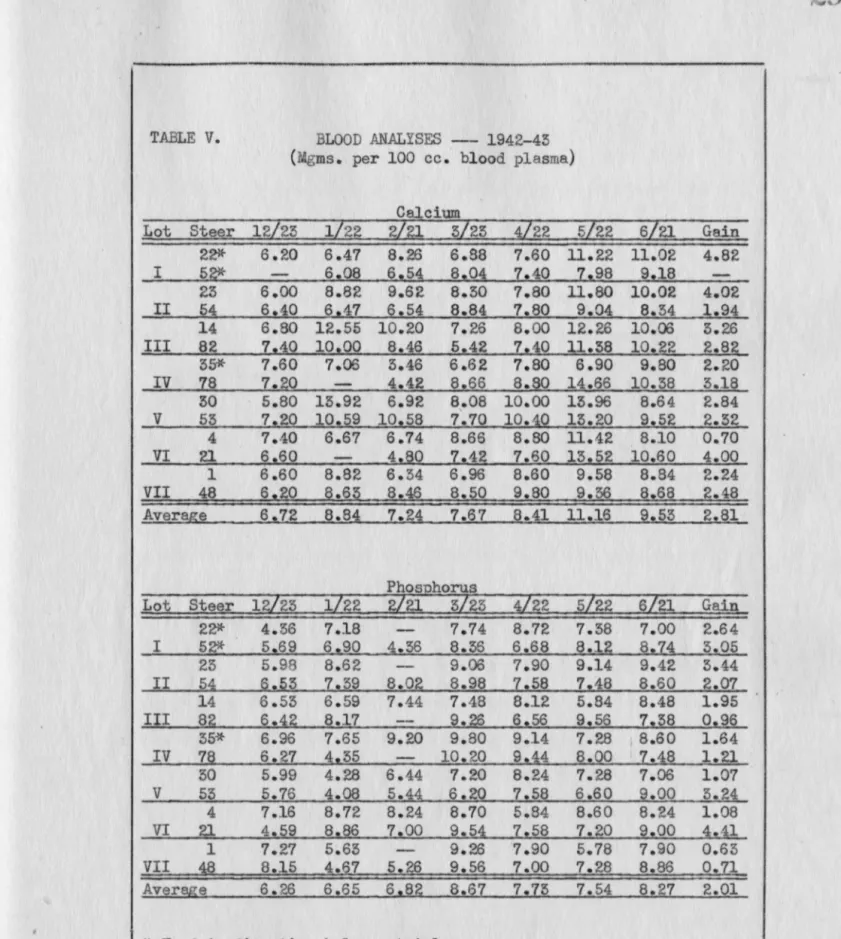
Blood samples were taken from two average steers from each of the seven lots every 30 days during the feeding period and analyzed for inorganic calcium and phosphorus.
The range in calcium content at the beginning of the feeding pe-riod was from 5. 80 to 7.60 milligrams per 100 cubic centimeters of blood plasma, and the average was 6 . 72. At the end of the experiment the range was from 8.10 to 11. 02, and the average was 9. 53 . The gain 1n calcium content ranged from 0.70 to 4. 82, with an average of 2. 81.
The phosphorus content at the beginning ranged from 4. 36 to 8 .15, and the average was 6. 26 . At the end, it ranged from 7.00 to 9.42, and the average was 8. 27. The gain in phosphorus content rang-ed from 0.63 to 4. 41, and t he average was 2. 01.
From the beginning to the end of the feeding period, there was an increase in the calcium and phosphorus content of the blood of every steer from which sampl es were taken . The average gain was somewhat gr eater for calcium than for phosphorus .
These results differ from those of the previous year in which
there -was a loss in calcium and phosphorus content in the blood. However, at the beginning of the feeding period in 1941, analyses showed the blood pl asma to contain an average of 9. 82 milligrams of calcium and 9. 56 _ illigr~us of phosphorus per 100 cubic centimeters, compared with 6. 72 and 6. 26 , respectively , at the beginning of the experiment in 1942. This difference, more than three milligrams for each mineral, represents the larger part of the variation.
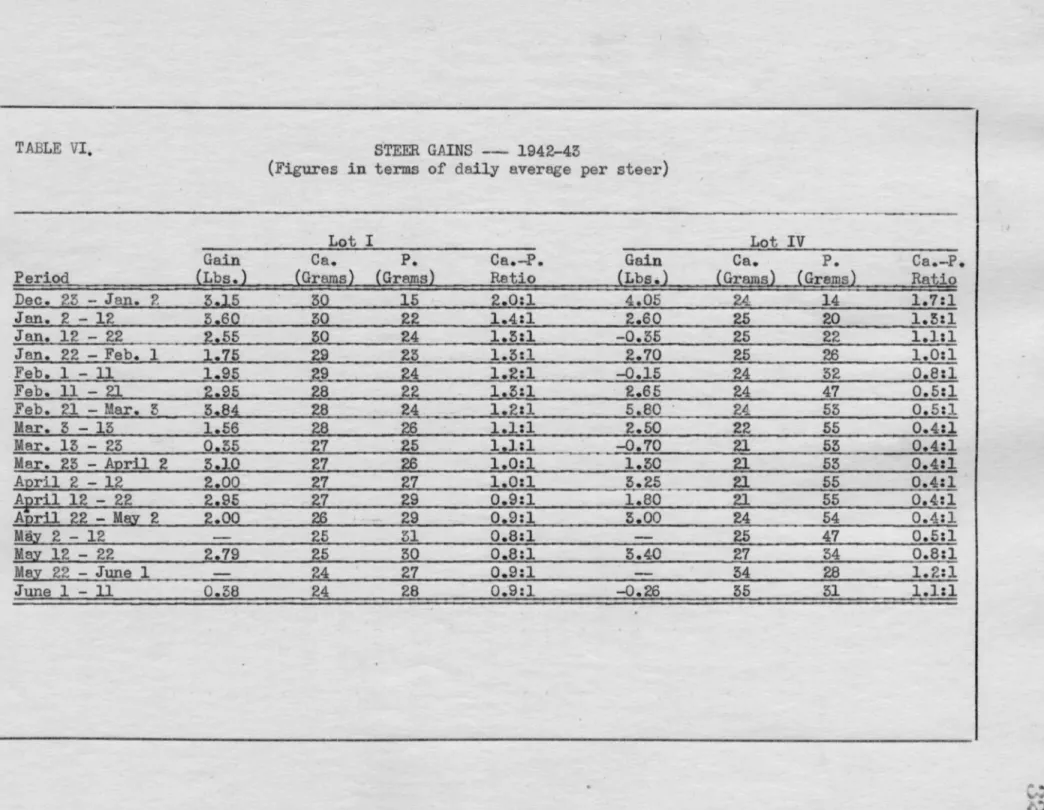
PLATE I. 11 00 107 1050 1025 1000 915 950 925 175 850 a: l&I l&I .... 1/) a: w Cl. .... J: l&I l&I (!) <( a: l&I > <( STEER GAINS---1942-43 ---
-KEY-LOT I LOT II LOT ur
L.OTIV L.OTV L.OT VI L.OT VII
:::
-J
Period of phosphorus increase in ration of lot IV.
Period of calcium increase and phosphorus decrease in ration of lot IV.
TABLE VI. S°TEER GAINS -- 1942-43
(Figures in terms of daily average per steer)
Lot I Lot IV
Gain Ca.
P.
Ca.-P. Gain Ca. P. Ca.-P.Period (Lbs.) (Grams) (Grams} Ratio (Lbs.) (Grams) (Grams) Ratio
Dec. 23 - Jan. 2 3.J.5 30 15 2.0:l 4.05 24. 14 1.7:1 Jan. 2 - 12 3160 BO 22 1.4:l · .2.60 25 20 l.B:l Jan. 12 - 22 Z155
~o
24 1.5:1 -0.35 25 22 1.1:l Jan. 22 - Feb. 1 1.75 29 2B l.B:l 2.70 25 26 1.0:1 Feb. 1 - 11 1.95 29 24 1.2:l -0.15 24 32 0.8:1 Feb. 11 - 21 ~-95 28 22 1.3:l 2.65 24 47 o.5:1 Feb. 21 - Mar. 3 3184 28 24 1.2:1 5.80 24 SB 0.5:1 Mar. 3 - 13 1.56 28 26 1.1:l 2.50 22 55 0.4:l Mar. 13 - 23 0155 27 25 1.1:l -0.10 21 53 0.4:1 Mar. 23 - A:E!ril 2 3.1.0 27 26 1.0:l 1.30 21 53 0.4:1 A12ril. 2 - 12 2.00 27 27 1.0:l 3.25 21 55 0.4:1 April 12 - 22 2.95 27 29 0.9:1 1.80 21 55 0.4:1 A~ril 22 - M~ 2 2.00 26 29 0.9:l 3.00 24 54 0.4:1 May 2 - 12 25 31 0.8:1 25 47 0.5:1 M~ 12 - 22 2.79 25 30 0.8:l 3.40 27 54 0.8:l Ma.-y: 22 - June 1 24 27 0.9:1 34 28 1.2:1 June 1 - 11 0.38 24 28 0.9:1 -0.26 35 31 1.1:1STEER GAINS -- 1942-45
The r ate of gain of the steers in lot IV was rather erratic, both before and during the time that phosilage was included in their ration. This condition probably was caused l argely by the fact that three of the steers were extremely nervous, retreated to t he farther-est corner of the lot when visitors approached, and kept the entire lot upset during a large part of the experiment • .All of the steers were nervous during the time of allotment, not being accustomed to
close handling, and it was merely an unfortunate coincidence that three of the wildest steers happened to be put into the s ame lot.
On January 23, phosilage was added to the r ation of t he steers in lot IV at the r ate of 10 milliliters per steer per day . This was increased to 25 milliliters in 10 days and to 75 milliliters in 22 days. Immediately following the increase of phosilage to 75 milli-'liters on February 14, the steers made a greatly increased r ate of
gain for the next 50 days, including one 10-day period in which t heir gain was gr eater than that made by any other lot of steers during any 10-day period of the experiment . From February 14 to May 2, a period of 78 days during which each steer received 75 milliliter,s
per day , the ratio of calcium to phosphorus was approximat ely 0.4:1,
and the rate of gain was very good, with t he exception of one 10-day period.
On April 23 , ll.3 grams of calcium carbonate per steer was add-ed to the ration. This amount was increasadd-ed by an additional 11.3 grams each of two following 10-day periods, and then 22.6 grams
extra were added on May 25, bringing the total amount per steer per day to 56.7 grams . While the calcium carbonate was being increased, the phosilage was being decreased. On May 5, the phosilage was re-duced to 50 m.:Uliliters per steer per day; on Mey 15, to 25 milli-liters; and on Mey 25, to 10 milliliters. From May 25 until July 6, when the steers were shipped to market, the ration contained 57.6 grams of calcium carbonate and 10 milliliters of phosilage; the cal-cium-phosphorus ratio was 1.1:1.
While the calcium-phosphorus ratio was changed from 0.4:l on April 23 to 1.2:l on May 23, the steers made exceptionally good gains of better than three pounds per steer per day, which was better than that made by aizy other lot of steers during this period. This rate
of gain was interrupted by a digestion-balance trial from
Mey
17 to Junea,
causing the steers to lose weight. Had the steers been able to maintain their rate of gain uninterrupted for 20 more days, they would have had a totf½ gain exceeded by only the lot of steersre-ceiving a high grain level.
These results indicate that the steers were stimulated totem-porarily greater gains by the addition of phosilage to the ration during the f irst part of the feeding period and by the addition of calcium carbonate, together with'the reduction of phosilage, during the latter part.
,;..,.r ... ~ - - - · - - - -- -- - - _ , . , . . . , . . . , . . , _, _ _ _ _ __;
RESULTS OF 1942-43 EXPERIMENT
In the fourth 10-day period following the addition of phosilage to their r ation early in the feeding period, the steers in lot IV gained more weight than was gained by any other lot of steers in any 10-day period in the experiment.
Immediately after the addition of calcium carbonate and the re-duction of phosilage in their ration late in the feeding period, the steers in lot IV gained an average of more than three pounds per stee~ per day for a month.
During the digestion-balance trials, the retention of calcium and phosphorus in lot I varied in the same direction and almost to the same extent as the intake of each of these minerals. A somewhat similar variation in the phosphorus retention occurred in lot IV, but the calcium retention apparently was not dependent upon intake .
From the beginning to the end of the feeding period, there was
an increase in the inorganic calcium .and phosphorus content of the blood of every one of the 14 steers from which samples were taken. The gain in calcium content ranged from 0.70 to 4. 82 milligrams per 100 cubic centimeters of blood plasma, with an average of 2.81; gain in phosphorus ranged from 0.65 to 4. 41, with an average of 2.01.
The steers in lot IV developed a glossy hair coat within a month after phosilage was added to their ration and maintained this appear-ance well into the summer, until the amount of phosilage in their ration was reduced from 75 to 10 milliliters per steer per day •
..-:.::-rr"#•,... _ _ __ _ _ _ _ _ _ _ _ _ _ _ _ __ _ _ _ _ _ _ _ ..,,.,,...,,.,... _ _ _ _
SIDAMARY
Two feeding experiments were conducted, using eight lots of 10 yearling Hereford steers each in 1941-42 and seven similar lots in 1942-43.
Two digestion-balance trials were conducted each year, one in the first part of the feeding period and the other in the latter part. In 1941-42, each trial was for a period of 14 days and one steer from each of six lots was used; in 1942-43, each trial extended 22 days and two steers from each of two lots were used.
Blood samples were taken from two average steers in each lot at
the beginning and at the end of the feeding period in 1941- 42 and
every 30 days during the experiment in 1942-43 . These samples were
analyzed for inorganic calcium and phosphorus .
In 1941-42, one lot of steers made temporarily accelerated gains following the addition of phosilage, a rather concentreted phosphorus supplement, to their ration early in the feeding period; the steers used in digestion-balance trials retain8d more phosphorus during
trial I and more calcium during trial II; and there was an average loss in both calcium and phosphorus content of the blood from the beginning to the end of the experiment, calcium being decreased more than phosphorus .
In 1942-43, t emporarily greater gains followed the addition of phosilage to the ration of one lot of steers early in the feeding pe-riod, and also followed the addition of calcium carbonate and reduc-tion of phosilage l ate in the experiment; in the digestion-balance
...
---
...
---~
trials, the retention of calcium and phosphorus tended to vary in
accordance with the amount of each of these minerals included in the ration; and there was an increase from the beginning to the end of the feedin period of both calcium and phosphorus in the blood of all steers from which samples were taken.
--·---
-- - --- ---...;
CONCLUSIONS
In two consecutive years, there was a temporarily accelerated rate of gain made by one lot of steers soon after the addition of phosilage to their ration early in the feeding period.
The steers receiv::µig phosilage were apparently stimulated to temporarily greater gains by the addition of calcium carbonate and reduction of phosilage in their ratien late in the feeding period.
The digestinn-balance trials and blood analyses in the first year' s experiment indicated that a phosphorus supplement would be more likely to induce a favorable response if added to the ration during the first part of the feeding period and a calcium supplement if added during the latter part.
Within a month after the addition of phosilage to their ration, the steers developed a glossy hair coat which persisted for the dur-ation of the experiment in the first year and until the amount of phosilage was reduced from 75 to 10 milliliters per steer per day in the second year.
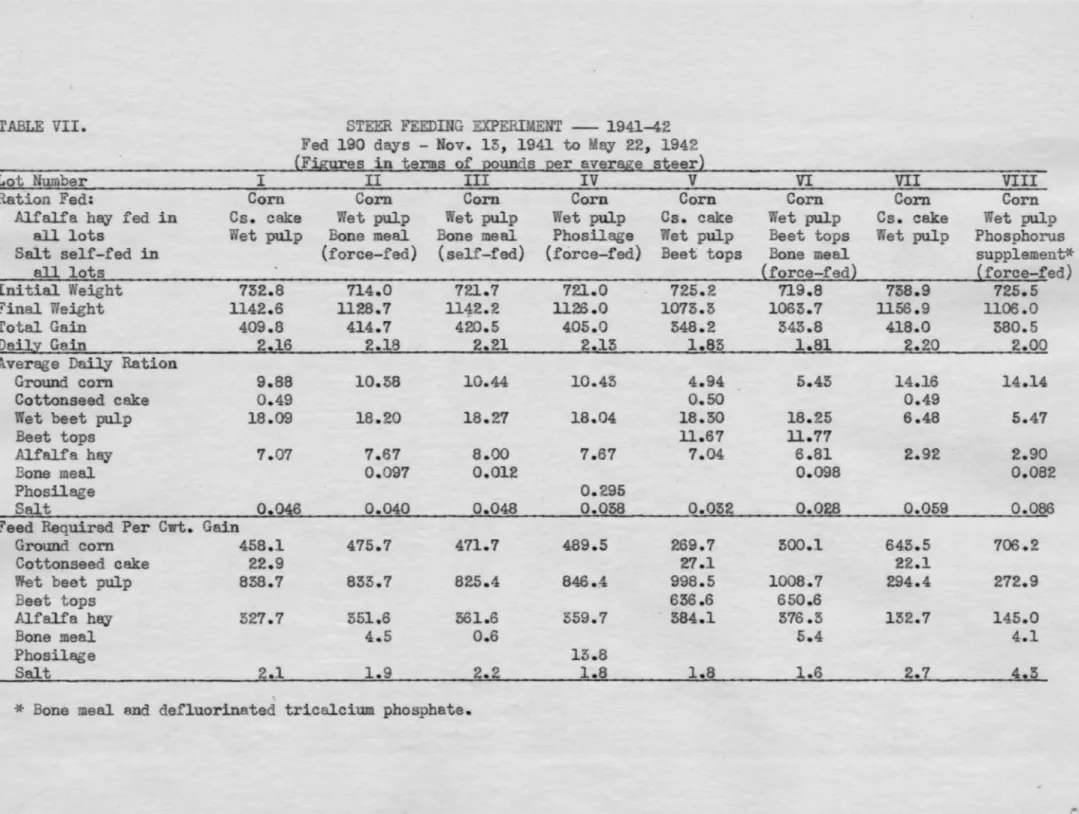
TABLE VII. STEER FEEDillG EXPERIMENT - 1941-42 Fed 190 days - Nov. 15, 1941 to May 22, 1942 (FiJrures in terms of 2ounds 2er aver§.l?;e steer}
Lot Number I II III IV V VI VII VIII
Ration Fed: Corn Corn Corn Corn Corn Corn Corn Corn
Alfalfa hay fed in Cs. cake Wet pulp Wet pulp Wet pulp Cs. cake Wet pulp Cs. cake Wet pulp
all lots Wet pulp Bone meal Bone meal Phosilage Wet pulp Beet tops Wet pulp Phosphorus
Salt self-fed in (force-fed) (self-fed) (force-fed) Beet tops Bone meal supplement*
all lots (force-fed) (force-fed)
Initial Weight 752.8 714.0 721.7 721.0 725.2 719.8 758.9 725.5
Final Weight ll42.6 1128.7 1112.2 1126.0 1075.5 1065.7 1156.9 ll06.0
Total Gain 409.8 414.7 420.5 405.0 548.2 543.8 418.0 580.5
Daill Gain 2.16 2.18 2.21 2.15 1.85 1.81 2.20 2.00
Average Daily Ration
Ground corn 9.88 10.58 10.44 10.43 4.94 5.43 14.16 14.14
Cottonseed cake 0.49 0.50 0.49
Wet beet pulp 18.09 18.20 18.27 18.04 18.50 18.25 6.48 5.47
Beet tops 11.67 ll.77
Alfalfa hay 7.07 7.67 8.00 7.67 7.04 6.81 2.92 2.90
Bone meal 0.097 0.012 0.098 0.082
Phosilage 0.295
Salt 0.046 0.040 0.048 0.058 0.032 0.028 0.059 0.086
Feed Required Per Cwt. Gain
Ground corn 458.1 475.7 471.7 489.5 269.7 300.1 645.5 706.2
Cottonseed cake 22.9 27.1 22.1
Wet beet pulp 838.7 833.7 825.4 846.4 998.5 1008.7 294.4 272.9
Beet tops 656.6 650.6
Alfalfa hay 527.7 551.6 361.6 359 .7 584.1 576 .5 132.7 145.0
Bone meal 4.5 0.6 5.4 4.1
Phosilage 15.8
Salt 2.1 1.9 2.2 1.8 1.8 1.6 2.7 4.5
*Bonemeal and defluorinated tricalcium phosphate.
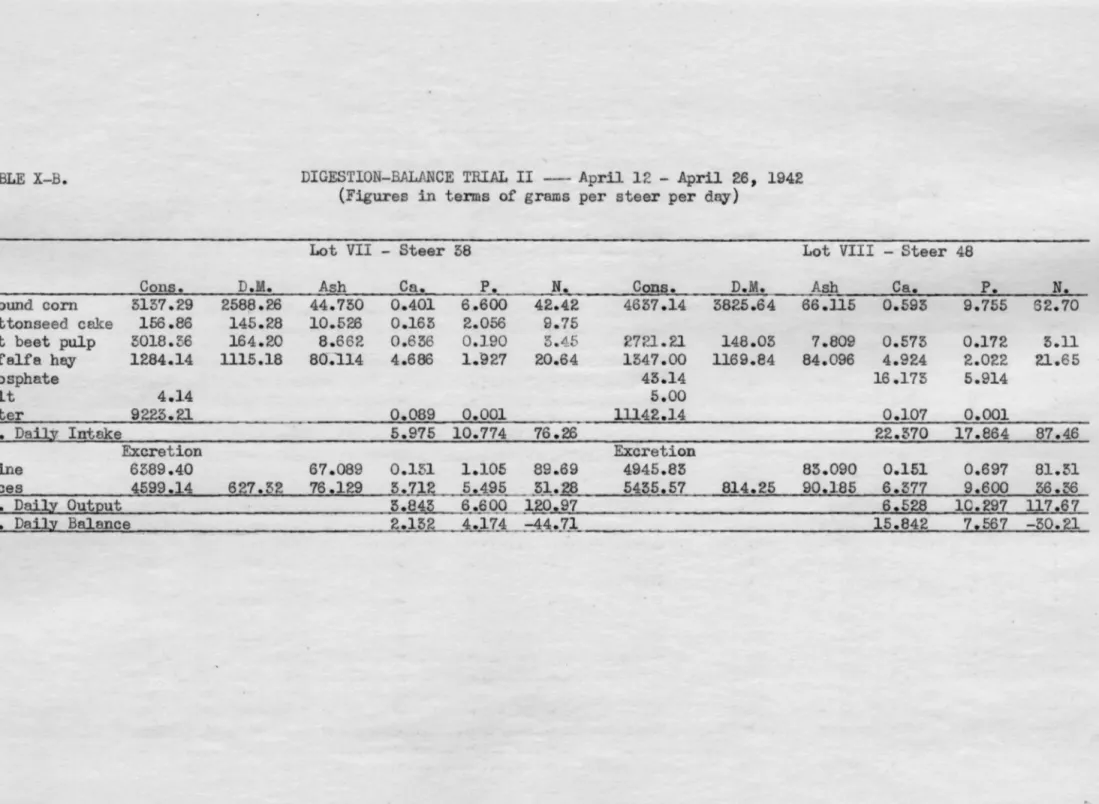
trials, the retention of calcium and phosphorus tended to vary in
accordance with the amount of each of these minerals included in the r ation; and there was an increase from the beginning to the end of the feedin period of both calcium and phosphorus in the blood of all steers from which samples were t aken.
Jl:u~ff- --- ---...;
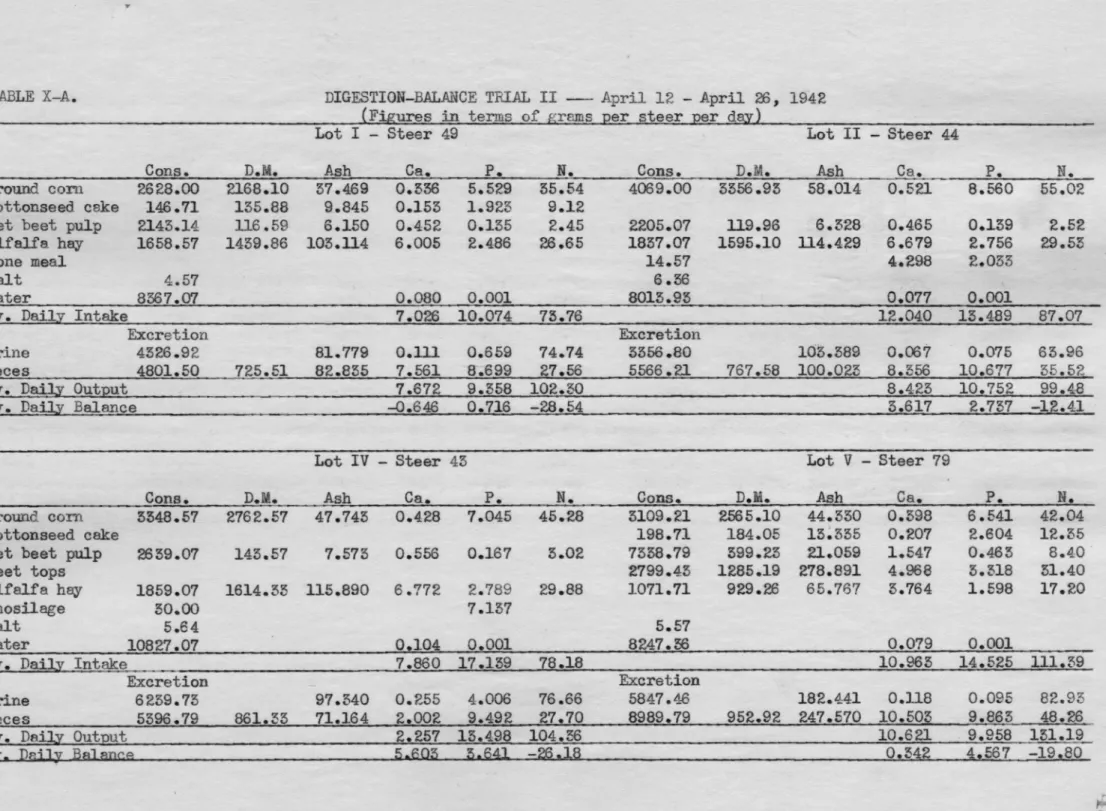
TABLE IX-A. DIGESTION-BALANCE TRIAL I - Jan. 29 - Feb. ll, 1942 (Figures in terms of grams Qer steer Qer d~}
Lot I - Steer 49 Lot II - Steer 44
Cons. D.M. -- Ash Ca.
P.
N. Cons. D.M. Ash Ca.P.
N.Ground corn 2826
.so
2576 .52 58.780 0.44.5 6.749 41.90 4554.50 3661.26 59.744 0.686 10.598 64.55 Cottonseed cake 145.95 152.47 9.426 0.180 2.069 9.44Wet beet pulp 5501.36 556 .09 16.149 1.857 0. 585 8.85 4647 .57 472.66 21.456 2.4.-65 0.510 11.72 Alfalfa hay 1515.45 1271.56 106.894 3.~64 3.325 25.74 1655.29 1585.05 116.040 3.868 3.591 28.05
Bone meal 27.00 7.965 3.767
Salt 6.43 6.43
Water 6418.29 0.062 0.001 6394.43 0.001 0.001
Av. DailJ'.: Intake 6.008 12.529 85.91 15.045 18.267 104.30
Excretion Excretion
Urine 5409.08 81.477 1.404 0.085 66.45 2992.58 91.872 4.685 0.100 60.ll
Feces 5191.86 741.4.0 77.221 6.169 8.674. 26.36 6959.93 1067.36 100.480 ll.522 12.755 45.06
Av. Daily Out:Qut 7.575 8.759 92.81 16.007 12.855 105.17
Av. Daily Balance -1.565 3.770 -6.90 -0.962 5.412 -0.87
Lot IV - Steer 43 Lot V - Steer 79
Cons. D.M. Ash Ca.
P.
N. Cons. D. ~. Ash Ca.P.
N.Ground corn 5130.00 2631. 70 42.94.4 0.493 7.474 55.18 2519.36 1950.12 31.822 0.365 5.538 34.58
Cottonseed cake 192.57 177.24 12.612 0.24.1 2.768 12.63
Wet beet pulp 2325.14. 236 .47 10.724 1.233 0.255 5.86 5727.57 582.49 26 .417 3.037 0.629 14. 4.5
Beet tops 3800.71 1198.59 491.099 7.095 2.928 25.47
Alfalfa hay 1952.-14 1623. 75 135.366 4.695 4.159 32.86 1277 .29 1078.95 91.098 2.843 2.851 21.84
Pbosilage 50.57 12.031
Salt 6.43 6.43
Water 8550.64 0.080 0.001 6985.07 0.007 0.001
Av. Dej)y Intake 6.501 25.920 93.90 13.646 14.715 108.77
Excretion Excretion
Urine 5579.67 lll.593 1.724 9.460 68.29 5792.25 187.668 5.274 0.155 68.69
Feces 5972. 21 885.68 80.996 7.596 10.150 31.86 8357.43 1554.4.8 420.936 16 .688 13.104 48.97
Av. Dail;y: Out:12ut 9.5gO 19!610 100.15 21.962 13.259 117.66
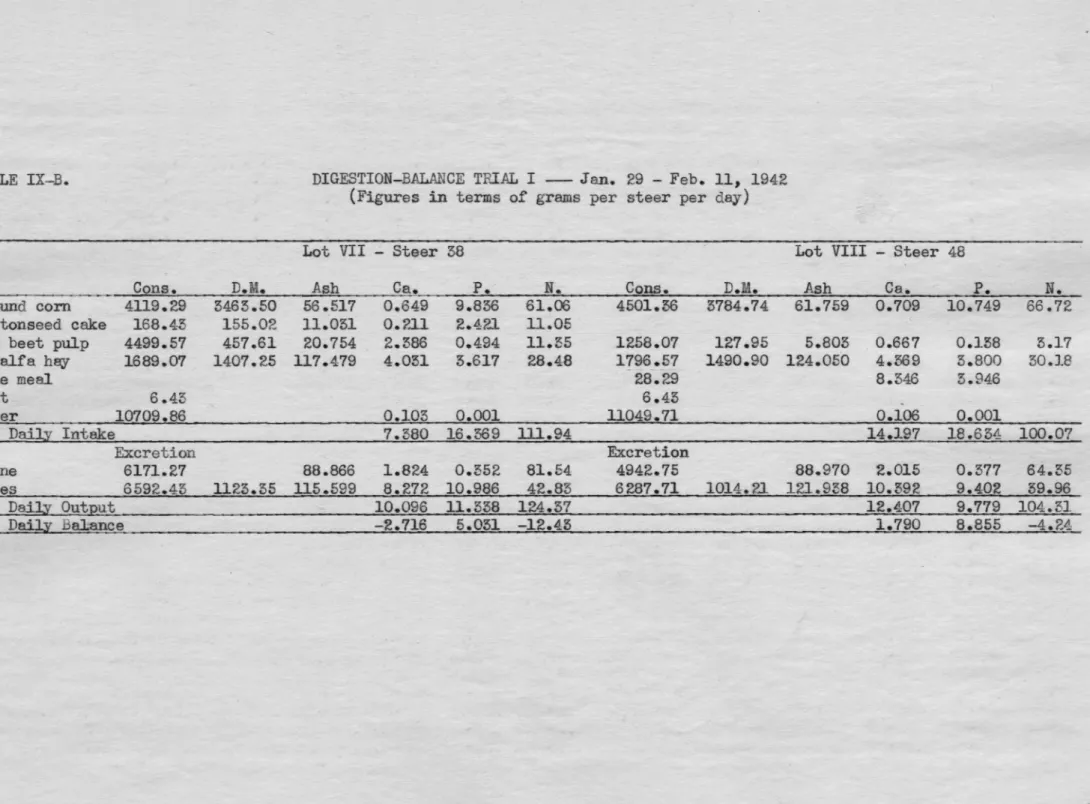
TABLE IX-B. DIGESTION-BALANCE TRI.AL I - Jan. 29 - Feb. 11, 1942 (Figures in terms of grams per steer per day)
Lot VII - Steer 38 Lot VIII - Steer 48
Cons. D.M. Ash Ca.
P.
N. Cons. D.M. Ash Ca.P.
N.
Ground corn 4119.29 3463.50 56 .517 0.649 9.836 61.06 4501.36 3784.74 61.759 0.709 10.749 66.72 Cottonseed cake 168.43 155.02 11.031 0.?.11 2.421 ll.05
Wet beet pulp 4499.57 457 .61 20.754 2.386 0.494 11.55 1258.07 127.95 5.805 . 0.667 0.158 3.17 Alfalfa hey 1689.07 1407.25 117.479 4.051 3.617 28.48 1796.57 1490.90 124.050 4.369 3.800 30.18
Bone meal 28.29 8.346 3. 946
Salt 6.43 6.45
-Water 10709.86 0.105 0.001 11049.71 0.106 0.001
Av. Daily Intake 7.580 16.369 lll.94 14.197 18.63A 100.07
Excretion Excretion
Urine 617l.27 88.866 1.824 0.352 81.54 4942.75 88.970 '2.015 0.577 64.55
Feces 6592.43 1123.55 115.599 8.272 10.986 42.83 6287. 71 1014.21 121.938 10.392 9.402 39.96
Av. Daily OutBut 10.096 11.338 124.57 12.407 9.779 104.51