Effects of forward collision warning,
initial time headway and
repeated scenario exposure
on driver response in
emergency lead vehicle braking scenarios
ViP publication 2011-5Authors
Mikael Ljung Aust, Volvo Cars Johan Engström, Volvo Technology
Matias Viström, Saab Automobile Arne Nåbo, Saab Automobile
Anne Bolling, VTI Mattias Hjort, VTI Laban Källgren, VTI
Preface
The project FICA 2 - Study 3: Validation of Method was a collaborative project between Saab Automobile AB, Volvo Cars AB, Volvo Technology (VTEC) and the Swedish National Road and Transport Research Institute (VTI) within the competence centre
Virtual Prototyping and Assessment by Simulation (ViP). Pixcode AB participated as
contractor. The project was a part of the larger FICA 2 project funded by The Swedish Automotive Research Program (Dnr 2005-00822). FICA 2 aims to develop methods for test and evaluation of active safety systems with focus on driver behaviour. Previously within FICA2, two simulator studies were performed in the Saab Driving simulator, and results from these were forwarded into the ViP project FICA 2 – Study 3.
The project had the following objectives:
Apply, evaluate and improve the methodology developed in FICA 2
(“Handbook of test method for Active Safety Systems”) with the help of an expert user (in this case the test leader at VTI).
Assess the extent to which creating a critical scenario in a moving base simulator with motion cues generates similar driver responses (quantitatively and qualitatively) compared to the outcome of the static simulator set up at Saab. This report describes how these objectives were addressed.
In terms of the first objective, the methodology was early on found to be too abstract, i.e. it was not possible to just hand over the handbook to the expert user along with a set of study objectives to produce a complete study. Instead, the “apply” part was carried out as a joint effort between Mikael Ljung Aust, Johan Engström and the VTI simulator group. The main study was conducted in VTI’s moving base driving simulator (SIM III) in 2009, with scenario development and piloting done in the Saab’s fixed base driving simulator. The main focus of this report is to describe the setup and outcome of that study. In particular, it describes various methodological issues that need to be addressed when repeated scenario exposure is used to evaluate a Forward Collision Warning system in a lead vehicle braking scenario. These results were very helpful for evaluation and improvement of the methodology developed in FICA 2 (though that work is not described in this report but elsewhere), apart from delivering very interesting results in its own right.
In terms of the second objective, the available data allowed only a very limited
comparison of driver responses obtained in the moving base and fixed base simulators, respectively. The outcome of this comparison is given at the end of the report.
Participant from Volvo Cars was Mikael Ljung Aust (Ph.D. student). Participant from Volvo Technology was Johan Engström (Ph.D. student). Participants from Saab Automobile were Arne Nåbo (project leader) and Matias Viström (test leader at Saab).
Participants from the VTI simulator group were Anders Andersson, Anne Bolling, Mattias Hjort, Jonas Jansson and Laban Källgren.
Trollhättan, June 2011
Quality review
Peer review was performed on 2011-01-28 by Gustav Markkula, VTEC and on
2011-02-10 by Jan Andersson, VTI. Mikael Ljung Aust has made alterations to the final manuscript of the report. The ViP Director, Lena Nilsson, examined and approved the report for publication on 2011-11-11.
Table of Contents
Abbreviations ... 5 List of figures ... 6 List of tables ... 7 Executive summary ... 9 1 Study overview ... 11 2 Method ... 16 2.1 Participants ... 16 2.2 Event design ... 16 2.3 Experimental design ... 18 2.4 Apparatus ... 192.5 The Forward Collision Warning System ... 19
2.6 Warning algorithm ... 20
2.7 Visual distraction task ... 20
2.8 Visual behaviour and eye tracking ... 21
2.9 Dependent Variables ... 21
2.10 Procedure ... 22
3 Qualitative results ... 24
3.1 Number of crashes ... 26
4 Quantitative results ... 27
4.1 Effects of the order of ITHW presentation and gender ... 27
4.2 Response times ... 27
4.3 Visual glance behaviour ... 30
4.4 Safety margins ... 31
4.5 Performance on the visual distraction task (correct numbers) ... 33
5 Discussion ... 34
6 Conclusions of the main study ... 40
7 Response differences in the fixed and moving base simulators ... 41
References ... 45
Appendices
Appendix A: Subject questionnaire/interview Appendix B: Test leader instructions
Abbreviations
ADAS: Advanced Driving Assistance System ART: Accelerator Release Time
BRT: Brake Response Time FCW: Forward Collision Warning GRT: Gaze Response Time HMI: Human Machine Interaction
ITHW: Initial Time Headway at lead vehicle braking onset POV: Principal Other Vehicle
RT: Response Time SV: Subject Vehicle TTC: Time-To-Collision
List of Figures
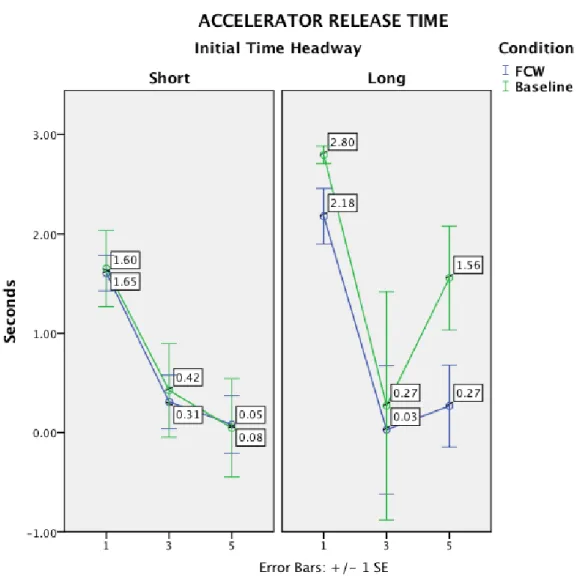
Figure 1: Illustration of the steps in the lead vehicle braking event used in the study ... 17 Figure 2: FCW visual display ... 19 Figure 3: Position of the visual distraction task display ... 20 Figure 4 Summary of response and safety margin measures ... 22 Figure 5: Average response times for drivers with and without FCW as a function of repeated exposure, split by long and short initial time headway (ITHW) ... 28 Figure 6: Average Accelerator Release Times (ART) for drivers with and without FCW as a function of repeated exposure, split by long and short initial time headway
(ITHW). ... 29 Figure 7: Average Gaze Response Time (GRT) for drivers with and without FCW as a function of repeated exposure, divided by long and short initial time headway
(ITHW). ... 30 Figure 8: Average Time-To-Collision (TTC) at Response for drivers with and without FCW as a function of repeated exposure, divided by long and short initial time headway (ITHW). ... 31 Figure 9: Average Minimum Time-To-Collision (TTC) for drivers with and without FCW as a function of repeated exposure, divided by long and short initial time headway (ITHW). ... 32 Figure 10: Averages of correctly read back numbers from the visual distraction task for drivers with and without FCW as a function of repeated exposure, divided by long and short initial time headway (ITHW). Maximum score is six correct numbers. ... 33 Figure 11: Comparing the room for improvement due to FCW when initial time
headway is short and warning onset is late (upper illustration) and when initial time headway is long and warning onset is early (lower illustration). ... 36 Figure 12: Average Response Times for Baseline drivers in the pilot study in the fixed base simulator in Trollhättan, as a function of repeated exposure, divided by long and short initial time headway (ITHW). Note that the comparison is for baseline drivers only, hence the lack of FCW driver data (no blue points). ... 41 Figure 13: Average Response Times for Baseline drivers in the pilot study in the
moving base simulator in Linköping, as a function of repeated exposure, divided by long and short initial time headway (ITHW). Note that the comparison is for baseline drivers only, hence the lack of FCW driver data (no blue points)... 42 Figure 14: Average Maximum Brake Pressure for Baseline drivers in the pilot study in the fixed based simulator in Trollhättan, as a function of repeated exposure, divided by long and short initial time headway (ITHW). Note that the scale does not have any particular unit, it is just a relative simulator-internal scale. Note also that the comparison is for baseline drivers only, hence the lack of FCW driver data (no blue points). ... 43 Figure 15. Average Maximum Brake Pressure for Baseline drivers in the pilot study in the moving base simulator in Linköping, as a function of repeated exposure, divided by long and short initial time headway (ITHW). Note that the scale does not have any particular unit, it is just a relative simulator-internal scale. Note also that the comparison is for baseline drivers only, hence the lack of FCW driver data (no blue points). ... 44
List of Tables
Table 1 Parameter specification for flow of events leading up to the braking event ... 18
Table 2: Experiment design ... 18
Table 3:Drivers’ avoidance strategies over the six critical scenarios ... 24
Table 4: Drivers’ accelerator release behaviour over the six exposures ... 25
Table 5: Timing of response onset (braking/steering) in relation to looking up from the visual distraction task for the FCW group ... 26
Effects of forward collision warning, initial time headway and repeated
scenario exposure on driver response in emergency lead vehicle
braking scenarios
by Mikael Ljung Aust1, Johan Engström2, Matias Viström3, Arne Nåbo3, Anne Bolling4, Mattias Hjort4 and Laban Källgren4
1 Volvo Cars 2 Volvo Technology 3 Saab Automobile 4
Swedish National Road and Transport Research Institute (VTI)
Executive summary
The main objective of this study was to apply, evaluate and improve the methodology for testing the effect of active safety functions in critical scenarios (“Handbook of test method for Active Safety Systems”) which is under development in the FICA 2 project, by means of giving the handbook to an expert user (in this case the test leader at VTI) along with a set of study goals.
However, at an early stage the project group realised that the version of the handbook then available was too abstract to just apply, i.e. it could not just be handed over to an expert user along with a set of study goals in order to produce a complete study. Instead, a joint study design effort took place in order to design a study which addressed a set of key research questions important to the evaluation of active safety functions in driving simulators, the implementation and results of which could be used for evaluation and improvement of the handbook.
The research questions centred around the fact that many experimental studies use repeated lead vehicle braking events to study the effects of Forward Collision Warning (FCW) systems. However, in light of recent naturalistic driving research on how these events actually happen, it can be argued that this type of experimental design lacks result validity in terms of generalizability to the real-world emergency braking scenarios studied in the naturalistic driving studies. At least, a number of methodological
questions on driver response and behaviour in the experimental studies need to be clarified before such generalization can take place. The main focus of the study was therefore to examine whether the presence of an FCW system affects driver response times in emergency braking scenarios, and if that effect is moderated by repeated scenario exposure.
Furthermore, many studies evaluating FCW use distraction tasks to mask the critical lead vehicle braking event, though recent analysis has shown that the effect of distraction tasks which load working memory is highly correlated with initial time headway at task onset. Drivers spend more time on distraction tasks if initial time headway is larger, and vice versa. This effect has not been studied for visual distraction tasks. Therefore a second objective of the study became to examine whether initial time headway at visual distraction task onset affects driver response time in emergency braking scenarios, and whether that effect is moderated by repeated scenario exposure and/or FCW presence.
To address the research questions, a critical lead vehicle braking scenario and an FCW system was developed and pilot tested in Saab’s fixed based driving simulator in Trollhättan. After piloting, the scenario was implemented in VTI’s moving base simulator in Linköping, and the effects, of FCW presence, two different initial time headways at visual distraction task onset and repeated scenario exposure, on driver response times were examined.
The study showed significant effects of FCW and repeated scenario exposure on response times. Moreover, these effects were not additive i.e. a significant interaction between the two was found. There was also a significant effect on response times of initial time headway at onset of the visual distraction task. In addition, an interaction between initial time headway and repeated scenario exposure was found for drivers with FCW, but not for drivers without FCW.
Overall, the study shows that when measuring the effects of an FCW in an emergency lead vehicle braking scenario, the effect size seems to be governed by on one hand the timing of the warning, and on the other hand by the transparency of the scenario for drivers who do not receive a warning (how easy it is to understand that something critical is about to happen). If the warning comes late and the scenario is easy to predict, effects of FCW on response times will be small, and vice versa. Also, the study shows that exposure to the FCW system has a large influence on response times. The
unknowing driver seems to respond only to the scenario and not to the warning, but the first exposure is enough to teach the driver to respond to the FCW in the following scenarios.
A second objective of the project was to compare the extent to which the VTI moving base simulator with motion cues generates similar driver responses (quantitatively and qualitatively) as the static simulator set-up at Saab. As the number of pilots in
Trollhättan was limited to 11 people in total, of which 6 were baseline drivers with complete data sets, these comparisons are to be considered tentative and qualitative rather than quantitative and absolute.
On that level the data seem to indicate that baseline drivers in the fixed base simulator show the same type of improvement, in response time and reduction in maximum brake pressure over exposures, as drivers in the moving base simulator, but not the same response difference between the long and short initial time headway conditions. In general, the results from this project have important implications for the
interpretation of driver performance in experimental settings, particularly when aiming to evaluate safety-related in-vehicle information and warning technologies. For one thing, they pose a general question mark around the generalizability of results to real world events. Second, a future prerequisite for FCW studies should probably be that test drivers have a previous level of system exposure level which matches that of real world drivers encountering typical critical events. Also, tuning the initial time headway at distraction task onset in the experimental setting to real world conditions is of critical importance.
1
Study overview
The initial objective of this study was to apply, evaluate and improve the methodology for testing the effect of active safety functions in critical scenarios (“Handbook of test method for Active Safety Systems”) that is under development in the FICA 2 project. This was planned to be done by giving the handbook to an expert user (in this case the test leader at VTI) along with a set of study goals.
However, at an early stage the project group realised that the version of the handbook then available was too abstract to follow in the intended way. Instead, a joint study design effort took place in order to design a study which addressed a set of key research questions important to the evaluation of active safety functions in driving simulators (in this case FCW), and the structure of which could be used as input to create a more detailed rendition of the handbook in the FICA 2 project.
A set of research questions were formulated and a critical lead vehicle braking scenario suitable to address those, along with an FCW system, was developed and pilot tested in Saab’s fixed based driving simulator in Trollhättan. When the scenario had been
verified, it was implemented in VTI’s moving base simulator in Linköping, and the main study was carried out.
Also, since the scenario had been developed and piloted in a fixed base simulator and then moved for full scale testing in a moving base simulator, there was an opportunity to make a limited comparison of the extent to which the VTI moving base simulator with motion cues generates similar driver responses (quantitatively and qualitatively) compared to the outcome of the static simulator set up at Saab.
In the following, the purpose and structure of the main study is described, along with main results, discussion and conclusions. After that, the comparison of driver behaviour in the fixed base and moving base simulators is addressed.
Active safety functions are receiving an increasingly prominent role in traffic safety. One of these functions is Forward Collision Warning (FCW). FCW detects lead vehicles by means of a forward-looking sensor (usually radar), and issues a warning to alert the driver when there is an imminent collision risk. The intent of this function is to prevent crashes with lead vehicles from occurring and/or reduce crash severity.
To assess the potential benefit of FCW, some form of safety benefit calculation has to be made. In general, the basis for benefit calculations is a correct and detailed
characterization of the sequence of events which leads to the collision type one is trying to prevent (Najm and Smith, 2002). A key part of that characterization is data on driver performance, with and without assistance from the ADAS, collected from driving events which play out according to the typical sequence description (Kiefer et al., 1999; Najm, daSilva and Wiacek, 2000; Ljung Aust and Engström, 2011).
Numerous studies have been carried out to characterize and measure the influence of FCW on driver performance in typical pre-crash sequences. The design intent for FCW is to make drivers react faster and/or earlier when a lead vehicle following situation becomes critical. Therefore, these studies typically try to identify changes in response time measures as a function of having FCW in the vehicle, such as faster brake
responses if drivers are given a forward collision warning when a critical event starts to unfold.
A common experimental setup in these studies is to expose subjects to repeated lead vehicle braking events, and then calculate each driver’s average response over those
exposures as the basis for comparing the performance of drivers with and without FCW (see for example Abe and Richardson, 2004, 2005, 2006a, 2006b; Cheng, Hashimoto and Suetomi, 2002; Jamson, Lai and Carsten, 2008; Kramer, Cassavaugh, Horrey, Becic and Mayhugh, 2007; Nakaoka, Raksincharoensal and Nagai, 2008). While this is well established practice and makes good use of resources, when used to evaluate the effects of FCW it is based on some methodological assumptions that the current study was designed to investigate further.
The first is whether it is reasonable to use repeated critical events. The second is whether the effects of FCW are additive to those of event
repetition.
The third is the way in which scenario criticality is implemented. These concerns are discussed in turn below.
The first question whether it is reasonable to use repeated critical events has come into focus based on findings from the recent 100 Car Naturalistic Driving study. This study shows that a typical characteristic of the real world situations where FCW would be useful (i.e. where emergency braking is required to avoid colliding with a lead vehicle) is that they occur very unexpectedly from the driver’s point of view (Dingus et al., 2006). In order to replicate this real life scenario property in an experimental setting where FCW is to be evaluated, each critical event should thus ideally come as a
complete surprise to the driver. This is very difficult to achieve, especially after drivers have experienced the first critical event. Even if measures like random event timing and catch trials are put in place to mask event reoccurrence, it is hard to avoid an increased expectancy and response readiness in the test subjects.
Increased expectancy is a problem because it substantially influences response times. In a meta-analysis of Brake Response Time (BRT) studies, (Green, 2000) found that while BRTs could be estimated to 1500 ms or more for truly unexpected events, they are reduced to 1200-1350 ms for somewhat unexpected events and 700-750 ms for expected events. Hence, drivers should respond faster and faster as events repeat if expectancy increases with exposure. This was also shown empirically by (Lee,
McGehee, Brown and Reyes, 2002) in a driving simulator study investigating effects of FCW on braking performance. Drivers exposed to two consecutive identical lead vehicle braking events averaged 433 ms faster accelerator pedal release times in the second exposure (time between lead vehicle brake onset and accelerator release). A similar 374 ms reduction in accelerator release time from the first to the second exposure was obtained by Engström, Ljung Aust and Viström (2010) in a study
investigating effects of working memory load on braking performance in repeated lead vehicle braking events. Response times from repeated critical events in an experimental setting might thus not be possible to generalize to the real world lead vehicle conflicts FCW is intended to address, as the former are prone to expectancy effects not found in the latter (Dingus et al, 2006).
However, even if repeated exposures might shorten absolute response times, the use of repeated events and averaging response times over exposures could still be justified if the effect of FCW is additive to that of event repetition. For example, if drivers with FCW always respond 300 ms faster than drivers without FCW, regardless of any general decrease in absolute response times as events repeat, then a similar difference could be expected also in real world conflicts. If so, (as suggested by Lee et al. (2002)) response times for later events in an experimental series could be adjusted by simply adding the effect of repeated exposure.
This leads to the second methodological concern mentioned above, which is that while the effect of FCW can be argued to be additive to repeated exposure for real life events it might not be additive in an experimental setting, due to an important difference in how drivers learn to respond to FCW in real life as compared to in a driving simulator or on a test track. In real life, drivers quickly come to realise that there is a certain variability of the conditions for which FCW will trigger. Also, there will be occasional non-relevant warnings, i.e. warnings which the driver either does not understand the purpose of or regard as unnecessary.
Thus, for a typical real life situation where FCW might help (e.g. for a visually
distracted driver in an unexpected lead vehicle braking situation), it could be expected that FCW would re-direct the driver’s gaze and attention back to the road ahead, but not that FCW would trigger a direct avoidance response (braking and/or steering), since the driver has to assess whether the warning is relevant before responding. FCW driven avoidance responses in real traffic can thus be assumed to be triggered bottom-up, when visual cues (in particular the optical expansion (looming) of the lead vehicle) indicate that a collision is imminent1. This represents a closed-loop response (Lee et al., 2002) as it depends on perception of the evolving driving situation. Hence in this case, drivers view FCW as a type of automation that re-directs attention.
Drivers who learn to use FCW in an experimental setting on the other hand experience a much more limited set of conditions where FCW triggers, and they are rarely exposed to false warnings. In other words, they learn to use FCW through repeated exposure to more or less identical events where the issued warning nearly always is correct. For the same typical situation as above (i.e. a visually distracted driver in unexpected lead vehicle braking situation) it could therefore be expected that FCW would re-direct their gaze and attention back to the road ahead. However, it could also be expected that FCW might trigger a direct avoidance response (braking and/or steering) once the drivers understand the purpose of the warning, i.e. they may shift towards an open-loop response strategy and come to view FCW as automation designed to trigger a response (Lee et al., 2002).
If drivers with FCW in the experimental setting come to respond directly to the warning rather than to perceptual cues from the braking lead vehicle, two implications follow. First, if the warning is given before the bottom-up cues are sufficiently strong to warrant an avoidance manoeuvre, one could expect an interaction effect between FCW and repeated exposure. In other words, if drivers with FCW respond to lead vehicle looming cues in the first event(s), but later initiate their response based on a warning that is triggered before drivers without FCW have access to sufficiently strong looming cues to indicate that the situation is getting critical, the gap in response times between the two groups will increase with exposure. In this case, averaging across exposures would no longer be a viable procedure, as it is unclear how much of the response difference is due to FCW and how much is due to event repetition. Second, such open-loop type
responses cannot be considered generalizable, given the likely closed-loop character of FCW responses in real life.
11
Recent evidence suggests that one key factor determining when drivers’ will initiate braking in lead vehicle braking situations is the rate of deceleration required to stop short of the lead vehicle (Fajen, 2005), which is inversely related to the time-to-collision (TTC). In line with this, Kiefer, LeBlanc et al. (2005) identified inverse TTC as the best predictor of when drivers initiate braking in car following rear end collision scenarios. TTC is optically specified by the ratio between the optical angle subtended by the lead vehicle and its expansion rate, a quantity commonly known as tau (Lee, 1976).
Lee et al. (2002) did address this issue in their study. They found additive effects of FCW and repeated exposure on response time, safety margin, collision velocity and the number of collisions. Moreover, since FCW only affected accelerator release time, but not accelerator to brake time or the time from brake onset to reach maximum
deceleration, the authors concluded that drivers respond in a closed-loop manner to FCW across exposures. However, exposure in that study was limited to two braking events. Other studies use several more, and it is possible that a shift towards open-loop responses, and a resulting interaction between FCW and exposure, might occur with more exposures.
The third methodological concern is the implementation of scenario criticality. In the lead vehicle braking events typically used to evaluate FCW, criticality is mainly
determined by the lead vehicle’s deceleration rate and the initial time headway (ITHW), i.e. the time headway at the moment lead vehicle braking begins. In existing studies of FCW, the value of ITHW varies substantially. This is a problem because in a meta-analysis of several experimental studies on the effect of working memory loading tasks in lead vehicle braking events Engström (2010) found that brake response times were almost linearly correlated with ITHW, i.e. the shorter the ITHW the faster the response. One way of explaining this finding is that ITHW directly determines the time between lead vehicle brake onset (which normally is the time in relation to which response times are measured) and the time when sufficiently strong looming cues appear to trigger a response (Janssen, Michon et al., 1976). Thus, inasmuch as avoidance is triggered in a closed-loop manner by looming cues, response times should reflect the implemented ITHW (implying a main effect of ITHW). However, if avoidance responses would shift towards an open-loop response strategy determined by warning timing, the effect of ITHW would decrease with repeated exposure. This implies that there will be an interaction between ITHW and exposure for drivers with FCW, but not for drivers without FCW.
This has obvious implications for FCW studies. First, if response times in FCW studies were highly correlated with ITHW, then selecting an experimental ITHW that is
representative of relevant real world events becomes the key to result generalizability. Second, if there is an interaction effect between exposure and ITHW for drivers with FCW, but not for drivers without FCW, it becomes difficult to interpret the reasons for any differences between the two groups in terms of response times. While scenario criticality was included in the study by Lee et al. (2002), it was varied through a combination of ITHW and lead vehicle deceleration rather than through ITHW only. Hence, it is difficult to draw precise conclusions about the specific role of ITHW from this data.
In summary, the main objective of the present study was to experimentally test the effect of FCW in lead vehicle braking events, using an experimental design that allowed investigating the methodological concerns describe above. These are in turn whether response times change with repeated exposure, whether the effects of FCW are additive to those of repeated exposure, and if response times are correlated to initial time
headway. To better understand the effects on response time we also analysed drivers’ visual behaviour, in particular when drivers looked up from the visual distraction task used in the critical events in relation to lead vehicle braking onset. We were also
interested in investigating how the factors discussed above affected situation outcome in terms of resulting safety margins, and whether general behavioural strategies adopted by the drivers changed with repeated exposure.
Furthermore, it was hypothesised that drivers will spend more time on a visual
distraction task and thus react later relative to distraction task onset if time headway at task initiation is relatively large, and less so if time headway at task initiation is relatively small.
2
Method
The study was carried out at VTI’s driving simulator facilities in Linköping, Sweden. Prior to running the actual study at VTI, the scenario, the visual distraction task and the FCW system to be used were developed and piloted in Saab’s driving simulator in Trollhättan.
2.1
Participants
40 subjects, 16 women and 24 men, participated in the study. They all held a driver’s licence since more than 5 years with a total driving experience of at least 50 000 km. Their ages ranged from 23 to 46 years (mean 35.6 yrs., SD 7.3 yrs.). The subjects in the FCW condition did not have any previous experience of FCW, and they were not informed about there being FCW in the vehicle. All subjects had normal or corrected-to-normal vision. Each subject was given 30 € for his/her participation.
2.2
Event design
The lead vehicle braking event took place on a simulated 4-lane divided motorway with 2 lanes in each direction, in daylight conditions and with no precipitation (dry surface), with a moderate density of ambient traffic travelling in the opposite direction to the subject vehicle (henceforth referred to as SV), and some slower moving traffic travelling in the same direction as the SV. Subjects were instructed to maintain the posted speed limit of 90 kph, and in order to prevent larger excess speeds a speed limiter was implemented with the maximum speed set to 100 kph. The lead vehicle (henceforth referred to as the Principal Other Vehicle, POV) was always of the same model and colour (a blue Volvo V50) in order to keep brake light contrast constant. A key goal of the present study was to assess braking performance in kinematic conditions which are sufficiently critical to elicit true emergency braking reactions. Also, a basic requirement across event repetitions was that kinematic conditions at the initiation of the critical event (i.e. when the lead vehicle begins to brake) should be approximately equal. On the other hand, events should also be as self-paced as possible, as forcing subjects into critical situations (e.g. by using adaptive cruise control to set initial time headway) may result in non-natural braking behaviour (e.g. due to extreme levels of response readiness). Thus, subjects have to be “tricked” into situations where their normal subjective safety margins are exceeded at the moment just prior to the critical event. As discussed at greater length in (Engström and Ljung Aust, 2011), this is challenging since drivers tend to adapt their behaviour, for example by slowing down, in anticipation of critical events.
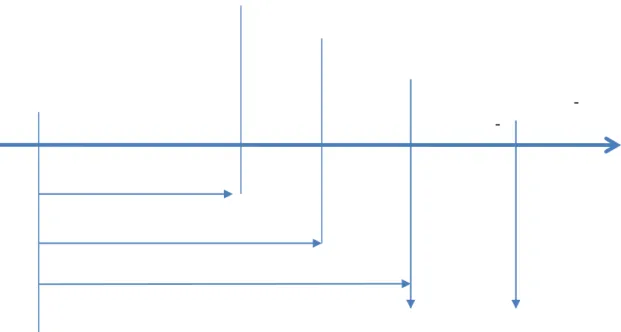
For this study, a previously used scenario (Engström, Ljung Aust and Viström, 2010) was used with slight modifications. In the previous study, this scenario was shown to be effective in tricking subjects into violating their safety margins, especially for the first, unexpected, scenario exposure. The scenario is illustrated in Figure 1. The SV initially travels in the right lane at speed v1 (self-paced, instructed to be 90 kph and constrained
to be below 100 kph by a speed limiter). The POV overtakes in the left lane at speed v2
(1). At time headway ITHWcut, (0.9 s), the POV cuts in to the right lane with lateral speed 5.4 kph (2). Since ITHWcut is smaller than the targeted initial time headway for
braking ITHWbrake, the POV continues to move away from the SV at speed v2 (3).
despite being very close to the SV. Compensatory strategies such as slowing down to increase headway are therefore reduced compared to a normal car following event. The time it takes from when the POV starts to change lanes until it is in its desired braking position is here referred to as transition time, Ttrans. To keep the transition time
constant across variations in SV speed, POV speed was set and continuously adjusted to a predetermined fraction of SV speed, given by the multiplication factor Rx. In other
words, the POV speed v2 was continuously set to v1 * Rx.
At time headway ITHWbrake (4), the POV speed was first instantaneously set equal to SV
speed (otherwise the POV would initially continue to move away from the SV during the braking phase due to its higher relative speed, which would delay the onset of the critical scenario and any warnings with several seconds). Then the POV braked at a rate of 0.55 g. The POV continued to brake at this rate until the SV either passed or collided with the POV, their relative speed went to zero (no further collision risk) or POV speed went below 25 kph. When either condition (except for collisions) was met the POV accelerated away at a rate of 0.3 g up to a speed of 140 kph. As thiswas faster than maximum SV speed (due to the speed limiter) the POV would then disappear ahead after a certain time. If a collision occurred, the POV was “pushed” forward a few meters (as by an invisible telescopic arm) and then pulled over and parked on the shoulder. The analogy to the driver was that even if a collision had occurred, it had the character of a fender bender rather than a serious crash. To enhance this perception no sound or motion effects were used to mark the event.
Figure 1 Illustration of the steps in the lead vehicle braking event used in the study.
Two different initial time headways, ITHWbrake1 and ITHWbrake2, were used in the study in order to investigate how response time depended on initial time headway. Using the same Ttrans for both ITHW conditions would have resulted in either very small relative
speeds during overtaking between SV and POV in the short ITHW condition or very high relative speeds in the long ITHW condition. Two different scale factors, R1 and R2
(one foreach ITHW condition), were therefore used. A complete list of parameter
values is given in Table 1.
dbrake V2 (v1*Rx) thwcut vcut thwbrake v1 1 2 4 SV POV POV POV POV 3 Ttrans
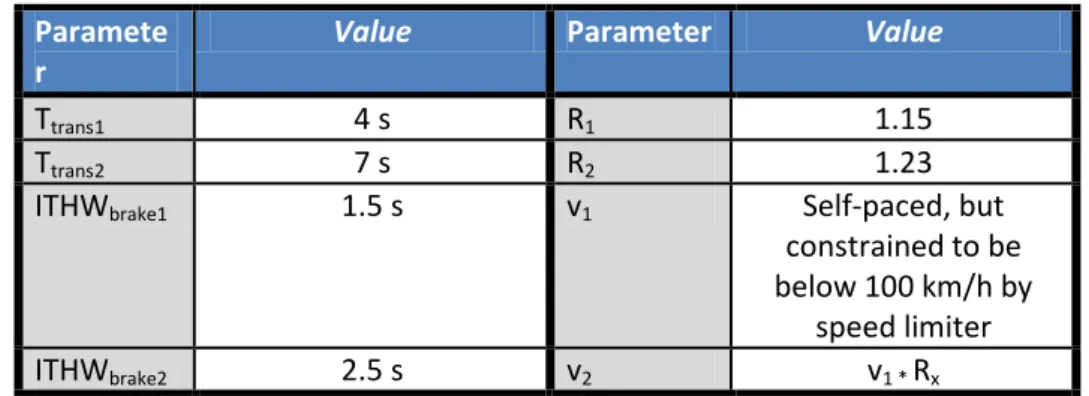
Table 1 Parameter specification for flow of events leading up to the braking event.
Paramete r
Value Parameter Value
Ttrans1 4 s R1 1.15
Ttrans2 7 s R2 1.23
ITHWbrake1 1.5 s v1 Self-paced, but
constrained to be below 100 km/h by
speed limiter
ITHWbrake2 2.5 s v2 v1 * Rx
2.3
Experimental design
FCW was included as a between-subject variable while initial time headway and event exposure were varied within groups. For initial time headway, the implementation was that if a driver experienced the first lead vehicle braking event at short ITHW (1.5 s), s/he would then experience the second event at long ITHW (2.5 s), the third at short ITHW, and so forth. The order was also balanced so that within each main group (FCW and Baseline, i.e. no FCW), half the subjects started with the short ITHW condition and the other half with the long ITHW condition.
All subjects were exposed to six lead vehicle braking events that were intermingled with non-braking events, which were identical except that the lead vehicle did not brake after the lane change (see above), but rather continued to drive away from the subject vehicle at a relatively higher speed. There were a total of 12 events along the route, 6 lead vehicle braking events and 6 non-braking events. Event order was randomised prior to implementation and the same order was used for all drivers.
Introducing ITHW alteration in this way meant that the participants would not be able to use the position of the lead vehicle as a predictor of when it would begin to brake (at least not in the first two exposures), thus further increasing scenario unexpectedness. The order of initial time headway was counterbalanced across drivers. The design is illustrated in Table 2.
Table 2 Experimental design.
In order to analyse ITHW as a between groups variable, only braking events 1, 3 and 5 were included in the analysis, i.e. braking events 2, 4 and 6 can be considered catch trials. The first three minutes of the drive did not include any events, and the braking
Pra ctice dri vi ng Pra ctice tas k Pra ctice tas k whi l e dri vi ng Non-bra ki ng event Non-bra ki ng event 1 Non-bra ki ng event 2 3 Non-bra ki ng event 4 Non-bra ki ng event Non-bra ki ng event 5 6 Group 1 Short THW Long THW Short THW Long THW Short THW Long THW Group 2 Long THW Short THW Long THW Short THW Long THW Short THW Group 3 Short THW Long THW Short THW Long THW Short THW Long THW Group 4 Long THW Short THW Long THW Short THW Long THW Short THW Training Without FCW Experiment design Exposure With FCW
events were initiated approximately once every four minutes. The entire drive took 27 to 30 minutes to complete.
2.4
Apparatus
A moving base driving simulator (Sim III2) located at VTI, Linköping, Sweden, was
used. The vehicle mock-up was a Saab 9-3 Sport sedan model year 2003 with automatic transmission. The visual system consists of 3 DLP projectors (resolution of
1280x1024 pixels) providing a 120 degrees forward field of view. Edge blending and geometrical correction is provided by a dedicated graphics card. There are 3 LCD displays incorporated into the rear view mirrors for rearward views. Sounds from vehicles, road and wind are simulated and presented via the in-vehicle speaker system. The moving base has three parts: a linear sled, a tilt motion system and a vibration table. The sled can provide linear motion with an amplitude of ±3.75 m at speeds up to
±4.0 m/s and accelerations up to ±0.8 g. The tilt motion system can produce pitch angles between -9 degrees and +14 degrees and roll angles of ±24 degrees. The vibration table gives
±6.0 cm in vertical and longitudinal movement, with a maximum roll angle of ±6 degrees and pitch angle of ±3 degrees.
2.5
The Forward Collision Warning System
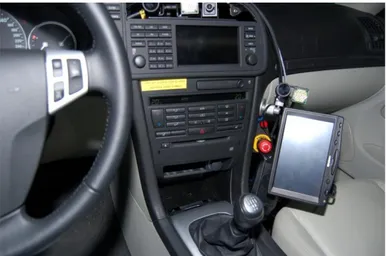
The Forward Collision Warning (FCW) was given through a combined audio and visual display. The visual display consisted of a series of red LED-lights mounted on the dashboard. When lit, the LEDs are not visible to the driver, but their light is reflected in the windscreen in front of the driver, conceptually mimicking the effect of lead vehicle brake lights (see Figure 2). The visual warning was given by flashing the LED-lights 6 times, for 125 ms with a 125 ms interval between each flash, for a total duration of 1.5 seconds. The auditory warning consisted of the sound developed in the CAMP project for FCW (Kiefer et al.,1999). The tone was presented at 74.5 dBA.
Figure 2 FCW visual display.
2
2.6
Warning algorithm
The study used an FCW warning algorithm described in Jansson (2005), which is similar to the improved CAMP algorithm (Kiefer, Shulman et al., 2003). A main determinant of warning timing in this algorithm is the level of deceleration required by the following vehicle to avoid colliding with the POV. The warning triggers when the required deceleration exceeds a pre-defined threshold. To ensure that warnings were issued within the time span of the visual distraction task this level had to be set very
low, i.e. to -0.25 m/s2 (which is much lower than in production systems). The warning
was thus issued just a few hundred milliseconds after lead vehicle brake onset in each event. For Short ITHW the mean time from POV brake onset to warning was 272 ms (SD = 87 ms). For Long ITHW the mean time was 461 ms (SD = 66 ms). A side effect of this early warning is that the relative speed between SV and POV (and thus any looming cues) was small at warning onset. The main visual cue at event onset, apart from the warning itself, was therefore the POV brake lights.
2.7
Visual distraction task
The visual distraction task used a display positioned sufficiently far down and to the right of the driver’s forward view to make the driver visually distracted from the forward roadway. Drivers were prompted by a pre-recorded voice to read back a sequence of 6 numbers (randomised single digits between 1 and 9) appearing on the display. Each number was displayed for 0.3 seconds, with 0.2 seconds of blank screen in between numbers, creating a total task duration of 2.8 s. To motivate drivers to complete the task, they were told that their responses would be randomly checked for correctness.
Figure 3 Position of the visual distraction task display.
The visual distraction task was initiated in all braking and non-braking scenarios as well as between scenarios. In terms of task frequency, this meant that the visual distraction task occurred on average once every 30 s of the drive. In the POV braking scenarios, task initiation was automatically triggered based on POV position to ensure the visual distraction task overlapped with the POV braking event. The precise point in the number sequence at which the POV would start braking was randomized to coincide with either the second, third or fourth number displayed. Thus POV braking would start either 1 s, 1.5 s or 2 s into the visual distraction task (total task duration was 2.8 s).
2.8
Visual behaviour and eye tracking
When the study was set up the idea was to analyse visual behaviour by means of the SmartEye eye tracking system (http://smarteye.se/products/simulator-eye-trackers) that is mounted in the simulator, and to focus this analysis on the drivers’ attention
allocation at critical event onset. However, the eye tracker data proved to be highly unreliable. The quality of the eye tracking varied greatly, both between subjects and over time. Also, while fairly robust estimates of glance behaviour probably could have been derived if the entire drive had been used, here we were only interested in the short periods of time between visual distraction task onset and driver response onset. For those short time periods, the ratio of non-tracking epochs was too high and quality too varied to support a reliable analysis.
Instead, manual gaze analysis was carried out, i.e. one of the authors went through the events frame by frame on recorded video data to surely determine when drivers did look down towards and up from the visual distraction task, both in relation to the warning given to FCW drivers and in relation to lead vehicle braking onset.
2.9
Dependent variables
A number of dependent variables were defined to characterise the process of responding to the braking POV (see Figure 4). The Gaze Response Time (GRT) represents the time from POV brake onset to the first driver glance back towards the forward roadway.
Response time (RT) represents the time from POV braking onset to initiation of a driver
response. As the lead vehicle braking event was initiated on a two-lane divided highway with the left lane deliberately left empty of other traffic, drivers were free to respond by either braking or steering. Response times were therefore determined by measuring either a Brake onset time or, if no braking occurred between POV brake onset and the end of the event (SV passes or collides with the POV, relative speed goes to zero, or POV speed goes below 25 kph), a Steering onset time.
Brake onset time was defined as the time from the onset of the POV brake lights until
any brake pressure was registered in the SV. Steering onset time was defined as the time from the onset of POV brake lights to the point of maximum steering wheel velocity before the SV had completely moved into the adjacent lane. For each driver and event, the type of driver response (steering or braking) was determined and the corresponding response time was then calculated.
In addition, two measures of adopted safety margins were calculated based on time-to-collision (TTC). TTC at response represented the TTC at the moment when the steering or braking response was initiated, while min TTC represented the minimum TTC between POV brake onset and the end of the event. The described dependent variables are summarised in Figure 4. The number of crashes which occurred during the events was also analysed, as well as whether drivers responded primarily by steering or primarily by braking.
Figure 4 Summary of response and safety margin measures.
In addition, performance on the visual distraction task was measured in terms of
Correct Numbers (CN), that is, how many of the six numbers displayed that the subject
read back correctly. This was manually annotated for each driver and event.
Avoidance behaviour was determined based on whether the driver primarily resolved
the critical scenario by braking or by steering. Accelerator Release Behaviour
categorises in which part of the scenario the driver released the accelerator pedal, with categories spanning from when the POV changes lanes to never released accelerator. For FCW drivers, it was also determined whether they initiated their braking response before, at the same time, or after looking up from the visual distraction task. This is referred to as Brake Onset Behaviour.
2.10 Procedure
When arriving at the laboratory, the subject was introduced to the study. To minimise any initial expectations on critical events, s/he was told that the purpose of the study was to collect general data on normal driver behaviour for later use in other projects. The subject was instructed to drive as s/he normally would, with no extreme
manoeuvres, and to maintain the posted speed of 90 kph. Instructions were also given on the visual distraction task.
Next the subject was familiarised with the simulator. Before commencing the practice drive, the subject practiced the visual distraction task several times until s/he felt
comfortable doing it. The subject then took a ten minutes practice drive, as suggested by (McGehee, Lee, Rizzo, Dawson, and Bateman, 2004), consisting of steady state driving on a two lane divided highway, i.e. on the same road as used in the experiment but without any particular braking or steering events occurring. Towards the end of the test drive, the subject again practiced the visual distraction task until s/he felt comfortable performing the task while driving.
- -
Drivers in the FCW condition were not informed about there being an FCW system in the vehicle. Hence, the first critical event during the drive therefore constituted their first actual experience of the function. After the drive, subjects were debriefed and a post-experiment interview was conducted (see Appendix A). During the interview, the experimenter revealed the true purpose of the study and discussed any experienced differences between simulator and real world driving. Also, subjects were asked if they experienced any motion sickness during or after the drive.
3
Qualitative results
The analysis of whether drivers resolved the critical scenario by steering or braking shows that braking is the predominant response for all drivers (see Table 3). However, the number of drivers who responds by steering rather than braking increases steadily from only three in the first exposure to fourteen in the last. Moreover, this trend is larger in the Baseline group than in the FCW group; with 10 of 20 baseline drivers steering rather than braking in the final exposure.
Table 3 Drivers’ avoidance strategies over the six critical scenarios.
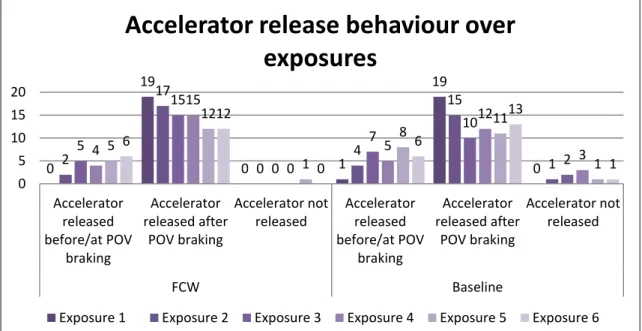
In terms of accelerator release, the number of drivers who releases the accelerator pedal prior to POV braking, i.e. when the POV changes lanes and moves into lead vehicle position, also increases over exposures (see Table 4). Drivers who do not release the accelerator pedal uniformly respond to the scenario by steering.
19 0 17 3 17 2 16 4 18 2 12 7 16 3 13 7 15 3 15 5 14 4 10 10 0 2 4 6 8 10 12 14 16 18 20
Brakes Steers Brakes Steers
FCW Baseline
Type of avoidance response
Table 4 Drivers’ accelerator release behaviour over the six exposures.
In terms of how drivers in the FCW group respond to the warning when it comes, a change of response strategy can also be seen over exposures (see Table 5). In the first scenario, all FCW drivers first look up and then brake. In the following scenarios, a small but increasing number of drivers instead respond by first braking and then looking up towards the lead vehicle. In other words, they brake while continuing to read back numbers from the visual distraction task. Only when the task is finished or nearly finished do they look up to see what is going on in front of their own vehicle.
0 19 0 1 19 0 2 17 0 4 15 1 5 15 0 7 10 2 4 15 0 5 12 3 5 12 1 8 11 1 6 12 0 6 13 1 0 5 10 15 20 Accelerator released before/at POV braking Accelerator released after POV braking Accelerator not released Accelerator released before/at POV braking Accelerator released after POV braking Accelerator not released FCW Baseline
Accelerator release behaviour over
exposures
Table 5 Timing of response onset (braking/steering) in relation to looking up from the visual distraction task for the FCW group.
3.1
Number of crashes
There were 7 lead vehicle crashes registered; 1 in the FCW group (at a speed of 22 kph) and 6 in the baseline group (mean 55.4 kph, range 44.4–65.7). The one in the FCW group and four of the baseline group crashes occurred during the first exposure, and all occurred in the short ITHW condition. All crashes were preceded by a braking (rather than steering) response.
19 17 16 15 14 13 1 2 2 4 4 4 3 0 2 4 6 8 10 12 14 16 18 20 1 2 3 4 5 6
Response onset (braking/steering) in
relation to looking up from the secondary
task for the FCW group
before looking up
at the same time as looking up after looking up
4
Quantitative results
The main objective of the study was to test the effect of FCW on response times in lead vehicle braking events. We also wanted to investigate if response time changed with repeated exposure; whether any effects of FCW on response time were additive to those of repeated exposure, and if response times were correlated to ITHW. To understand any effects on response time, we also analysed drivers’ visual behaviour, in particular when drivers looked up from the visual distraction task in relation to lead vehicle braking onset. We also investigated how FCW, exposure and ITHW affected the event outcome in terms of resulting safety margins.
The data were analysed by the SPSS general linear model (GLM) using type III Sums of Squares. All testing was done at the alpha = 0.05 significance level. As described above in the experimental design section, all drivers experienced a total of 6 lead vehicle braking events. However, to be able to analyse ITHW as a between groups variable only braking events 1, 3 and 5 are included in the part of the analysis where ITHW is
involved. In other words, that data was subjected to a 2*2*3 mixed ANOVA with ADAS condition (FCW or Baseline) and initial time headway (long or short) as between-subjects factors and Exposure (events 1, 3, 5) as a within-subjects factor.
Braking events 2, 4 and 6 can thus be considered catch trials in the quantitative analysis. Depending on the results of the main ANOVA, further testing of simple effects within one or more of the three conditions (ADAS, ITHW, Exposure) were also carried out.
4.1
Effects of the order of ITHW presentation and gender
Before running the main ANOVA, the data was tested for effects of Gender and the order of ITHW presentation (i.e. whether drivers started in the long or short ITHW condition). There was no evidence that gender or ITHW order lead to consistent differences in any dependent variable.
4.2
Response times
Braking was the predominant response for all drivers, and the proportion of braking
avoidance responses was significantly higher in the FCW group (X2(1) = 5.6,
p <= .018).
The results for response time are given in Figure 5. Mauchly’s test indicated that the assumption of sphericity had been violated, therefore the degrees of freedom for Exposure were corrected using Greenhouse-Geisser estimates of sphericity (έ = .851). The FCW group responded significantly faster than the baseline group (F(1, 33) = 44.3, p < .001). Also, response times were significantly reduced with Exposure (F(1.7, 56.2) = 52.5, p < .001). The significant reduction with exposure occurred both in the FCW (F (2, 32) = 104.6, p < .001) and baseline group (F (2, 34) = 5.1, p < .012) when analysed separately.
FCW and Exposure also interacted significantly (F(1.7, 56.2) = 13.6, p < .001). A test of the simple effects of FCW within each level of exposure (Bonferroni adjusted), revealed no effect of FCW on response time in the first exposure (p = .256), but significantly shorter response times in exposures 3 and 5 (p < .001 for both).
In terms of initial time headway, response times were significantly longer in the long ITHW condition (F(1, 33) = 23.7, p < .001). This effect was more pronounced for the initial exposure (1) compared to the repeated exposures (3, 5), to the point of a near significant interaction between Exposure and ITHW (F(1.7, 56.2) = 3.1, (p = .059). There was no significant interaction between FCW and ITHW, but a relatively strong trend (p = .064).
Figure 5 Average response times for drivers with and without FCW as a function of repeated exposure, split by long and short initial time headway (ITHW).
The results for Accelerator Release Time (ART) are shown in Figure 6. ART was significantly reduced with repeated exposure (F(2, 60) = 17.3, p < .001), but there were no main effects of FCW or ITHW. A test of the simple effects of ITHW within the levels of Exposure revealed a significant difference in ART for the first exposure (F(1, 30) = 10.5, p = .003), but not for the other exposures (p = .762 and
p = .062 respectively). It may also be observed that variability increased with repeated exposure, with a frequent occurrence of anticipatory responses (negative ART values).
Figure 6 Average Accelerator Release Times (ART) for drivers with and without FCW as a function of repeated exposure, split by long and short initial time headway (ITHW).
4.3
Visual glance behaviour
The results for Gaze Response Time (GRT, i.e. the time from POV brake onset to first driver glance back on forward roadway) are shown in Figure 7. There were no
significant main effects of FCW, ITHW or Exposure. However, a test of the simple effects of ITHW within levels of exposure reveal that GRT was significantly longer for drivers in the long ITHW condition in the first exposure F(1,32) = 8.5, p = .006), but this difference is not present in the two following exposures (p = .570 and p = .646).
Figure 7 Average Gaze Response Time (GRT) for drivers with and without FCW as a function of repeated exposure, divided by long and short initial time headway (ITHW).
4.4
Safety margins
Time-To-Collision (TTC) at response (Figure 8) was significantly larger for drivers with FCW (F(1,33) = 57.0, p<.001) and for drivers in the long ITHW condition (F(1,33) = 8.9, p = .005). It also increased significantly with Exposure (F(2, 66) = 66.0,
p < .001). Also, there were significant interactions, i.e. TTC at response increased more strongly with Exposure in the FCW group compared to the baseline group
(F(2,66) = 24.9, p < .001)), and more in the long than the short ITHW condition (F(1,33) = 5.4, p = .026). In general, these results mirror those for response time, with one important exception: TTC at response for the baseline group was not significantly affected by ITHW.
Figure 8 Average Time-To-Collision (TTC) at response for drivers with and without FCW as a function of repeated exposure, divided by long and short initial time headway (ITHW).
For Min TTC, Mauchly’s test indicated that the assumption of sphericity had been violated, therefore the degrees of freedom for Exposure were corrected using Greenhouse-Geisser estimates of sphericity (έ = .728). Min TTC was larger for the FCW group (F(1,28) = 17.1, p<.001), and increased with Exposure (F(1.5, 40.8) = 13.5, p < .001). As can be seen in Figure 9 below, there was also an interaction between Exposure and FCW (F2,56) = 15.3, p < .001). A test of simple effects of FCW within each level of Exposure shows a significant difference in exposures 3 and 5 (p < .001 for both) but not in exposure 1 (p = .839). Also, separate tests of exposure effects in the FCW and baseline groups showed that Min TTC does not change significantly with exposure in the baseline group (p = .687), but does so in the FCW group (F 1.5, 22.1) = 18.0, p < .001), df GG corrected (έ = .736). Thus, as with TTC at response, the minimum adopted TTC was only affected for the FCW group over repeated exposures. There was also a near significant main effect of ITHW (p = .051).
Figure 9 Average Minimum Time-To-Collision (TTC) for drivers with and without FCW as a function of repeated exposure, divided by long and short initial time headway (ITHW).
4.5
Performance on the visual distraction task (correct numbers)
Figure 10 shows the results for performance on the visual distraction task, i.e. averages on correctly read numbers from the in-vehicle display (maximum 6 correct per task). Drivers with FCW read significantly fewer correct numbers than baseline drivers (F(1, 31) = 13.9, p = .001), more numbers were correctly read in the long than the short ITHW condition F(1, 31) = 9.14, p = .005), and repeated exposure led to fewer numbers being correctly read (F(2, 62) = 11.6, p < .001).There were also significant interactions. First, while the FCW group showed a similar average of correct numbers for short and long ITHW, baseline drivers read significantly more correct numbers in the long than in the short ITHW condition (F(1, 31) = 7.78, p < .01). In fact as can be seen in Figure 10, baseline drivers performed close to flawless in the long ITHW condition (maximum correct numbers is 6). Second, there was a significant three-way interaction between Exposure, FCW and ITHW (F(2,62) = 5.0, p = .01), indicating that the differences between FCW and baseline drivers over exposures follow a different pattern in long and short ITHW conditions. This can be seen Figure 10, and again is most likely due to the near perfect performance of baseline drivers in the long ITHW condition.
Figure 10 Averages of correctly read back numbers from the visual distraction task for drivers with and without FCW as a function of repeated exposure, divided by long and short initial time headway (ITHW). Maximum score is six correct numbers.
5
Discussion
The main objective of the present study was to examine the extent to which an FCW system affects braking and steering performance in emergency braking scenarios, and whether this effect (if any) is moderated by repeated scenario exposure.
In terms of the main objective, the results show a clear effect of FCW on response times. However, the results also demonstrate that this effect is the result of a relatively complex adaptation process that occurs over exposures and which seems to differ between baseline and FCW drivers.
To start with, response times and accelerator release times became significantly shorter with repeated exposure in both the FCW and baseline groups. This is in line with the results from Lee et al. (2002), and supports the hypothesis that drivers should respond faster and faster as events repeat due to increased expectancy. However, as the
significant interaction between FCW and Exposure for Response Time indicates, the rate of change is different between the two groups. This indicates that the effects of FCW and Exposure are not additive. This is in contrast to the findings of Lee et al. (2002). Moreover, the simple effects test of FCW within levels of Exposure showed no significant difference in Response times for the first exposure, only for the repeated exposures. It follows that the effect of FCW on Response Time only occurs in the repeated events. Moreover, once it occurs it is strong enough to produce an overall significant main effect of FCW “on top” of what could be expected in terms of an expectancy driven decrease in response times.
The magnitude of the differences is quite interesting. In the baseline group, the improvement in response time over exposures is approximately 500 ms. The scenario used thus seems to retain a relatively high degree of unexpectedness. In the FCW group however, the response times are on average more than a second faster than the baseline group in each repeated scenario, even when the baseline improvement is deduced. Now, if the scenario is constructed in a way which makes it difficult to identify
beforehand even in a state of heightened alertness (as baseline response times indicate), it follows that since the only difference between baseline and FCW group is the warning given, the presence of FCW must account for the substantially larger response time improvement in the FCW group after the first exposure.
These results may be interpreted in terms of a model where braking responses may either be triggered reactively by the visual looming cues coming from the optical expansion of the closing POV or, with repeated exposure, proactively, directly by the warning. The first corresponds to a closed loop response, based on the situation
criticality assessment that follows after looking up from the visual distraction task. The second represents an open loop response which occurs independently of a situation criticality assessment. It may be further assumed that closed-loop responses will not be triggered until sufficiently strong looming cues appear. It follows that closed-loop response times should be strongly determined by the initial time headway (as the initial headway determines the time until looming cues are reached; see Engström, 2010), while open-loop responses should be strongly determined by when the warning is given. That there was no effect of FCW on response times in the first event is most likely due to the fact that the drivers in the FCW group were completely naive to FCW. This means that prior to the first critical event, they neither knew that the vehicle was equipped with a warning system nor had they any previous experience of similar
systems. Thus they had not yet formed any connection between the warning and the type of event that could guide their warning interpretation and lead to a faster response. Following the model, the response times of both FCW and baseline drivers in the first exposure seems mainly determined by when they encountered sufficiently strong looming cues to trigger a braking or steering response. This is supported by fact that response times were highly correlated to ITHW for both FCW and baseline drivers in the first exposure. Drivers in the long ITHW condition responded ~800 ms slower than those in the short condition, a value that closely corresponds to the actual 1000 ms difference between the two ITHW conditions.
With repeated exposure, both FCW and baseline drivers began to adopt more proactive, anticipatory, response strategies, with earlier release of the accelerator pedal and earlier braking/steering response initiation. However, the way this change manifests itself differed strongly between the two groups. The effect of exposure on response time is much larger for FCW drivers, as can be seen in Figure 5, while baseline drivers continue to show different response times depending on ITHW. This ITHW driven difference disappears for FCW drivers in exposures three and five.
This indicates that at least some FCW drivers were adopting more of an open-loop strategy, i.e. they switched from responding to the looming cues of the braking POV to responding directly to the warning. While it is difficult to assess the exact extent of this switch, the qualitative results (Table 5) show that several FCW drivers who looked up prior to braking in the first event instead braked immediately when the warning came without looking up from the visual distraction task when events started to repeat. It is important to point out that a prerequisite for response time improvement through open loop responses is warning timing. If a warning is issued at the same time as looming cues are becoming critically strong, it does not matter whether you respond to the warning or the looming cues, response times should still be similar. In this study however, the warning was issued close in time to POV brake onset, i.e. when the relative speed between SV and POV was small and looming cues limited. The room for improving response time relative to baseline drivers by switching to an open loop response was thus relatively large.
Phrased somewhat differently, if FCW drivers trust the system and respond to it immediately, their measured response times will reflect when the warning is given rather than when they reach their comfort zone boundary in relation to the available safety margin. This means that if the warning comes late in relation to when the lead vehicle starts braking and the safety margin is small (i.e. initial time headway is short), there is not much to gain in terms of response time improvement by responding directly to the warning. On the other hand, if the warning comes early in relation to lead vehicle braking and the available safety margin is large (initial time headway is long), the possibilities for improvement by responding directly to the warning is much larger (see Figure 11 below).
Figure 11 Comparing the room for improvement due to FCW when initial time headway is short and warning onset is late (upper illustration) and when initial time headway is long and warning onset is early (lower illustration).
Coming back to the alteration in strategy by FCW drivers, i.e. that several of them seem to move towards an open loop type of response is also reflected in the measures of safety margins. For FCW drivers, both TTC at response and min TTC increase significantly with exposure, presumably reflecting their increasing reliance on the warning rather than looming cues for event response. Also, FCW drivers show simple effects of ITHW within levels of Exposure for both TTC at response and min TTC in exposures three and five. This is as expected. The warning timing was relatively independent of ITHW, i.e. it came ~200 ms later in the long ITHW scenario (to be compared to the 1000 ms difference in ITHW). Given that FCW drivers’ responses reflect warning timing rather than looming cues, the difference between long and short ITHW should be reflected in the TTC measurements.
Baseline drivers on the other hand show much less improvement over exposure in TTC at response, no improvement in min TTC over exposure, and no effect of ITHW. This supports the idea that for closed-loop responses, the adopted safety margins should remain relatively independent of initial time headway (since sufficient looming cues will be reached at approximately the same TTC regardless of initial time headway). Thus, while baseline drivers start responding somewhat earlier with each exposure due to expectancy effects (as indicated by the increase in Min TTC at response), they continue to rely on looming cues to resolve the event, which means that they end up at similar nearest points in time and space to the lead vehicle in each event.
In terms of performance on the visual distraction task, one would expect the warning to make FCW drivers quit the distraction task earlier than the baseline drivers. This should hold for all exposures, even if the FCW drivers’ actual brake responses in the first exposure were determined by POV looming cues rather than by the warning. This expectation is generally supported by the data, i.e. the FCW drivers read significantly