Technical Bulletin TB04-05 November 2004
ricultural
Ag
Experiment Station
College of Agricultural Sciences Department of Soil and Crop SciencesDepartment of Bioagricultural Sciences
and Pest Management
Great Plains Systems Research Unit – USDA
Sustainable Dryland
Agroecosystem Management
D.G. Westfall G.A. Peterson F.B. Peairs L. Sherrod D.Poss T. Shaver K. Larson D.L. Thompson L.R. Ahuja M.D. Koch C.B. Walker2004
SUSTAINABLE DRYLAND AGROECOSYSTEM MANAGEMENT1
D.G. Westfall2 , G.A. Peterson2 , F. B. Peairs3 , L.Sherrod4 , D. Poss5 , T. Shaver5 K. Larson6 , D.L. Thompson5 , L.R. Ahuja7 , M.D. Koch5 , and C. B. Walker5 A Cooperative Project of the
Colorado Agricultural Experiment Station Department of Soil and Crop Sciences
Department of Bioagricultural Sciences and Pest Management Colorado State University
Fort Collins, Colorado and the
USDA - Agriculture Research Service Natural Resources Research Center Great Plains Systems Research Unit
Fort Collins, Colorado
1
Funding is provided by the Colorado Agricultural Experiment Station and USDA-ARS. The High Plains Regional Climate Center in Lincoln, NE provides weather data retrieval.
2
Professors, Department of Soil and Crop Sciences, Colorado State University, Fort Collins, CO 80523
3
Professor, Department of Bioagricultural Sciences and Pest Management, Colorado State University, Fort Collins, CO 80523
4
USDA-ARS Technician - Great Plains Systems Research Unit
5
Research Associates, Colorado State University
6
Research Scientist - Plainsman Research Center at Walsh, Colorado
7
USDA-ARS Research Leader - Great Plains Systems Research Unit
**Mention of a trademark or proprietary product does not constitute endorsement by the Colorado Agricultural Experiment Station** Colorado State University is an equal opportunity/affirmative action institution and complies with all Federal and Colorado State laws, regulations, and executive orders regarding affirmative action requirements in all programs. The Office of Equal Opportunity is located in 101 Student Services. In order to assist Colorado State University in meeting its affirmative action responsibilities, ethnic minorities, women, and other protected class members are encouraged to apply and to so identify themselves.
i Contents
Subject Pages
Research Application Summary 1-5
Concurrent Research Projects 5-8
Introduction 9
Materials and Methods 10-19
Section A
Dryland Cropping Systems Production Results for 2001
Results and Discussion 20-29
Climate 20
Wheat 20
Corn and Sorghum 21
Millett, Proso and Hay 22
Sunflower 23
Soybean 23
Forage Soybeans 23
Opportunity Cropping 23
Crop Residue Base 24
Nitrogen Content of Grain and Stover 25
Soil Nitrate-Nitrogen 26
Interaction of Cropping Systems with Pest and Beneficial Insects
Introduction 27
Materials & Methods 27
Results and Disussion - Entomological Data 28-29
Wheat 28
Aphids 28
Brown Wheat Mite 28
Other Pests 28
Predators 28
Pheromone Traps 28
Corn and Sorghum 29
Millet 29
Section B
Dryland Cropping Systems Production Results for 2002
Results and Discussion 30-33
Climate 30
Wheat 30
Corn and Sorghum 31
Soybean 32
Millet 32
Sunflowers 32
Residues 32
Nitrogen Content of Grain and Stover 33
Results and Discussion - Entomological Data 33-34
Wheat 33
Ahids 33
Brown Wheat Mite 33
Other Pests 34
Millett 34
Corn and Sorghum 34
Sunflower 34
References 35-36
Data Tables 37-92
Appendix I - Annual Herbicide Programs for Each Site 93-107
iii
List of Tables
Ta ble T itle Page
Table 1 - Elevation, long-term average annual precipitation, and evaporation characteristics for each site. 10 Table 2a - Cropping systems each of the original sites established in 1985 that were in place in 2001. 16 Table 2b - Cropping systems for each of the original sites established in 1985 that were in place in 2002. 17a Table 2c - Cropping systems for the three new sites initiated in 1997 that were in place in 2001 and 2002. 17b Table 3a - Crop variety, seeding rate, and planting date for each site in 2000-2001 season. 18 Ta ble 3 b - Cro p var iety, seed ing rate, a nd p lanting d ate for e ach site in 200 1-22 02 se ason . 19
Table 4 - Nitrogen fertilizer application by soil and crop for 2001. 37
Table 5a & 5b - Mo nthly precipitation for each site for the 2000-200 1 growing season. 38-39
Tab le 5c - 5h - Prec ipitation summaries b y growing seaso n segments. 40-42
Ta ble 6 a & 6 b - G rain an d stov er yields for whe at. 43-44
Table 7 - Wheat yields by rotation at optimum fertility by year and soil position at Sterling 1998-2001. 45 Table 8 - Wheat yields by rotation at optimum fertility by year and soil position at Stratton 1998-2001. 46 Table 9 - Wheat yields by rotation at optimum fertility by year and soil position at Walsh 1998-2001. 47 Table 10 - Wheat grain and straw yields by variety and rotation at Briggsdale, Akron, and Lamar in 2001. 48 Table 11a & 11b - Grain and stover yields for Corn and Sorghum in 2001. 49-50 Table 12 - Corn yields by rotation at optimum fertility by year and soil position at Sterling 1999-2001. 51 Table 13 - Corn yields by rotation at optimum fertility by year and soil position at Stratton 1999-2001. 52 Table 14 - Corn yields by rotation at optimum fertility by year and soil position at Walsh 1999-2001. 53 Ta ble 1 5 - Grain and stover yields for corn at Briggsdale & Akron, and Grain sorghum yields at Lamar in 2001. 54 Table 16 - Grain and stover yields for summer crops (other than corn) at Briggsdale and Akron in 2001. 54 Table 17a & 17b - Grain and stover yields for soybean at Sterling, Stratton and Walsh in 2001. 55-56 Table 18 - Grain and forage yields in the opportunity cropping system at Sterling. 57 Table 19 - Grain and forage yields in the opportunity cropping system at Stratton. 58 Table 20 - Grain and forage yields in the opportunity cropping system at Walsh. 59 Table 21 - Crop residue weights on all plots in wheat during the 2000-2001 cro p year. 60 Table 22 - Crop residue weights on all plots in Corn/Sorghum during the 2000-2001 crop year. 61 Table 23 - Crop residue weights on all plots in soybean during the 2001 cro p year. 62
Table 24 - Crop residues prior to planting from all crops at Briggsdale, Akron, and Lamar in 2001. 63 Table 25a - Total nitrogen content of WHEAT GRAIN in the 2000-2001 crop. 64 Table 25b - Total nitrogen content of WHEAT STRAW in the 2000-2001 crop. 65 Table 26a - Total nitrogen content CORN G RAIN or SORGHU M GR AIN in the 2001 crop. 66 Table 26b - Total nitrogen content of CORN STOV ER or SORGHU M STO VER in the 2001 crop. 67
Table 27a - Total nitrogen content of SOYBEAN G RAIN in the 2001 crop. 68
Table 27b - Total nitrogen content of SOYBEAN ST OVER in the 2001 crop. 69
Table 28 - Nitrate-N content of the soil profile at planting for each crop during the 2000-200 1 crop year. 70 Table 29 - Pest insects in wheat at Briggsdale, Akron & Lamar by day in 2001. 71 Table 30 - Predator insects in wheat at Briggsdale, Akron, & Lamar by day in 2001. 72 Table 31 - Pheromone trap catches for wheat insects at Briggsdale, Akron and Lamar in Fall 2001. 72 Table 32 - Pest insects in corn at Briggsdale & Akron and sorghum at Lamar in 2001. 73 Table 33 - Natural enemies of corn at Briggsdale & Akron and sorghum at Lamar in 2001. 74 Table 34 - Pheromone trap catches for corn insects at Briggsdale & Akron and sorghum insects at Lamar in 2001. 74 Table 35 - Pest insects in sunflowers at Briggsdale & Akron in 2001. 75 Table 36 - Pheromone traps catches for sunflowers at Briggsdale & Akron in 2001. 75
Table 37 - Nitrogen fertlizer application by soil and crop for 2002. 76
Tab le 38a & 38b - Mo nthly precipation for ea ch site for the 200 1-200 2 growing seasons. 77-78 Tab le 38c-38 h - Precipitation sum maries by gro wing season seg ments. 79-81
Table 39a & 39b - Grain and stover yields for WHEA T in 2002 82-83
Table 40a & 40b - Grain and stover yields for all crops in 2002. 84-85
Table 41a & 42 - Grain and stover yields for CORN and SORGHU M in 2002. 86-87 Table 43 - Crop residue weights from all crops during the 2001-2002 crop year. 88
Table 44a - Total nitrogen content of WHEAT GRAIN in 2002 crop. 89
Table 44b - Total nitrogen content of WHEAT STRAW in 2002 crop. 90
Table 45 - Pest insects in wheat by day in 2002. 91
Table 46 - Pest insects in corn or sorghum (Lamar) by day in 2002. 92
-1-Figure 1. The first 15 yr grain yields averaged over soil positions for all years each crop has been grown at a given location (wheat yields
RESEARCH APPLICATION SUMMARY
We established the Dryland Agroecosystem Project in the fall of 1985, and 1986 was the first crop year. Grain yields, stover yields, crop residue amounts, soil water measurements, and crop nutrient content have been reported annually in previously published technical bulletins. This publication covers the 2001 and 2002 grain yields, stover yields, crop residue amounts and N content of the crops and soil nitrate levels. A common introduction and materials and methods for these two years are presented, however, the production parameters mentioned above are presented by year, in two sections identified as Section A (2001) and Section B (2002) of this publication.
The following summary updates our findings over the past 18 years of the project. The long-term research objective of this project are to provide producers as well as to learn more about soil quality and carbon sequestration parameters, which have been the subject of several graduate students thesis. The data from the latter subjects are published in scientific journals and journal references are found at the end of this publication.
Average Yields:
Annual yield fluctuations concern growers because they increase risk. Stable yields translate into stable income levels in a producer’s operations. Figure 1 provides a summary of average yield history for wheat, corn, sorghum, and soybean at our three study locations for the first 15 yrs. Wheat has been grown every year at all sites, corn every year at Sterling, and sorghum every year at Walsh. Other crops have been grown for shorter periods of time. Complete data for each crop are available in previously published bulletins (see reference
section). Yields in Figure 1 are averaged over 15 years when a given crop was grown, even those where yield losses occurred due to hail, drought, early and late freezes, insect pests, winter kill of wheat, and herbicid carryover.
Figure 3. Annualized grain yield by system for each location averaged over the first 12 years of research.
Corn, Sorghum and Soybean Yields at Original Locations:
Fluctuations in corn and sorghum yields are of most interest because they represent the highest production input cost crops. Yields of all crops include hail and drought years over the last 18 yrs. The yields fluctuate markedly due to the climatic conditions that were outlined above. The last three years, drought has been of major concern resulting in “near” crop failures some years and some compete crop failures in 2002.
1) Corn yields at Sterling have averaged 58 bu/A (range = 0 to 107 bu/A). 2) Corn yields at Stratton have averaged 66 bu/A (range = 0 to 112 bu/A). 3) Corn yields at Walsh, using Bt varieties, averaged 57 bu/A from1997-2000
(range = 2 to 100 bu/A).
4) Grain sorghum yields at Stratton (5 years) averaged 44 bu/A (range = 3 to 71 bu/A). 5) Grain sorghum yields at Walsh averaged 42 bu/A (range = 3 to 71 bu/A).
6) Soybean yields have averaged 10 bu/A or less at all sites. We have concluded that the currently available soybeans varieties are not adapted to this environment.
Cropping Systems:
Over the long term of the project, the 3- and 4-year systems like wheat-corn(sorghum)-fallow and wheat-corn-millet-wheat-corn(sorghum)-fallow or wheat-sorghum-sorghum-wheat-corn(sorghum)-fallow increased annualized grain production by 74% compared to the 2-year wheat-fallow system during the first 12 years of our project (Figure 2). Yields are annualized to account for the nonproductive fallow year in rotation comparisons. Economic analyses show this to be a 25-40% increase in net annual income for the three-year rotation in northeastern Colorado. However, in southeastern Colorado the three year wheat-sorghum-fallow rotation, using stubble mulch tillage in the fallow prior to wheat planting, netted about the same amount of return as reduced till wheat-fallow. We need to
continue to investigate
systems using new
herbicide programs that
Our data show that cropping intensification is feasible and profitable in the central Great Plains. More intensive rotations like fallow and wheat-corn(sorghum)-millet-fallow have more than doubled grain water use efficiency. In years of limited rainfall, diversity is even more important by spreading the risk among different crops that may take advantage of rainfall in different times of the production year. Water storage in our limited rainfall environment as a result of no-till systems converts the limited moisture into increased grain production more effectively than a traditional stubble mulch tillage wheat-fallow system. However, the deletion of fallow also increases the risk of water deficit for the following crop. It is a management trade off between intensive cropping systems that result in increased return and production under the traditional tilled wheat-fallow system where risk due to moisture stress (drought) is less. However, government programs can affect management decisions greatly, particularly where producers have developed a good corn yield base.
Our opportunity cropping systems (essentially annual cropping systems with no fallow) have maximized production at all sites relative to all other rotations, but have not been the most profitable. The 3-year rotations have been most profitable. Based on our findings with the intensive systems from 1985 to 1997 (12 cropping seasons), we altered the systems in 1998 to determine how far we could go to minimizing fallow in our dryland cropping systems. More intensive cropping systems have been added and wheat-fallow has been omitted from the
experiments. We now consider the 3-year (wheat-corn or sorghum-fallow) system as the standard of comparison. In the last few years of the “drought”, some of these new more intensive cropping systems (continuous cropping) have not been successful. The main limitation has been lack of rain for germination of wheat in the fall and inadequate stored soil moisture due to the short time period available to store rain and snow water.
New Research Sites:
The dryland agroecosystem project established linkage with the Department of
Bioagricultural Sciences and Pest Management in 1997. We are now evaluating the interactions of cropping systems with both pest and beneficial insects at three new experimental sites. The new sites at Briggsdale, Akron, and Lamar also allow us to test our most successful intensive cropping systems at three new combinations of precipitation and evaporative demand and enabling us to study insect dynamics as influenced by cropping system. We want to know if the presence of multiple crops in the system will alter populations of beneficial insects and provide new avenues of insect pest control. Results are included in this report regarding the data from these new sites in 2001 and 2002.
Adoption of Intensive Cropping Systems:
Producers in northeastern Colorado have been adopting the more intensive cropping systems at an increasing rate since 1990, until 2002. The drought that started in September-October of 2001 has had an dramatic effect on dryland crop production in Colorado, as well as the Western Great Plains in general. The maximum dryland corn acreage in Colorado reached in 2001 with 305,000 acres. The drought that started in September-October of 2001 had a devastating effect on dryland crop yields in 2002, particularly summer crops. Colorado
Agricultural Statistic reported that there were only 55,000 acres of dryland corn harvested in 2001. However, many thousands of additional acres were planted and not harvested due to the
devastating effect of the drought on corn, and all summer crop, yields. In 2001, the state average dryland corn yield was 52 bu/A, while in 2002 it was 26 bu/A. Sunflower production followed the same trend, but not as dramatic as corn. In 2001 there were 182,000 acres of sunflower harvested with an average yield of 1,143 lb/A. In 2002, 130,000 were planted with 100,000 being harvested at an average yield of 630 lb/A. Corn is one of the principal crops grown in the more intensive systems; thus we use its acreage as an index of adoption rate by producers (see Table below). Since dryland corn is almost exclusively grown under no-till in a three or four year rotation, the actual acreage under intensive no-till dryland cropping systems is at least 3-4 times greater than the total dryland corn acreage. The average economic impact is an increased return to land, labor, capitol, and management of $14.85/acre (Kann et al., 2002), under an “average” rainfall environment.
Dryland Corn Acreage in Eight Northeastern Colorado Counties and state total from 1971 to 2002.
Year Eight NE Counties*
Total for State Acres 1971-1988 21,200 23,700 1989 27,000 28,000 1990 26,000 26,000 1991 32,500 33,000 1992 48,500 50,000 1993 79,000 90,000 1994 92,500 100,000 1995 95,500 100,000 1996 104,000 110,000 1997 138,500 150,000 1998 191,000 240,000 1999 220,000 290,000 2000 198,000 340,000 2001 233,000 305,000 2002 50,000 55,000
*Data from Colorado A gricultural Statistics (Adams, Kit Carson, Logan, M organ, Phillips, Sedgewick, Washington, Yuma)
The drought has had a dramatic effect on producers’ ability to operate under intensive no-till cropping systems management. Corn is a “high input” crop, compared to other dryland crops, therefore, inclusion of this crop into a cropping system under drought conditions increases the economic risk significantly. If farmers have a good proven yield goal they can still take the risk and plant corn and participate in the government programs to minimize economic risk.
Consequently, the 55,000 acres harvested in 2002 do not accurately reflect the adoption of intensive cropping systems. However, the drought has definitely had an impact on adoption. As the drought cycle swings back to a “normal” rainfall climate, adoption will increase the favorable economics of intensive cropping systems management along with its associated minimization of soil erosion by wind, which is a major concern to the long-term sustainability of the dryland system.
OTHER CURRENT RESEARCH PROJECTS
Triticale-Corn-Forage Soybean Rotation at Sterling: {Established in fall 1993}
Objective:
Maximize time in crop, provide both a cash crop (corn) and forage crops for a mixed livestock-grain farm. Land preparation costs would also be minimized. From 1993 - 1998 this rotation was triticale-corn-hay millet. Forage soybean replaced hay millet in 1999 in attempt to grow a sandbur free, higher protein forage.
Procedure:
i) Winter triticale is planted in September into the millet residue . In the following years it will be planted into soybean residue.
ii) Harvest winter triticale for forage in June before heading, leaving a 8-10 inch stubble. Roundup and Atrazine, applied after harvest.
iii) Corn planted no-till into triticale stubble the following May. iv) Corn is harvested in late September.
v) Forage soybean, was planted into corn stalks the following May and harvested in August.
Results:
i) Corn yields for the last 5 years in this rotation have averaged 22 bu/A. This has been caused by low precipitation. Prior to 2000 the average yield was 50 Bu/A including 1994, when no grain was produced due to dry weather, and including 1995, when the corn froze before maturity. In the last 6 years a Roundup Ready variety was grown to aid in sandbur control.
ii) Hay millet yields were non-harvestable in all years except 1997. The failures were primarily due to heavy sandbur infestations. We had to destroy the crop because sandbur populations were equal to the millet populations in most years. For this reason we chaged the summer forage crop to Round Up Ready soybean.
iii) Forage soybean hay yields in 2001 averaged 1.24 T/A over all soils. In 2002, no forage was harvested due to the drought.
iv) Triticale “Harvested” yields have averaged 1.73 T/A over the past 4 years (excluding 2002), even though we leave a 8-10" stubble remaining in the field for cover. In 2002, the stand was very poor due to lack of emergence due to the drought and the crop was killed with Roundup.
Summary:
Winter triticale seems to be a well adapted cool season forage crop. Although corn yields were greatly limited by lack of rainfall in 2001 and 2002. Corn following triticale should be equivalent to corn after wheat. The forage soybean has yielded relatively well in years where normal precipitation has been received, averaging 1.36 T/A until 2002, when no forage was harvested.
Triticale and corn grain yields by soil for 1998 -2002.
Year Crop Production Soil Positions
Summit Sideslope Toeslope Average ---Tons/A or
Bu/A---1998 Triticale Total 0.94 1.13 1.36 1.14
Harvested1 0.77 1.00 1.05 0.94
Corn Grain 64 64 88 72
Hay Millet Total 0 0 0 0
1999 Triticale Harvested1 1.64 1.17 1.92 1.58 Corn Grain 43 82 69 65 Soybean Forage @ 15% moisture 1.17 1.26 1.72 1.38 2000 Trticale Harvested1 2.82 2.47 2.86 2.72 Corn Grain 18 18 24 20 Soybean Forage @ 15% moisture 1.60 1.39 1.35 1.45 2001 Triticale Harvested1 1.38 1.28 2.48 1.71 Corn Grain 32.5 25.2 52.8 37 Soybean Forage @ 15% moisture 1.28 1.14 1.29 1.24 2002 Triticale Harvested1 0 0 0 0 Corn Grain 0 0 0 0 Soybean Forage @ 15% moisture 0 0 0 0
1 Harvested leaving 8" stubble;
Experiment Managers:
Soybean Variety and Plant Population Trials at Sterling and Stratton
Background:
Our interest in soybeans stems from our search for a crop we could harvest and immediately plant winter wheat, thus avoiding fallow. Soybean has the potential to be one of the crops that might fit the system. It has the following attributes:
1. Local market probable 2. Broadleaf plant for rotation 3. Roundup Ready (sandbur control)
4. Fits rotation (plant wheat after soybean harvest) 5. Use same planting and harvesting equipment as wheat
6. Economic potential good (Expected yields 20-25 bu/A and low fertilizer cost) Objectives:
1) To determine the yield potential of dryland soybean varieties in eastern Colorado 2) To observe growth characteristics and potential harvest dates.
3) To determine appropriate plant populations for soybeans in NE Colorado Procedure:
Planting Method:
Row planted in 30" row spacing Varieties:
Asgrow 2202, 2602, 2703, and 3003 Populations:
90,000, 135,000, and 180,000 seeds/A Planting and Harvesting Dates:
Sterling = 11 June and 11 October 2001 Stratton = 6 June and 2 October 2001 Results:
Soybean grain yields averaged over varieties, plant populations and locations were a
disappointingly low; 7 bu/A as shown in the following tables. At Sterling the longer season Asgrow 3303 had the highest yields at all plant populations, while at Stratton the shorter season Asgrow 2703 had the highest yields.
Plant population did not appear to affect yield of any variety at either location. Averaged over all varieties at both locations the yields were 7.3, 7.1, and 7.3 bu/A for the 90,000, 135,000 and 180,000 plant/A populations respectively.
Rainfall in August, the critical month for soybean was 1.33 and 0.82 inches for Sterling and Stratton respectively, which was well below the long-term average August precipitation of 1.9 and 2.6 inches for the two locations. Obviously grain yields were adversely affected by the below normal August precipitation. Because soybean grain yield is so dependent on August rainfall and because rainfall is highly variable in the West Central Great Plains, it does not appear that soybean is a good option for the area.
Soybean grain yields by variety and plant population at Sterling Colorado in 2001.
Variety Population Yield (13% moisture)
Seeds/A — Bu/A— Asgrow 2202 90,000 5.4 135,000 6.5 180,000 7.1 Asgrow 2602 90,000 7.2 135,000 6.9 180,000 6.8 Asgrow 2703 90,000 7.0 135,000 9.1 180,000 6.4 Asgrow 3003 90,000 10.6 135,000 12.3 180,000 11.8
Soybean grain yields by variety and plant population at Stratton Colorado in 2001.
Variety Population Yield (13% moisture)
Seeds/A — Bu/A— Asgrow 2202 90,000 5.0 135,000 4.0 180,000 5.4 Asgrow 2602 90,000 9.1 135,000 6.5 180,000 4.8 Asgrow 2703 90,000 9.5 135,000 6.3 180,000 11.1 Asgrow 3003 90,000 4.5 135,000 5.1 180,000 5.0
Soybean grain yields averaged by plant population and location in 2001.
Plant Population Yield (13% moisture)
—
Bu/A---90,000 7.3
135,000 7.1
180,000 7.3
Soybean grain yields averaged by variety and location in 2001.
Variety Yield (13% moisture)
—
Bu/A---Asgrow 2202 5.6
Asgrow 2602 6.9
Asgrow 2703 8.2
Asgrow 3003 9.2
INTRODUCTION
Colorado agriculture is highly dependent on precipitation from both snow and rainfall. In the dryland environment each unit of precipitation is critical to production. At Akron each additional inch (25 mm) of water above the initial yield threshold translates into 4.5 bu/A of dryland winter wheat (12 kg/ha/mm), consequently profit is highly related to water conservation (Greb et al., 1974). These data point to the need for maximum precipitation use efficiency in this semi-arid cropping environment and the importance of this project to our producers.
Our research project was established in 1985 to identify systems that maximize efficient water use under dryland conditions in Eastern Colorado. A more comprehensive justification for its initiation can be found in Peterson, et al. (1988). A summary of our general understanding of the climate-soil-cropping systems interactions can be found in a recent publication by Peterson and Westfall (2004).
The general objective of the project is to identify no-till dryland crop and soil management systems that will maximize water use efficiency of the total annual precipitation and economic return.
Specific objectives are to:
1. Determine if cropping sequences with fewer and/or shorter summer fallow periods are feasible.
2. Quantify the relationships among climate (precipitation and evaporative demand), soil type and cropping sequences that involve fewer and/or shorter fallow periods. 3. Quantify the effects of long-term use of no-till management systems on soil structural
stability, micro-organisms and faunal populations, and the organic C, N, and P content of the soil, all in conjunction with various crop sequences.
4. Identify cropping or management systems that will minimize soil erosion by crop residue maintenance.
5. Develop a data base across climatic zones that will allow economic assessment of entire management systems.
Peterson, et al. (1988) document details of the project in regard to the "start up" period and data from the 1986-87 crop year. Results from the 1988 - 1999 crop years were reported by Peterson, et al. (1989, 1990, 1991, 1992, 1993, 1994, 1995, 1996, 1997, 1998, 1999, 2000 and 2001). As in previous bulletins, only annual results are presented with a few summary tables. We do not draw major conclusions based on one year crop responses because cropping systems are highly time and weather dependent. Other publications, such as Wood, et al. (1990), Croissant, et al. (1992), Peterson, et al. (1993a & 1993b), Nielsen, et al. (1996), Farahani, et al. (1998),
Peterson and Westfall (2004), summarize and draw conclusions based on a combination of years. Long-term (18 yr) averages of summer crops, corn and sorghum, are58, 66 and 42 bu/A for Sterling(corn), Stratton(corn) and Walsh(sorghum), respectively. These average yields include years of near crop failure due to drought, hail, and early frost. Our research has shown that cropping intensification is certainly possible and profitable in the central Great Plains. More intensive rotations like wheat-corn(sorghum)-fallow have increased grain water use efficiency by 27%, compared to wheat-fallow, while the 4-year systems like wheat-corn-millet-fallow have increase water use efficiency by 37% (Peterson and Westfall, 2004). Water conserved in the
no-
-10-till systems has been converted into increased grain production. Furthermore, our opportunity cropping systems have maximized production at all sites relative to all other rotations. Based on findings from1985 to 1997, we altered the systems in an attempt to determine the minimum amount of fallow that would be sustainable in this dryland environment. Wheat-fallow was omitted from the experiments, and we consider the 3-year (wheat-corn(sorghum)-fallow) system as the standard of comparison.
The dryland agroecosystem project established a linkage with the Department of Bioagricultural Sciences and Pest Management in 1998. We are evaluating the interactions of cropping systems with both pest and beneficial insects at three new experimental sites, Briggsdale, Akron, and Lamar, CO. This also allows us to test our most successful intensive cropping
systems at three additional combinations of precipitation and evaporative demand. Compared with the original three experiments, these locations have much larger experimental units, enabling us to study insect dynamics as influenced by cropping system. We want to know if the presence of multiple crops in the system will alter populations of beneficial insects and provide new
avenues of biological pest management of Russian Wheat Aphid in wheat and insect pests in other crops. Details of cropping system changes at the original sites and the treatments at the new sites are explained in the methods section of this report.
MATERIALS AND METHODS
From 1986 -1997 we studied interactions of climate, soils and cropping systems at three sites, located near Sterling, Stratton, and Walsh, in Eastern Colorado, that represent a gradient in potential evapotranspiration (PET) (Fig. 3). Elevation, precipitation and evaporative demand are shown in Table 1. All sites have long-term precipitation averages of approximately 16-18 inches (400-450 mm), but increase in PET from north to south. Open pan evaporation is used as an index of PET for the cropping season.
Table 1. Elevation, long-term average annual precipitation, and evaporation characteristics for each site.
Site Elevation Annual
Precipitation1
Growing Season Open Pan Evaporation2
Deficit (Precip. - Evap.)
--Ft. (m) -- ---In. (mm) --- ---In. (mm) --- In. (mm)
Briggsdale 4850 (1478) 13.7 (350) 61 (1550) - 48 (- 1220) Sterling 4400 (1341) 17.4 (440) 63 (1600) - 45 (- 1140) Akron 4540 (1384) 16.0 (405) 63 (1600) - 47 (- 1185) Stratton 4380 (1335) 16.3 (415) 68 (1725) - 52 (- 1290) Lamar 3640 (1110) 14.7 (375) 76 (1925) - 62 (- 1555) Walsh 3720 (1134) 15.5 (395) 78 (1975) - 61 (- 1555)
-11-Figure 3. Experimental design with climate, soil, and cropping system variables.
Each of the original three sites (Sterling, Stratton, Walsh) was selected to represent a catenary sequence of soils common to the geographic area. Textural profiles for each soil at each location are shown in Figures 4a, 4b, and 4c. There are dramatic differences in soils across slope position at a given site and from site to site. We will contrast the summit soils at the three sites to illustrate how different the soils are. Each profile was described by NRCS personnel in summer 1991. Note first how the summit soils at the three sites differ in texture and horizonation. The surface horizons of these three soils (Ap) present a range of textures from loam at Sterling, to silt loam at Stratton, to sandy loam at Walsh. Obviously the water holding capacities and infiltration rates differ. An examination of the horizons below the surface reveals even more striking
differences.
The summit soil profile at Sterling (Figure 4a) changes from a clay content of 21% at the surface(Ap) to 31% in the 3-8" depth (Bt1) to a clay content of 38% in the layer between the 8-12" depth (Bt2). At the 12" depth the clay content drops abruptly to 27%. The water infiltration in this soil is greatly reduced by this fine textured layer (Bt2). At about the 36" depth (2Bk3) there is an abrupt change from 21% clay to 32% clay in addition to a marked increase in lime content. The mixture of 32% clay and 45% sand with lime creates a partially cemented zone that is slowly permeable to water, but relatively impermeable to roots. Profile plant available water holding capacity is 9" in the upper 36 inches of the profile.
-15-At Stratton the summit soil profile (Figure 4b) is highest in clay at the surface, 34% in the Ap horizon, and then decreases steadily to 14% clay (Bk3) below the 40" depth. There are few restrictions to water infiltration at the surface nor to roots anywhere in the profile compared to the summit soil at Sterling. Profile plant available water holding capacity is 12" in the upper 72 inches of soil.
The summit soil at Walsh (Figure 4c) has very sandy textures above 54" compared to either summit soil at the other sites. No restrictions to water infiltration nor root penetration occur in the profile. In this soil the abrupt increase in clay content at 54", 40% in the Btkb horizon represents a type of “plug” in the soil profile. Water can infiltrate rapidly in the coarse-textured surface horizons, but does not drain rapidly beyond the root zone due to the high clay content of the deepest horizon at 54". This makes this soil more productive than a similar soil with no clay “plug”. The profile plant available water holding capacity is 11". About 2" of the total is in the 5-6' depth, leaving only a 9" storage capacity in the upper 5' of soil.
Many other soil contrasts can be observed by the reader, both within and across sites. All of these soils had been cultivated for more than 50 years, and all exhibit the effects of both wind and water erosion damage. The toeslopes are the recipients of soil materials from the summit and sideslope positions because of their landscape location relative to the others. Hence they also have the highest organic matter content in their surface horizons.
Soil profile characteristics for the three new locations are only available on a general basis. The soil type at Briggsdale and Akron is a Platner loam and at Lamar it is a Wiley silt loam.
The cropping system during the previous 50 years had been primarily dryland wheat-fallow with some inclusion of grain sorghum at Walsh and corn at Sterling. At the original sites we placed cropping system treatments over the soil sequence (Fig.3) to study the interaction of systems and soils. At the three new sites we have only one soil type at each. Cropping systems that were in place in 2001 and 2002 at the initial three sites established in 1985 are shown in Table 2a and 2b. Cropping systems for the three new sites (Briggsdale, Akron, and Lamar) initiated in 1997 that were in place in 2001 and 2002 are shown in Table 2c. Soybeans were replaced by millet in the systems at Sterling and Stratton in 2002 because of the poor performance of soybeans in this environment. The crops grown in the opportunity systems for each site are shown at the bottom of Table 2b. Both forage and grain crops have been grown over the years in this cropping system. All sites are managed with no-till techniques, and herbicide programs are reported in Appendix Tables A1-12. Complete details on measurements being made and reasons for treatment choices are given by Peterson, et al. (1988). Crop variety, planting rate, and planting date for each crop at each site are given in Tables 3a and 3b for 2001 and 2002, respectively.
Nitrogen fertilizer is applied annually in accordance with the NO3-N of the soil profile (0-6
ft or 0-180 cm), soil organic matter content before planting, and expected yield on each soil position at each site. Therefore, N rate changes by year, crop grown, and soil position and the N rates at Sterling, Stratton and Walsh are given in Table 4 for 2001 and Table 37 for 2002. Nitrogen fertilizer for wheat, corn, and sunflower was dribbled on the soil surface over the row at planting time at Sterling and Stratton. Zinc (1 lb/A) was applied to the corn with the P fertilizer. Nitrogen on wheat at Walsh was topdressed in the spring, and N was sidedressed on corn and sorghum. We made all N applications as a 32-0-0 solution of urea-ammonium nitrate. The same procedures was used for fertilization at Briggsdale. However, at Lamar commercial applicators or large plot
-16-equipment is used to apply the fertilizer at these locations.
Phosphorus management is one of the experimental variables at Sterling, Stratton and Walsh. Consequently, we band applied P (10-34-0) at planting near the seed. Phosphorus is applied on one-half of each corn and soybean plot over all soils, but applied to the entire wheat plot when a particular rotation is in wheat. The rate of P is determined by the lowest soil test on the catena, which is usually found on the sideslope position. This rate has been 20 lbs P2O5/A (9.5
kg/ha of P) at each site each year thus far. We changed the P fertilization treatment for wheat in fall 1992, so that the half plot that had never received P fertilizer in previous years is now treated when planted to wheat. This was required because low P availability was resulting in poor wheat stands. Other crops in the rotation only receive P on the half plot designated as NP. Zinc (0.9 lbs/A or 1 kg/ha) is banded near the seed at corn planting at Sterling, Stratton, and Briggsdale to correct a soil Zn deficiency.
Table 2a. Cropping systems for each of the original sites established in 1985 that were in place in 2001. Site Rotations Sterling 1) Wheat-Corn-Fallow (WCF) 2) Wheat-Corn-Soybean (WCSb) 3) Wheat-Wheat-Corn-Soybean (WW CSb) 4) Opportunity Cropping* 5) Perennial G rass Stratton 1) Wheat-Corn-Fallow (WCF) 2) Wheat-Corn-Soybean (WC Sb) 3) Wheat-Wheat-Corn-Soybean (WW CSb) 4) Opportunity Cropping* 5) Perennial G rass W alsh 1) Wheat-Sorghum-Fallow (WSF) 2) Wheat-Corn-Soybean (WC Sb) 3) Wheat-Wheat-Sorghum-Soybean (WW SSb) 4) Continuous Row Crop (Alternate corn & sorghum) 5) Opportunity Cropping*
6) Perennial G rass
*
Opportunity cropping is designed to be continuous cropping without fallow, but not monoculture.
We measure soil water with the neutron-scatter technique. Aluminum access tubes were installed, two per soil position, in each treatment at each original site in 1988. These tubes are not removed for any field operation and remain in the exact positions year to year. Precautions are taken to prevent soil compaction around each tube. By not moving the tubes over years we get the best possible estimates of soil water use in each rotation. Soil water measurements are made on all soils and rotations at planting and harvest of each crop, which also represents the beginning and end of non-crop or fallow periods. At the new sites soil samples are taken for gravimetric water measurements at crop planting. We do not present the soil water data in this report for 2001 and 2002.
Table 2b. Cropping systems for each of the original sites established in 1985 that were in place in 2002. Site Rotations Sterling 1) Wheat-Corn-Fallow (WC F) 2) W h ea t-C orn -M ille t (W C M ) 3 ) W h ea t-W h ea t-C orn -M ille t (W W C M ) 4) Opportunity Cropping* 5) Perennial G rass Stratton 1) Wheat-Corn-Fallow (WCF) 2 ) W h ea t-C orn -M ille t (W C M ) 3 ) W h ea t-W h ea t-C orn -M ille t (W W C M ) 4) Opportunity Cropping* 5) Perennial G rass W alsh 1) Wheat-Sorghum-Fallow (WSF) 2) Wheat-Corn-Mung Bean (WCB) 3) Wheat-Wheat-Sorghum-Mung Bean (WW MB) 4) Continuous Row Crop (Alternate corn & sorghum) 5) Opportunity Cropping*
6) Perennial G rass
*
Opportunity cropping is designed to be continuous cropping without fallow, but not monoculture. *Opportunity Cropping History
Year Site
Sterling Stratton Walsh
1985 Wheat Fallow Sorghum 1986 Wheat Wheat Sorghum
1987 Corn Sorghum Millet
1988 Corn Sorghum Sudex
1989 Attempted Hay Millet Attempted Hay Millet Sorghum
1990 Wheat Wheat Attempted Sunflower
1991 Corn Corn Wheat
1992 Hay Millet Hay Millet Corn
1993 Corn Corn Fallow
1994 Sunflower Sunflower Wheat
1995 Wheat Wheat Wheat
1996 Corn Corn Fallow
1997 Hay Millet Hay Millet Corn
1998 Wheat Wheat Sorghum
1999 Corn Corn Corn
2000 Austrian Winter Pea Austrian Winter Pea Soybean
2001 Wheat Wheat Sorghum
-17b-Table 2c. Cropping systems for the three new sites initiated in 1997 that were in place in 2001 and 2002.
Site Rotations
Brig gsda le 1) Wheat-Fallow (WF)
2) Wheat-Hay Millet-Fallow (WHF) 3) Wheat-Wheat-Corn-Soybean-Sunflower-Pea (WW CSbSfP) 4) O ppo rtunity* Akron 1) Wheat-Fallow (WF) 2) Wheat-Corn-Fallow (WCF) 3) Wheat-Corn-Millet (Proso)-Fallow (WCM F) 4) Wheat-Corn-Millet (P ro so ) (W C M ) Lamar 1) Wheat-Fallow (WF) 2) Wheat-Sorghum-Fallow (WSF) *
Table 3a. Crop variety, seeding rate, and planting date for each site in 2000-2001 season.
Site Crop Variety Seeding Rate Planting Date Harvest Date
Briggsdale Wheat (fallow & other)
Lamar & Prowers99 60 lbs/A & 60 lbs/A 9/28/00 7/16/01
Corn NK4242 15,000 seeds/A 5/1/01 10/22/01
Hay Millet Golden German 10 lbs/A 6/15/01 8/20/01
Sunflower Triumph 765C 21,000 seeds/A 6/1/01 10/22/01
Soybean Asgrow 3901 90,000 seeds/A 5/24/01 9/13/01
Forage Pea Austrian winter 90 lbs/A 11/9/00 6/26/01
Sterling Wheat Prairie Red 60 lbs/A & 90 lbs/A 10/3/00 7/13/01
Corn 18,000 seeds/A 5/14/01 10/18/01
Soybean 90,000 seeds/A 6/11/01 10/11/01
Akron Wheat P.R. & Tam 107 60 lbs/A 10/13/00 7/17/01
Corn Dekalb DK5333RR 16,600 seeds/A 5/19/01 10/22/01
Proso Sunup 15 lbs/A 6/15/01 9/24/01
Sunflower Triumph 765 16,600 5/19/01 10/30/01
Stratton Wheat Prairie Red 60 lbs/A & 90 lbs/A 10/2/00 7/15/01
Corn 18,000 seeds/A 5/15/01 10/29/01
Soybean 90,000 seeds/A 6/4/01 10/2/01
Lamar Wheat Tam 107 & Prairie
Red
60 lbs/A 11/1/00 7/9/01
Sorghum Cargill 627 45,000 seeds/A 6/13/01 11/2/01
Walsh Wheat Prairie Red 50 lbs/A 9/30/00 7/12/01
Sorghum Cargill 627 40,000 seeds/A 6/1/01 10/26/01
Corn Dekalb DK 520Y6RR 19,000 seeds/A 6/1/01 10/9/01 Soybean Asgrow AG 3903 RR 110,000 seeds/A 6/1/01 10/10/01
-19-Table 3b. Crop variety, seeding rate, and planting date for each site in 2001-2002 season.
Site Crop Variety Seeding Rate Planting Date Harvest Date
Briggsdale Wheat (fallow & other)
Yuma & Yumar 60 lbs/A & 60 lbs/A 9/19/01 7/18/02
Corn Pioneer 3893
Dekalb 39-47
15,000 seeds/A 6/6/02 No harvest
Hay Millet Golden German 10 lbs/A 6/15/02 8/10/02
Sunflower Cargill 187 14,000 seeds/A 6/7/02 No harvest
Grain Sorghum Dekalb 48E 35,000 6/7/02 No harvest
Sterling Wheat Prairie Red 60 lbs/A & 90 lbs/A 9/24/01 7/10/02
Corn Dekalb DK4628 RR 18,000 seeds/A 5/15/02 none
Proso millet Huntsman 12 lbs/A 6/1/02 none
Akron Wheat P. R. & Tam 107 60 lbs/A 10/29/01 7/3/02
Corn DK 520 RR 17,200 seeds/A 5/20/02 no harvest
Proso Sunup 12 lbs/A 6/13/02 no harvest
Sunflower Triumph 765 17,200 6/10/02 9/27/02
Stratton Wheat Prairie Red 60 lbs/A & 90 lbs/A 9/25/01 7/9/02
Corn Dekalb DK4628 RR 18,000 seeds/A 5/21/02 None
Proso millet Huntsman 12 lbs/A 6/2/02 None
Lamar Wheat Tam 107 &
Prairie Red
40 lbs/A 9/16/01 No Crop
Sorghum Not planted
Walsh Wheat Prairie Red 50 lbs/A 10/2/01 None
Sorghum Mycogen 627 40,000 seeds/A 6/20/02 11/18/02
Corn DK 520 Y1 Bt 19,000 seeds/A 6/20/02 None
SECTION A
DRYLAND CROPPING SYSTEMS PRODUCTION RESULTS FOR
2001
RESULTS AND DISCUSSION Climatic Data
Precipitation at Sterling, Stratton and Walsh was near normal for the period July 2000 through June 2001. The last six months of 2000 is the time that precipitation is critical for the following year’s wheat crop. It is also a period to begin storing soil water for the summer crops that will be planted in the spring of 2001 such as corn, soybean, sunflower, and millet. Sterling, Stratton, and Walsh received 8.24, 7.10, and 8.95 inches during this period, respectively (Table 5a). The first six months of 2001 was slightly below normal at Sterling and Stratton and above normal at Walsh. Precipitation amounts the last six months of 2001 were near normal at Sterling and Stratton and only 38% of normal at Walsh.
Precipitation amounts at the three new sites for the last six months of 2000 was 31%, 119%, and 50% of normal at Briggsdale, Akron, and Lamar, respectively (Tables 5b). All sites were near or above normal the first six months of 2001. However, the last six months of 2001 Briggsdale and Lamar were below normal at 71% and 58% of normal while Akron was 112% of normal. As a result of Akron receiving more precipitation during this time, the crop yields at Akron were much better than the crop yields at Briggsdale or Lamar.
July and August rainfall are critical for production of corn, sorghum, and soybean. At Sterling, Walsh, Briggsdale, and Lamar (July + August) rainfall was below normal while it was near normal at Stratton and Akron. (Table 5a & 5b). Therefore, summer crops were moisture stressed at four of the six sites.
Precipitation data for the growing season for corn and wheat at all six sites are shown in Tables 5c-h, starting with the year each site was initiated. These data are divided into the
vegetative and reproductive growth stages. Considerable deviations from the average precipitation occurred, however no general trend for above normal or below normal precipitation occurred when all sites are considered in 2001.
Wheat
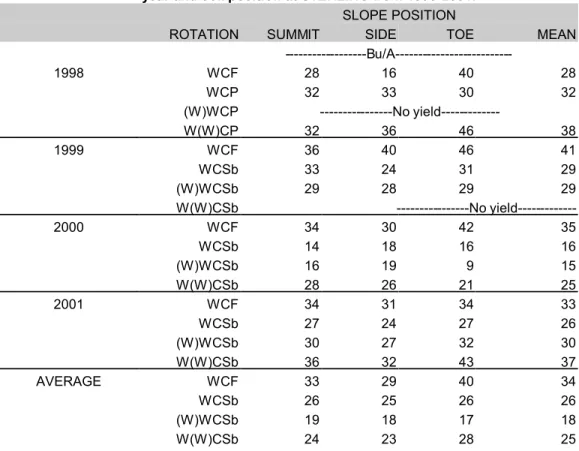
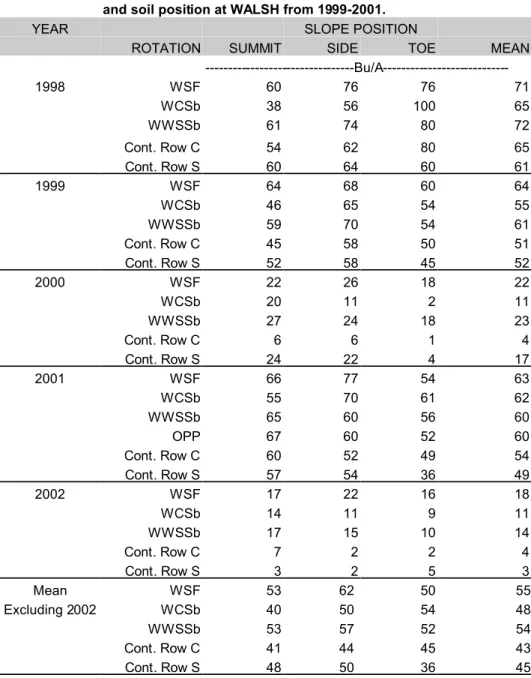
Wheat yields in the year 2001 for each site, soil and cropping system combination are shown in (Tables 6 and 10). A more meaningful long-term comparisons of cropping systems since initiation of the new cropping systems at Sterling, Stratton and Walsh are summarized in Tables 7-9. These data are a summary of yields from the plots in the rotation that recived N and P fertilizer every year. Wheat yield after fallow in the WCF system at Sterling was near the average for 1998-2001, averaging 33 bu/A (Table 7), while at Stratton the yields were higher than the average, 40 and 46 bu/A on the summit and side slope positions (Table 8). The wheat on the toe slope lodged due to a flood event that swept through this area, but yields would have been excellent if they could have been harvested. At Walsh (Table 9) in the WSF system, the 2001 yields were above average, ranging from 28 on the summit to 48 bu/A on the toe slope position. Walsh received 11.9 inches of rain from January to June, 2001 (Table 5a), as compared to a long term average of 7.5 inches,
thus accounting for the above average yields. The rainfall for this same period at Sterling and Stratton was 1 and 1.6 inches below normal, respectively. Precipitation during fallow before wheat seeding was near normal at all locations except July at Sterling. Only 1 inch of precipitation was received during July 2000, as compared to a normal of 3.32 inches.
At Sterling, Stratton and Walsh, wheat yields inthe more intensive systems that do not have a fallow, WCSb and first year wheat in (W)WCSb, ranged from 20 to 34 bu/A (Tables 7-9). The 2001 yields were much better than the 2000 yields, due to more favorable precipitation. Average wheat yields (averaged over soils) in these more intensive WCSb and (W)WC(S)Sb that do not include fallow were 28, 26 and 25 bu/A for Sterling, Stratton, and Walsh, respectively (not including the lodged plots at Stratton). However, wheat yields in the WCF (rotation includes a fallow before wheat) were 33, 35, and 38 bu/A at the corresponding sites. In 2000 we observed an average 38% yield reduction in plots that did not include a fallow before wheat (WC(S)Sb and (W)WC(S)Sb) as compared to wheat after fallow (WCF), in 2001 this reduction in wheat yields averaged 25%. There is a yield sacrifice in these more intense systems. Yields of second year wheat in the W(W)C(S)Sb system averaged more than the yields of first year wheat and Walsh and less at Stratton. No logical relationships between moisture and yield differences are obvious (Tables 5a and 7-9).
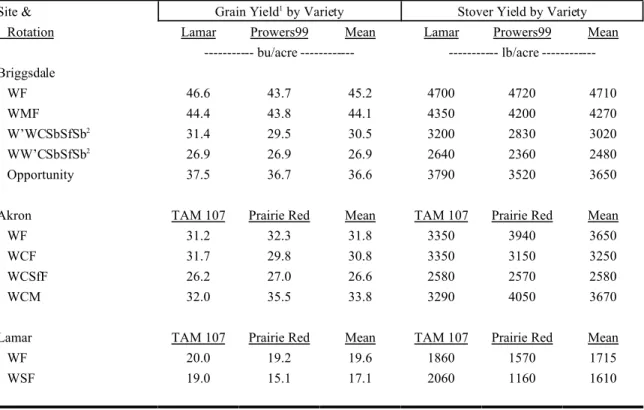
Wheat yields were good at Briggsdale due to the favorable spring precipitation. Grain yields averaged 37 bu/ac over all rotations and varieties (Table 10). Lamar and Powers99 yielded essentially the same. Lamar and Prowers99 are genetically similar except for the Russian Wheat Aphid (RWA) resistant gene. Rotations that had fallow before wheat had the highest yields (Table 10), which is expected. Some anomalies in yields of the (W)WCSbSfSb, W(W)CSbSfSb, and Opportunity cropping were observed in relation to W(W)CSbSfSb rotation. [The (W) indicates the wheat crop we are referring to in the rotation, i.e., (W)WCSb indicates we are referring to the first crop after soybean in this system, etc.] The rotations of (W)WCSbSfSb, W(W)CSbSfSb, and Opportunity yielding 30.5, 26.9, and 36.6 bu/ac, respectively. The second year wheat in the
W(W)CSbSfSb rotation had the longest fallow period prior to planting, however had the poorest wheat yield. Conversely, the wheat in the opportunity rotation, which followed soybeans had the shortest fallow period, had the highest yield.
Wheat yields at Akron were below normal. The overall yield averaged was 30.7 bu/ac with TAM 107 and Prairie Red yielding 30.3 and 31.2 bu/ac, respectively (Table 10).
Wheat yields at Lamar were low due to the crop not germinating until spring (Table 10). Despite the late germination and the limited moisture during the growing season, wheat yields were not as disappointing as expected. The yields in the WF rotation were higher than the WSF yielding 20 bu/ac and 17 bu/ac, respectively. Despite the presence of RWA late in the growing season, the TAM 107 yielded higher than the RWA-resistant Prairie Red in both rotations.
We have concluded that the current soybean varieties are not adapted to this semi-arid environment and in 2002 soybean was replaced by millet. However, the yield relationships in intensive systems with no fallow would be expected to be similar.
Corn and Sorghum
Corn yields following wheat were low across all sites in 2001, due to the difference in amount and distribution of July plus August and winter and spring precipitation. At Sterling, the
July+August precipitation was 1.5 inches below normal (Table 5a) and the average corn yield was 50 bu/A (Table 11). Yields from 1998-2002 are presented in Tables 12-14 for the plots in each
rotation that received both N and P fertilizer each year. This year’s corn production was better than 2000, but lower than 1998 and 1999 (Table 12). These yield variations are always related to
summer precipitation. The 2002 data will be discussed in Section B of this report.
At Stratton, the July+August precipitation was near normal for the two months but 4.4 inches fell in July and only 0.8 inches in August, resulting in the corn going into severe moisture stress during the first part of the reproductive stage of growth (pollination). This resulted in an average yield of 36 bu/A (Table 13). Yields on the summit and side slopes ranged from 4-18 bu/A, which would be classified as a crop failure. The overall average was brought up by the high yield in the toe slope which was driven by drainage water that inundated this position as the result of an intense rainfall event in July. Not considering the toe slope position, the yields averaged about 10 bu/A. Farmers would not harvest a field with this yield average because the return would not pay for the harvest cost.
At Walsh the precipitation during this period was 2.5 inches below normal and the average corn yields were 62 and 63 bu/A in the WCSb and Opportunity cropping system (Table 11). The continuous corn system averaged 54 bu/A. These yields are very good for dryland corn in this region. In general, 2001 was an “average” corn production year at Walsh.
Sorghum yields at Walsh, in 2001, averaged 63 and 60 bu/A in the two rotations that included sorghum, WSF and WWSSb, respectively (Table 14). The yield of sorghum after fallow was not substantially different than in the rotation that did not include fallow. This has been the trend since 1998, when we initiated these new more intense rotations. The 2001 and long-term average yield of continuous sorghum is about 10 bu/A less than yields of sorghum grown in a rotation.
Corn yields at Briggsdale were very low due to several reasons (Table 15). First, in 2001, precipitation in July and August was below normal (Table 5b). Second, plant populations were too high. The population we aimed for was 15,000 plants per acre. However, due to planter problems the population was in excess of 20,000 plants per acre. This high population used the stored soil water early in the season and the plants went into a moisture stress during the reproductive stage of growth. Many plants were barren.
Corn yields were also below average at Akron (Table 15). Even though soil moisture was good from planting until harvest, many ears were three to four inches in length. Test weights were low with an average if 53.7 lb/bu.
Despite good soil moisture at planting and good crop germination, sorghum yields were disappointing. Sorghum yields in 2001 were impacted by heavy grass pressure, high temperatures, and low August rainfall (Table 15).
Millet, Proso and Hay
Proso millet was not grown in any of the rotations at Sterling, Stratton or Walsh in 2001. However, due to the continued failure of soybeans to perform adequately, proso millet will be introduced back into the long-term rotations at Sterling and Stratton in 2002. Proso millet yields at Akron averaged 49 bu/A (Table 16), which is excellent for his area. Rainfall received in July and August was the major contributor to the high yields. Hail near harvest time decreased yields significantly.
Hay millet yields at Briggsdale were very good (Table 16). The yield was 1.8 t/A. This is a fast growing crop which was able to make good use of the above normal June precipitation. Even though the precipitation received in July was below normal it was still enough to produce favorable hay millet yields after the favorable precipitation levels in June.
Sunflower
The dry July and August also affected the sunflower yields at Briggsdale (Table 16). At less than 600 lb/A, these yields were below what we would expect for a long term average. The dry weather was the primary cause for the low sunflower yields.
The sunflowers at Akron averaged 1,140 lb/A. This was higher than expected given stand and pest problems.
Soybean
Soybeans for grain production at Sterling, Stratton and Walsh were low in 2001, ranging from 6-13 bu/A on the summit and side slopes at all sites and from 13-31 bu/A on the toe (Table 17). Soybeans were planted but not harvested for yield at Briggsdale. With the cultivars that are available, much of the seed that was produced shattered. The pods that were produced were so close to the ground it was impossible to harvest them with a combine. It is becoming apparent that soybeans are not a viable crop in this semi-arid environment. New cultivars need to be developed to withstand this environment. Until new cultivars are developed we will not include soybeans for seed production in our rotations. Soybeans will be eliminated from the Systems starting in 2002. Obviously they are not economical, especially when one considers the opportunity costs associated with this crop as compared to a more adapted crop. On the positive side, Round Up Ready soybean allowed us to have excellent weed control, especially for sandbur which has been an increasing problem at Sterling and Walsh. This is the main reason we were looking for a summer crop that was Round Up Ready to include in the rotations. Sandbur can become a real problem unless its growth cycle is broken with a crop that is Round Up Ready. Round Up Ready corn has solved some of this problem.
Forage Soybeans
Forage soybeans were grown for the first time at Briggsdale in 2001. The public variety, Donegal, was chosen. This variety has been genetically bred as a forage variety. It is a much higher maturity group than the grain varieties used in Colorado. It grows taller and produces more forage. There is potential for this to be an excellent livestock feed source with its higher protein content compared to hay crops traditionally grown on dryland. However, its yield was much less than the hay millet (Table 16). These soybeans were grown in the sequence of the rotation that is difficult for any crop, following sunflowers. The forage soybeans may be suitable following a crop other than sunflowers. This crop will be eliminated from the rotation in the future and will be replaced by a summer fallow period.
Opportunity Cropping
Opportunity cropping is an attempt to crop continuously without resorting to monoculture. It has no planned summer fallow periods, and is cropped as intensively as possible. In 2001 wheat was grown in the opportunity systems at Sterling and Stratton. The other locations do not have this rotation. Wheat yields in this system were much lower that yields in other cropping systems at Sterling and about equal to wheat in all rotations at Stratton (Table 6).
From the initiation of our project in fall 1985 we have grown 14, 14, and 12 crops in 16 years at Sterling, Stratton and Walsh, respectively in the opportunity system (Tables 18-20).
at the Walsh site. In 16 years at the two northern sites, the system has produced a total of 137 to 206 bushels of wheat per acre, 368 to 427 bushels of corn or sorghum, and 4.7 to 4.7 tons of forage per acre at Sterling and Stratton, respectively. Crop productivity at Walsh over 16 years has been 93 bushels of wheat, 322 bushels of corn or sorghum, 2 bushels of soybean, and 0.5 tons of forage. Two fallow years were included at Walsh and crops failed in two years, 1987 and 1990.
Above average annual precipitation has been a major factor contributing to the productivity; annual precipitation, until 2001, has been 2 to 3 inches above the long-term averages for all sites during the 16 year study period. Therefore, growers should use extreme caution in extrapolating these results to their own operations. In a time period of “drought”, these relationships will not hold true.
Our goal has been to produce wheat and corn or sorghum, the highest value crops, as
frequently as possible in our systems. We have used forages to transition from row crops back to fall-planted wheat. We harvest the forage and plant winter wheat that fall. Another good
possibility is planting proso millet the year after corn or sorghum, harvesting it as early as possible, and then planting wheat immediately into the proso stubble. However, if adequate fall
precipitation is not received, wheat germination will be a yield-limiting factor.
Opportunity cropping has had some advantages over the 3-year systems, such as excellent residue cover and ease of weed control. The combination of crop competition and no fallow has reduced weed pressures compared to other systems. One major difference in weed pressure has been in regard to the invasion of the perennials, Tumblegrass (Schedonnardis paniculata) and Red Threeawn (Aristada longiseta), in our no-till systems. All systems with fallows, especially WF and WC(S)F, have had devastating invasions of these grassy weeds and have required shallow sweep tillage to control these grasses. The opportunity system has remained free of these weeds. These particular perennial grasses are shallow rooted and do not become established in these systems. We conclude that it is due to the low surface soil water content and competition for the light. Fallow, where we are saving water and keeping the surface weed free, provides an excellent environment for their establishment. In contrast, opportunity cropping has no long fallows. Crop plants keep the soil surface dry much of the time and the two grassy invaders have not established.
Crop Residue Base
Maintenance of crop residue cover during non-crop periods and during seedling growth stages is vital to maximizing water storage in the soil. Crop residues provide protection from raindrop impact, slow runoff, and decrease water evaporation rates from the soil. Cover also greatly reduces erosion, both by wind and water.
Residue amount is being monitored by soil and crop within each system (Tables 21-24). Residues present at planting are needed to protect the soil during the early plant growth stages when there is little canopy present. Residue levels are subject to annual variations in climate, both in terms of production and decomposition rates. Obviously, drier years decrease production but also may decrease decomposition rates. The net effect is difficult to assess because the particular portion of the year that is extra dry or wet will change the direction of the impact. Residue quantities always are largest on toeslopes at each site, which is a function of productivity level. Walsh and Briggsdale, the most stressed sites, usually have the lowest residue amounts.
Cropping systems that involve a fallow period, like WCF or WSF, have minimum residue levels just prior to wheat planting because this time marks the end of the summer fallow period where decomposition has been occurring with no new additions of crop biomass. Therefore, cover
is at its minimum, and soil erosion potential is at its maximum point. One of the advantages of our new continuous cropping systems is the avoidance of a year with no crop residue input.
Residues present at wheat planting are given in Table 21 and 24. Residue amounts were moderate to high at wheat planting in all cropping systems in 2001 except in the WF and WMF system at Briggsdale (Table 24), which had 0 and 160 lb/A residue present. However at Sterling, Stratton, and Walsh, the general trend was for the residue levels in the systems that contain fallow to be higher than the continuous cropped systems (Tables 21). The small residue input from the low-yielding soybean crops has result in a degradation of the residue base in all rotations containing soybean at all sites (Tables 21-25). In addition to very low yields from soybean, inadequate residue production to maintain the residue base over the long-term would be expected to be an additional problem associated with this crop.
At corn planting (Table 22), systems with fallow were no worse than the continuously cropped systems and tend to have greater amounts of residue at the Sterling and Stratton sites. Residue amounts at soybean planting (Table 23) are about the same for both continuous cropping systems.
Over the long-term, one would expect the continuously cropped systems to have the most residue present on the soil surface. However, type of residue will influence accumulation because of differences in surface area for decomposition and C:N ratio of the material. For example, corn because of its large stalk diameter has a smaller surface area available for decomposition relative to wheat. Soybean residue has a C:N ratio that is much smaller than that of either corn or wheat, and therefore will decompose more quickly under similar environmental conditions. Therefore, systems with more corn and wheat are likely to have more residue accumulation, especially since our soybean yields of grain and stover are very low relative to corn and wheat. Additionally, one of the main driving factors is total biomass production by the crop. If more intensive cropping results in a reduction in yields (biomass), less residue is returned to the soil and the residue levels will decrease over time.
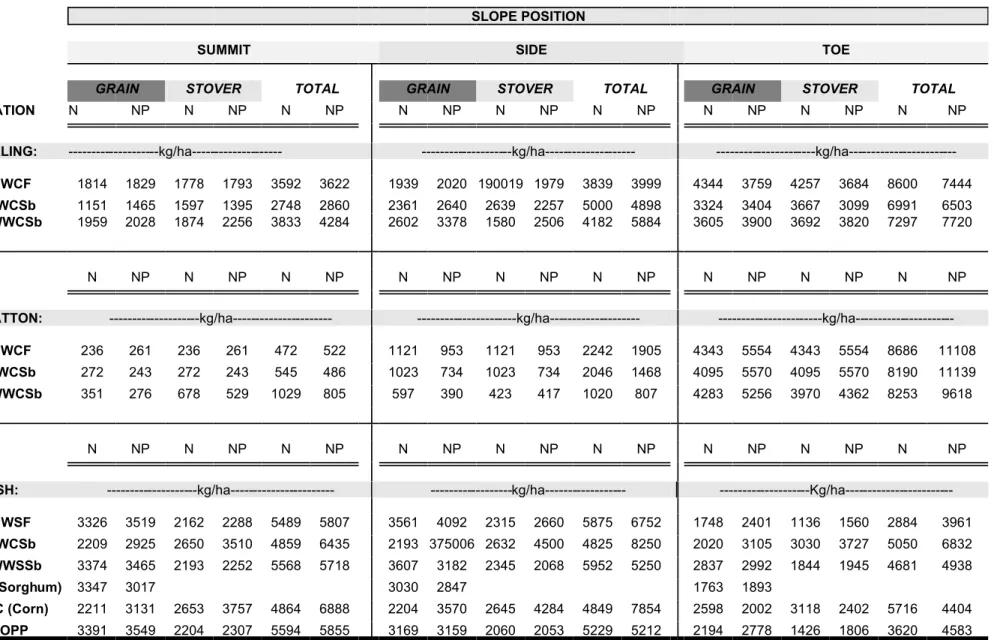
Nitrogen Content of Grain and Stover
Nitrogen content was determined for both grain and stover for each crop at each site (Tables 25-27). The reader can calculate crude protein content for each grain type by multiplying wheat grain N content by 5.7; corn, sorghum or soybean grain or straw content by 6.3. All nutrient concentrations are on a dry weight basis, consequently crude protein levels will appear high
compared to market levels. To obtain market levels, a grain moisture correction must be applied. On a dry matter basis, wheat proteins averaged 12.6% at Sterling, 16.1% at Stratton,
15.8 % at Walsh (Tables 25a and 29a). The relatively high protein contents at Stratton and Walsh are the result of dry weather and low grain yield, which concentrates protein. To correct these values for grain moisture content, multiply by 0.88, which results in a protein average of 11.1% at Sterling,14.2% at Stratton, 13.9% at Walsh. Goos, et al. (1984) established that if grain protein levels were above 11.1%, yield was not likely to be limited by N deficiency. A comparison of 2001 wheat protein to this standard indicates that N fertilization was adequate for the wheat crop at all sites.
Wheat straw N concentrations ranged from 0.24 to 1.34% across sites, averaging 0.64% (Table 25b). On the average, each ton of straw contained about 13 lb of N. There was no obvious relationship of straw N concentration and crop rotation at any site.
Stratton, and Walsh, respectively (Table 26a), or 9.25%, 8.46%, and 11.22% protein based upon a 15% moisture content. Corn stover N contents at Sterling varied from 0.41 to 1.43% and averaged 0.68% (Table 26b), data are not available for Stratton Each ton of corn stalks thus contained an average of 15 lb of N. The grain sorghum stover varied from 0.47to 1.25% N (Table 27b) and averaged 0.47% N. Each ton of grain sorghum residue contains about 15 lb of N.
Nitrogen levels in soybean grain (Table 27a) ranged from 4.93 to 6.45%, which is equivalent to 31 to 41% crude protein at market moisture content of the grain. The soybean stover was higher in N content than either wheat or corn, ranging from 0.45 to 1.93% N, averaging 0.81% N (Table 27b). Each ton of soybean residue would contain about 16 lb of N.
Soil Nitrate-Nitrogen
Residual soil NO3-N analyses are routinely conducted on soil profile samples (6 ft or 0-180 cm ) taken prior to planting for each crop, except for soybean, on each soil at each site (Table 28). These analyses are used to make fertilizer N applications for a particular crop on each soil at each site. Accumulation of residual nitrate allows reduction in the fertilizer rate. By using residual soil nitrate analyses of the root zone we also can determine if nitrate is leaching beneath the root zone. With improved precipitation-use efficiency in the more intensive crop rotations, the amount of nitrate escaping the root zone should be minimized. In the first 12 years of experimentation we found that the wheat-fallow system generally had higher residual nitrates than the 3- or 4-year rotations at the end of fallow prior to wheat planting.
At fall wheat planting in 2000 the amount of residual soil nitrate-nitrogen present varied from site to site, but wheat planted after fallow (WCF and WSF) tended to have more nitrate-nitrogen present than other systems. The nitrate-nitrogen in the more intense cropping systems was generally low. However, the opportunity system at Sterling and Stratton tended to have the highest, or among the highest, levels of residual soil nitrate. The nitrate levels in the toe slopes at Stratton are high, due to the high rate of mineralization that occurs in this high organic matter soil that is wetter than other soils in this landscape, thus promoting mineralization.
Residual NO3-N does not appear to be accumulating in the soil profile of any cropping system, which indicates that no system is over-fertilized. If fertilizer N is not used by wheat, for example, it is used by the subsequent corn or sorghum crop. The carry-over N is accounted for in the soil test used and reduces the amount of fertilizer N applied to the crop.