3D Sense - reliability and reproducibility
Accuracy evaluation of extraoral 3D facial
scanning
Amanda Henkel
Angelica Persson
Supervisor: Michael Braian DDS. CDTDepartment of Prosthetic Dentistry Faculty of Odontology, Malmö University Sweden
Deyar Mahmood
Dr. Philosophy/Odont/PhD,CDT Department of Prosthetic Dentistry Faculty of Odontology, Malmö University Sweden
Mikael Sonesson
Odont. Dr. Senior Consultant in Orthodontics Departement of Orthodontics
Faculty of Odontology, Malmö University Sweden
Bachelor thesis 15 credits Malmö University
Dentistry program Faculty of Odontology
February 2018 205 06 Malmö
1
1. Abstract……….... 2
2. Introduction………. 3
3. Material and methods………. 4
3.1 Scanning protocol………. 5
4. Results………7
5. Discussion………..10
6. Conclusions……….…………..11
2
1. Abstract
Aim: The aim of this study was to validate the 3D Sense scanner to evaluate its accuracy and
eventual use in odontology. Method: In this study, a model of a head was created with
anthropometric landmarks. The 3D Sense scanner was used for examinations of distances and angle accuracy. The results of the 3D Sense scan were then compared to a reference master model to get the standard deviation and reliability of the 3D Sense scanner. Results:The 3D Sense scanner showed a varying accuracy depending on the positioning and distance between the measuring points on the model. The best perception of the 3D Sense proved to be when the scanner was held still in a static position. The more movement of the scanner, the less accurate result. Conclusion: The present 3D scan analysis of 3D Sense proved overall a good reliability and reproducibility. To implement the 3D Sense scanner in odontological
treatment, further studies are needed with refined technique in order to get all of the measurement accurate.
3
2. Introduction
Profile radiographs are commonly used to evaluate skeletal and dental relations. To estimate changes in facial soft tissue along with the orthodontic treatment clinicians need to be aware of the effects on facial soft tissue due to skeletal and dental improvements 1. Since the orthodontic treatment might influence the outcome of facial soft tissue development and appearance, analyse of both the hard and soft tissue of the head is of interest for the clinicians 2, 3.
In previous studies the evaluation of soft tissue has been made to integrate esthetical outcome into treatment planning 4-10. Many of these studies have relied on 2-dimensional photographic and radiographic images. Only the lateral and frontal views are applied in the assessment when using cephalometric or photometric images. Scalar information can be obtained from 2D cephalograms and their ability to describe 3-dimensional characteristics is therefore limited. Facial surfaces however, have the 3D characteristics and can easily be examined 11. Another difficulty is the superimposition of several hard- and soft tissues in a cephalometric radiograph that complicates the identification of landmarks in the x-ray. It is stated that this moment causes the major source of cephalometric errors 12-14.
For treatment planning of orthodontic patients, profile radiographs for cephalometric analysis is commonly obtained, however the need of cephalometric analysis of lateral radiograph is still questioned 15-18. New technology is in advance; clinicians today can produce a reliable 3-dimensional image for evaluation without radiography, and expose adolescent patients for minor ionizing radiation19, 20.
A 3-dimensional evaluation would contribute to a more comprehensive understanding of the developing face and craniofacial structure 11.
In the clinical report by Bryan T. Harris et al. the 3D Sense scanner (3D system Rock Hill, SC/ USA) was used to create a 3D virtual patient in combination with other techniques. -Validation of the 3D Sense scanner was not mentioned in the report. Creating a digitizing 3D virtual patient, the treatment planning might show a potential treatment outcome with
harmonizing facial features 21. It is also an effective communication tool between clinician, patient and dental technician 22, 23.
Piero Antonio Zecca et al. compared in the clinical study, cephalometric radiographs with 3D
extraoral scans (PrimeSense Carmine 1.09) to investigate the possibility of using non-ionizing minimal invasive diagnostic methods in orthodontic treatment. According to the study, no validation of the extraoral scanner was made before the study. Although in
comparison to cephalograms it showed good accuracy in sagittal parameters and questionable results in vertical parameters 24.
The reliability and validity of the extraoral laboratory scanner (Ortho Insight 3DTM (Motionview Software, Hixson, TN/USA) was evaluated and compared to two different intraoral scanners by Helder B. Jacob et al. with good accuracy 25. The results of the scans were compared to show the accuracy of the different scanners. The validation shows a high reliability. In this study, any individual validation of the three scanners were not mentioned. Clinicians still prefer to use lateral cephalometric radiography as a diagnostic tool instead of 3D facial soft tissue scan because the absence of appropriate equipment and software with reliable normative values 26. In this study, a head model will be created with anthropometric landmarks. The 3D Sense scanner will be used for examinations of distances and angle accuracy. The results of the 3D Sense scan will then be compared to a reference master model to get the standard deviation and reliability of the 3D Sense scanner. The aim of this
4
study is to validate the 3D Sense scanner to evaluate its accuracy and its possible use in odontology.
3. Material and methods
3D Sense (3D system, Rock Hill, SC/USA) is a low cost, portable 3-dimensional surface scanner with, according to the manufacturer an accuracy of close to 1 millimeters with resolution at 1mm. Scan range of between 177.8 and 1828.8 mm and a color resolution of 1920x1080 pixels. The operation range is 0.2-1.6m, and field of view -the angle of how wide 3D Sense is able to see: horizontal: 45°, vertical: 57.5°, diagonal: 69°.
The physical dimension of the sensor is 129 (w) x 179.8(h) x 33(d) millimeters and maximal image throughput of 30 /fps 27.
The 3D Sense scanner was used to scan one of the authors head to create a model in 3D. The master-CAD were created in the software _Fusion_360(Autodesk version _2.0, _2017). Five anthropometric landmarks were chosen and numbered for this study and applied on the master-CAD: 1. nasion (n) 2. pronasale (prn) 3. pogonion (pg) 4. tragus sinister (trs) 5. tragus dexter (trd)
The landmarks were designed in the form of cones to be easily intercepted by the 3D Sense scanner. (diameter of 4mm, height 10 mm)
Picture 1: Master-CAD with colored landmarks in _Fusion_360(Autodesk version _2.0,_2017)
Additive manufacturing technique (Formlabs 2, PreForm Software 2.12.1) were used to print the master model (Black V2, Photoreactive Resin for Formlabs) and post-cured process following the manufacturers recommendation.
5
Picture 2: object produced by 3D printing a scan of one of the authors head and then used for the scanning sessions. Measuring points shown between the eyes (n), on the tip of the nose (prn), the chin (pg), left tragus (trs) and rihgt tragus (trd).
A thin layer of Titaniumdioxide (3M™ High-Resolution Scanning Spray, St Paul USA) was applied on the model according to the manufacturing recommendation for better perception of the landmarks by the 3D Sense scanner.
The scanning took place in a room with general lighting and was accomplished by two operators, 30 scans each for evaluation of intra-operator differences. Before any of the scans were made, a time reference was set to 90 seconds, including 3 seconds countdown by the program.
Each scan was made in the “object” function and by the same procedure to make sure every scan would be as similar to each other as possible.
The distance between the scanner and the model was decided by the operating range of the scanner set by the manufacturer (0.2-1.6 m). A green square appeared when the model was in focus.
For validation of the 3D Sense the distances between the landmarks were measured and the angle between prn and pg (prn’pg^trd) was evaluated.
3.1 Scanning protocol
The scanner was moved between the measuring points in order as follow:
Pronasale (2)> pogonion (3)> pronasale (2)> nasion (1) > tragus sinister (4) > Angle up to profile > pronasale (2)> tragus dexter (5)> profile
Each created scan made by the 3D Sense scanner was saved as a 3D-object file and were converted into STL-binary files in Autodesk Meshmixer (2015 Autodesk, Inc. version: 11.0.544). The STL-binary files were imported into Gom Inspect Professional (hotfix6 bulld 20170113).
In Gom Inspect the measuring points were numbered by (construct - point - point): n (1), prn (2) pg (3) trs (4) trd (5)
6
In Gom Inspect the function Construct was used to calculate a coordinate system, the distance between the points and the angle. To create the coordinate system the function local
coordinate system - by 3-2-1 was chosen: (plane: z1 - point 1, z2- point 2, z3- point 3. Line:
y1- point 2, y2- point 5. Point: x- point 4). The distance between points were measured with the function- distance- 2-point distance: (point 1-2, 2-3, 2-4, 2-5). An angle was constructed in the function - angle- 3-point angle: (angle point - 4, Point 1 -2 and Point 2 - 3.)
Picture 3: The master-CAD with landmarks and measuring lines in Gom Inspect Professional (hotfix6 bulld 20170113)
To evaluate the 3D Sense scanner, a reference scan was made by ATOS Capsule (Mv70 ScanBox 4105). The ATOS scanner is a high level industrial scanner validated for an accuracy level <5 micrones.It was imported into Gom Inspect Professional (hotfix6 bulld 20170113) for the same measuring procedure described previously.
Student´s t-test was used to calculate mean values and variance in all the total 60 scans. The significance of differences between the operators was determined.
7
4. Results
The result was submitted in the tables below.
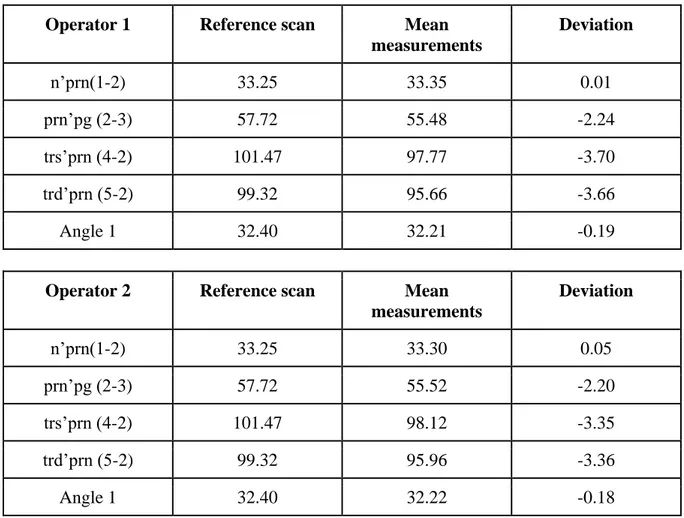
The mean deviation between the master scan and the laboratory scans varies in the range of 0.01- 3.7 mm. The smallest mean deviation of distance measurements was found in n’prn (1-2) which showed no significant differences from the master scan (0.053mm). Also, the angle measurements showed a good accuracy (0.006º). However, measurements of trs’prn (4-2) and trd’prn (5-2) represented the higher mean deviation and showed the lowest accuracy in this study. No significant differences in inter-operator measurement were found.
Intra-operator values
Operator 1 Reference scan Mean measurements Deviation n’prn(1-2) 33.25 33.35 0.01 prn’pg (2-3) 57.72 55.48 -2.24 trs’prn (4-2) 101.47 97.77 -3.70 trd’prn (5-2) 99.32 95.66 -3.66 Angle 1 32.40 32.21 -0.19
Operator 2 Reference scan Mean measurements Deviation n’prn(1-2) 33.25 33.30 0.05 prn’pg (2-3) 57.72 55.52 -2.20 trs’prn (4-2) 101.47 98.12 -3.35 trd’prn (5-2) 99.32 95.96 -3.36 Angle 1 32.40 32.22 -0.18
Table 1: Reference scan compared with intra-operator mean measurements and shows the deviation.
8
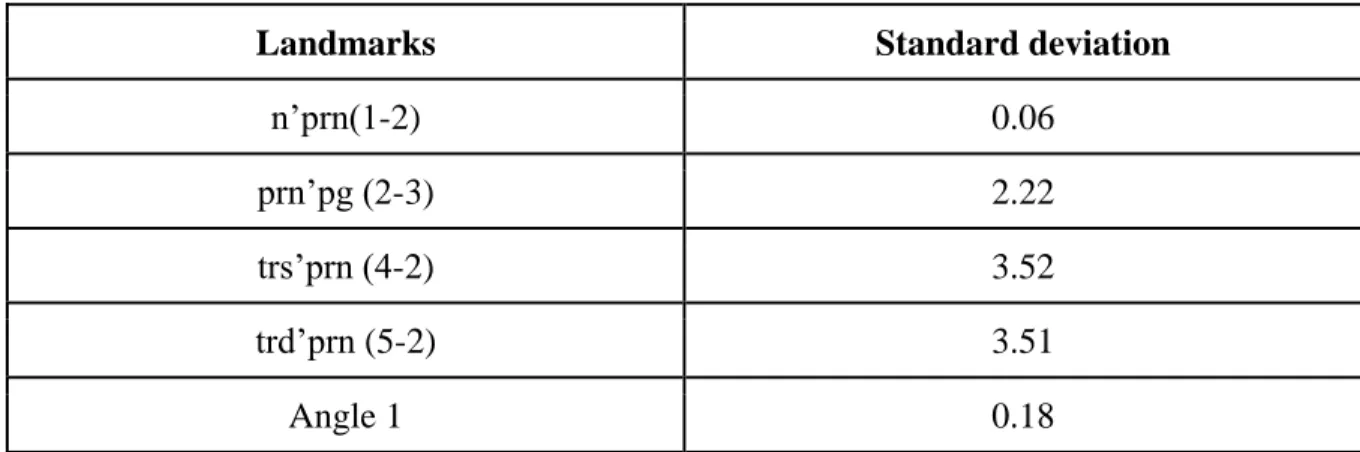
Standard deviation
Landmarks Standard deviation
n’prn(1-2) 0.06
prn’pg (2-3) 2.22
trs’prn (4-2) 3.52
trd’prn (5-2) 3.51
Angle 1 0.18
Table 2: Standard deviation for each distance measuring and the angle measurement compared to the reference scan.
Inter-operator deviation
Landmarks Operator 1 Operator 2 Inter-operator deviation n’prn(1-2) 33.35 33.30 0.05 prn’pg (2-3) 55.48 55.52 0.04 trs’prn (4-2) 97.77 98.12 0.35 trd’prn (5-2) 95.66 95.96 0.30 Angle 1 32.21 32.22 0.01
9
Picture 4: The figure above shows four fields that represent the different distances between the landmarks. Each field are divided into two representing the two operators. Operator 1 in the colour red and operator 2 in the colour blue. The center represents the value 0 and the red and the blue dots represent the dispersion in the distance measurement during the scan session and the inter- and intra operator differences between the operators, shown in mm.
n’prn (1-2) measurements in the first quarter showed a high accuracy (<1mm) with small deviation in intra- and inter operator differences. prn’pg (2-3) measurements in the second quarter shows a greater deviation and lower accuracy (<3,5 mm). In the third and fourth quarters trs’prn (4-2) and trd’prn (5-2), the accuracy is impaired and the measurements shows a greater inter- and intra operator deviation.
10
5. Discussion
Since the purpose of this study was only to validate the 3D Sense scanners accuracy, the landmarks were randomly chosen. The selection of landmarks is however inspired from anthropometric landmarks that are used frequently in cephalometric analysis 11, 28 and the positioning of the landmarks is placed in easily detectable anatomical structures. To ensure measuring accuracy between each scan, the landmarks were shaped asgeometrical cones to be easily perceived by the 3D Sense scanner.
Cephalometric analysis of a profile radiograph is based on the measurements of angles between constructed horizontal and vertical lines picturing borders of skeletal and dental structures 29.Therefore, a random angle between the landmarks prn and pg (prn’pg^trd) was chosen for validation. The scanning sessions were performed with the scanner in motion around the model to capture all the facial structures. Each scanning session started up with focusing on the frontal landmarks (n’prn), holding the scanner in a static straight forward position. The 3D Sense shows no significant difference from the reference scan when measuring the distance between these landmarks (n’prn) (the standard deviation was 0.057 mm). The distance trs’prn and trd’prn however, shows a significant difference with a standard deviation of -3.524 mm respectively -3.507 mm. These results indicate that the movement of the scanner seems to contribute to a less accurate measurement.
Since the landmarks (pg, prn) determines the size of the chosen angle (prn’pg^trd), the accuracy of the angle is reliable with a standard deviation of -0.18 °. The result has no correlation to the less accurate profile scanning. An angle depending on the distance in sagittal plane would probably result in measuring errors. To get a more reliable result, a static scan of the frontal view and profile in separate session could be an advantage in distance and angle determination.
Prior to scanning, a time reference was set to 90 seconds (including 3 seconds’ countdown by the program), although each scan came to vary within the time of 78-101 seconds. The 3D Sense´s maximal image throughput is 30 frames per second (fps). On average, operator 2 had a longer time per scan. Overall no significant differences between the operators were found. Although the higher frame rate may have resulted in a slightly more accurate result and a smaller standard deviation.
The low-cost extraoral 3D Sense is highly available for any clinician to buy and use on daily basis. To be appropriate for odontological use the scanner must be able to detect and perceive the facial structure in varying light conditions at the clinic. In this study, the scans were made in general lighting, not in clinic environment. Only one scan was made on human face structure, with all the variation of skin tones, to create the master-CAD 3D printed model. The 3D model was printed in one color and the lack of color variations caused difficulties in perception by the 3D Sense. Surface contrast agent (3M™ High-Resolution Scanning Spray, St Paul USA) was therefore required and applied on the model.
Various 3D scanners have been used in several studies with odontological purposes and 3D scanning seems to be an upcoming diagnostic tool in dentistry. A comparison between angles in anthropometric landmarks in cephalometric radiographs and soft tissue landmarks was made in the clinical report by Piero Antonio Zecca et al.- which displayed a method error of < 1°, - which was considered clinically irrelevant. Also, 3dMD imaging have been compared to cone beam computed tomography to determine the equivalence of the measurements in the clinical report by Tasha E. Metzger et al. The authors conclusions suggest nonequivalent
11
areas between the methods with statistically significant differences. However, the differences were considered clinically acceptable from the orthodontic point of view 30.
To our knowledge, the validity and reliability of the 3D Sense had not been evaluated previously. A validated scanner is fundamental to get a reliable result of a 3D scanner in odontological use. If accuracy and reliability is not determined, the outcome may vary and compromise diagnoses and safety of the patient. 3D scanning may replace the 2D
cephalometric imaging as a diagnostic tool in orthodontics. The superimposition of anatomical structures in 2D cephalometric analysis complicates the identification of landmarks. A 3D scanning of the head and face would be of great tool and advantage in identifying 3D soft tissue landmarks and contribute to an extended diagnostic view. Implementation of 3D scanning in orthodontic treatment would decrease the ionizing radiation dose to the patient, implicating a minimal invasive treatment. The 3D scanning is furthermore a fast and pain free procedure for the patient.
The 3D Sense scanner is a cheap and easily used tool that can be obtain by any clinician and manage user-friendly software. The digital workflow in dentistry is in advance and external 3D scanning might be used in future treatment planning -as solution in odontology.
From the results of the present study, the following facts can be stated:
1. No statistically significant differences were found between the distance n-prn. Likely this result depends on the static position of the scanner in the beginning of the
scanning session. The low mean differences can be considered as clinically irrelevant. 2. Higher statistically differences were found between the distances prn-pg, trs-prn,
trd-prn. As discussed above, these results may depend on the movement of the scanner through the session.
3. The angle measurement of prn´pg^trd in this study proved to be accurate and is considered to be highly clinically relevant in orthodontic treatment planning.
6. Conclusions
The present 3D scan analysis of 3D Sense proves overall a good reliability and
reproducibility and some of the results indicates that the 3D Sense is accurate enough and could be used in different fields of odontology. To get overall accurate results and implement the 3D Sense in odontological treatment, the 3D Sense needs to be further explored and more studies are needed with refined technique.
12
7. References
1. Kilic,Nihat, Catal,Gulhan, Kiki,Ali, Oktay,Hüsamettin. Soft tissue profile changes following maxillary protraction in class III subjects. European Journal of Orthodontics. 2010;32(4):419-424.
2. Case CS. The aesthetic correction of facial contours in the practice of dental orthopedia.
Catching’s compendium of practical dentistry.Atlanta: Franklin Printing and Publishing Co.
1896:165-172.
3. Angle E. Treatment of malocclusion of the teeth and fractures of the maxillae SS white manufacturing 1900.
4. Burstone C. Lip posture and its significance in treatment planning. [- 4]. (- 0002-9416 (Print); - 0002-9416 (Linking)).
5. Burstone CJ. The integumental profile. American Journal of Orthodontics. 1958;44(1):1-25.
6. Holdaway RA. A soft-tissue cephalometric analysis and its use in orthodontic treatment planning. part I. Am J Orthod. 1983;84(1):1-28.
7. Lines PA, Lines RR, Lines CA. Profilemetrics and facial esthetics. American Journal of
Orthodontics. 1978;73(6):648-657.
8. Peck H, Peck S. A concept of facial esthetics. Angle Orthod. 1970;40(4):284-318. 9. Stoner MM. A photometric analysis of the facial profile: A method of assessing facial change induced by orthodontic treatment. American Journal of Orthodontics.
1955;41(6):453-469.
10. Subtelny JD. A longitudinal study of soft tissue facial structures and their profile characteristics, defined in relation to underlying skeletal structures. American Journal of
13 11. Farkas L. Anthropometry of the head and face
2nd ed. new york: Raven press. 2nd ed. New York: Raven Press; 1994.
12. Houston WJ. The analysis of errors in orthodontic measurements. Am J Orthod. 1983;83(5):382-390.
13. Baumrind S, Frantz RC. The reliability of head film measurements. 1. landmark identification. Am J Orthod. 1971;60(2):111-127.
14. Baumrind S, Frantz RC. The reliability of head film measurements. 2. conventional angular and linear measures. Am J Orthod. 1971;60(5):505-517.
15. Nijkamp PG, Habets LL, Aartman IH, Zentner A. The influence of cephalometrics on orthodontic treatment planning. Eur J Orthod. 2008;30(6):630-635.
16. Devereux L, Moles D, Cunningham SJ, McKnight M. How important are lateral cephalometric radiographs in orthodontic treatment planning? Am J Orthod Dentofacial
Orthop. 2011;139(2):e175-81.
17. Arnett GW, Bergman RT. Facial keys to orthodontic diagnosis and treatment planning--part II. Am J Orthod Dentofacial Orthop. 1993;103(5):395-411.
18. Arnett GW, Bergman RT. Facial keys to orthodontic diagnosis and treatment planning. part I. Am J Orthod Dentofacial Orthop. 1993;103(4):299-312.
19. William E, Harrell, Jr, DMD.
Three-dimensional diagnosis & treatment planning: The use of 3D facial imaging and 3D cone beam CT in orthodontics and dentistry. 2007.
20. Quintero JC, Trosien A, Hatcher D, Kapila S. Craniofacial imaging in orthodontics: Historical perspective, current status, and future developments. Angle Orthod.
1999;69(6):491-506.
21. Harris BT, Montero D, Grant GT, Morton D, Llop DR, Lin WS. Creation of a 3-dimensional virtual dental patient for computer-guided surgery and CAD-CAM interim
14
complete removable and fixed dental prostheses: A clinical report. J Prosthet Dent. 2017;117(2):197-204.
22. Joda T, Gallucci GO. The virtual patient in dental medicine. Clin Oral Implants Res. 2015;26(6):725-726.
23. Joda T, Bragger U, Gallucci G. Systematic literature review of digital three-dimensional superimposition techniques to create virtual dental patients. Int J Oral Maxillofac Implants. 2015;30(2):330-337.
24. Zecca PA, Fastuca R, Beretta M, Caprioglio A, Macchi A. Correlation assessment between three-dimensional facial soft tissue scan and lateral cephalometric radiography in orthodontic diagnosis. Int J Dent. 2016;2016:1473918.
25. Jacob HB, Wyatt GD, Buschang PH. Reliability and validity of intraoral and extraoral scanners. Prog Orthod. 2015;16:38-015-0108-7. Epub 2015 Oct 27.
26. McCance AM, Moss JP, Fright WR, Linney AD. Three-dimensional analysis techniques--part 3: Color-coded system for three-dimensional measurement of bone and ratio of soft tissue to bone: The analysis. Cleft Palate Craniofac J. 1997;34(1):52-57.
27. https://www.3dsystems.com. Updated 2017.
28. Farkas L. Anthropometric facial proportions in medicine. Vol 1. 1st ed. Springfield, Illinois: Charkes C. Thomas; 1986.
29. Gateno J, Xia JJ, Teichgraeber JF. New 3-dimensional cephalometric analysis for orthognathic surgery. J Oral Maxillofac Surg. 2011;69(3):606-622.
30. Metzger TE, Kula KS, Eckert GJ, Ghoneima AA. Orthodontic soft-tissue parameters: A comparison of cone-beam computed tomography and the 3dMD imaging system. Am J
Orthod Dentofacial Orthop. 2013;144(5):672-681.