Inquiry into the
radiological consequences of power
uprates at light-water rectors worldwide
Tea Bilic Zabric, Bojan Tomic, Klas Lundgren and Mats Sjöberg
SSI Rapport
2007:07
Rapport från Statens strålskyddsinstitut tillgänglig i sin helhet via www.ssi.seUltraviolet, solar and optical radiation
Ultraviolet radiation from the sun and solariums can result in both long-term and short-term effects. Other types of optical radiation, primarily from lasers, can also be hazardous. SSI provides guidance and information.
Solariums
The risk of tanning in a solarium are probably the same as tanning in natural sunlight. Therefore SSI’s regulations also provide advice for people tanning in solariums.
Radon
The largest contribution to the total radiation dose to the Swedish population comes from indoor air. SSI works with risk assessments, measurement techniques and advises other authorities.
Health care
The second largest contribution to the total radiation dose to the Swedish population comes from health care. SSI is working to reduce the radiation dose to employees and patients through its regulations and its inspection activities.
Radiation in industry and research
According to the Radiation Protection Act, a licence is required to conduct activities involving ionising radiation. SSI promulgates regulations and checks compliance with these regulations, conducts inspections and investigations and can stop hazardous activities. Nuclear power
SSI requires that nuclear power plants should have adequate radiation protection for the generalpublic, employees and the environment. SSI also checks compliance with these requirements on a continuous basis.
Waste
SSI works to ensure that all radioactive waste is managed in a manner that is safe from the standpoint of radiation protection.
Mobile telephony
Mobile telephones and base stations emit electromagnetic fields. SSI is monitoring developments and research in mobile telephony and associated health risks.
Transport
SSI is involved in work in Sweden and abroad to ensure the safe transportation of radioactive substances used in the health care sector, industrial radiation sources and spent nuclear fuel.
Environment
“A safe radiation environment” is one of the 15 environmental quality objectives that the Swedish parliament has decided must be met in order to achieve an ecologically sustainable development in society. SSI is responsible for ensuring that this objective is reached.
Biofuel
Biofuel from trees, which contains, for example from the Chernobyl accident, is an issue where SSI is currently conducting research and formulating regulations.
Cosmic radiation
Airline flight crews can be exposed to high levels of cosmic radiation. SSI participates in joint
SSI rapport: 2007:07 maj 2007
ISSn 0282-4434
The conclusions and viewpoints presented in the report are those of the authors and do not necessarily coincide with those of the SSI.
Författarna svarar själva för innehållet i rapporten.
edItorS / redaktörer : Tea Bilic Zabric1), Bojan Tomic1), Klas Lundgren2)
and Mats Sjöberg3)
1)Enconet Consulting, 2)ALARA Enginering and 3)ES-konsult
tItle / tItel: Inquiry into the radiological consequences of power uprates at
light-water rectors worldwide. / Utredning av radiologiska konsekvenser i sam-band med effekthöjningar i lättvattenreaktorer världen över.
department / avdelnIng: Department of Occupational and Medical Exposures
/ Avdelning för för personal- och patientstrålskydd.
Summary: In Sweden, most of the nuclear power plants are planning power uprates
within the next few years. The Department of Occupational and Medical Exposures at the Swedish Radiation Protection Agency, SSI, has initiated a research project to investigate the radiological implications of power uprates on light-water reactors throughout the world.
The project was divided into three tasks:
1. A compilation of power uprates of light-water reactors worldwide. The compi-lation contains a technical description in brief of how the power uprates were carried out.
2. An analysis of the radiological consequences at four selected Nuclear Power Plants, which was the main objective of the inquiry. Affects on the radiolo-gical and chemical situation due to the changed situation were discussed. 3. Review of technical and organisational factors to be considered in uprate
projects to keep exposures ALARA.
The project was carried out, starting with the collecting of information on the imple-mented and planned uprates on reactors internationally. The information was catalogued in accordance with criteria focusing on radiological impact. A detailed analysis followed of four plants selected for uprates chosen according to established criteria, in line with the project requirements. The selected plants were Olkiluoto 1 and 2, Cofrentes, Asco and Tihange. The plants were selected with design and operation conditions close to the Swedish plants. All information was compiled to identify good and bad practices that are impacting on the occupa-tional exposure. Important factors were discussed concerning BWRs and PWRs which affect radiation levels and occupational exposures in general, and especially at power uprates.
Conclusions related to each task are in detail presented in a particular chapter of the report. Taking into account the whole project and its main objective the following conclu-sions are considered to be emphasized
Optimisation of the work processes to limit the duration of the time spent in the con-trolled areas is especially important. Leadership, composition and organization of the large demanding tasks are critical for successful implementation of power uprate and keeping received doses at a minimum. Good planning and preparation, which reflects experience from similar projects elsewhere, adherence to procedures and supervision from plant personnel as well as consequential application of ALARA principles and good practices are important factors.
It has not been found a direct relationship between the uprates and the occupational expo-sures. The occupational doses on some plants seem to be higher after the uprate, while on others seem to be lower. However the general trend in light-water reactors worldwide is gradually reduced occupational exposures.
There is no obvious correlation of the power uprate and fuel failures. However, per-form-ance of fuel for PWRs and BWRs went in opposing directions, improving for PWRs and deteriorating for BWRs.
For BWRs investment in the condensate cleanup efficiency results in favourable water chemistry conditions that can be maintained, or even improved, after the power uprate. The higher steam velocity after a power up-rate can increase the radiation levels around main steam lines and other turbine components due to a consider-able increase in steam moisture content. This problem can be overcome with a recent design and installation of new steam dryers in the reactor pressure vessel to reduce steam moisture.
Issues of relevance for PWRs include: Increase in the rate of production of H-3 due to higher boron concen-tration and power level, especially for longer fuel cycles; Control of pH and Lithium as an essential means of controlling the corrosion level and thus radiation levels. Fuel related corrosion problems are shown to be less visible with good pH control and shorter fuel cycles.
SammanfattnIng: I Sverige pågår eller planeras effekthöjningsprojekt i de flesta av kärnkraftverken.
Sta-tens strålskyddsinstituts avdelning för personal- och patientstrålskydd har initierat ett forskningsprojekt för att samla in information om effekthöjningar i lättvattenreaktorer världen över med fokus på de radiologiska konsekvenserna som effekthöjningen innebär.
Projektet delades in i tre delprojekt:
1. Insamling av fakta om reaktorer som höjt eller står i begrepp att höja effekten med en kortfattad teknisk beskrivning om effekthöjningen.
2. Analys av de radiologiska konsekvenserna på fyra utvalda kärnkraftverk, vilket var det egentliga huvudsyftet med projektet. Påverkan på den radiologiska och kemiska situationen pga. den änd-rade situationen diskuteänd-rades.
3. Genomgång av tekniska och organisatoriska faktorer som bör beaktas vid en ef-fekthöjning för att hålla stråldoser så låga som rimligen är möjligt (ALARA).
Projektet genomfördes med att initialt samla in internationell information om genomförda och planerade effekthöjningar. Informationen katalogiserades i enlighet med kriterier som fokuserade på radiologisk påver-kan. En detaljerad analys genomfördes av fyra utvalda kärnkraftverk valda enligt fastställda kriterier som uppfyllde projektets anspråk. De valda kraftverken var Olkiluoto 1 and 2, Cofrentes, Asco and Tihange. Des-sa kraftverk valdes med hänsyn till att konstruktion och driftbetingelser ligger nära de svenska kraftverken. Information samlades in för att identifiera “good and bad practices” som påverkar perso-nalens stråldoser. Viktiga faktorer som diskuterades berör strålnivåer och personalens stråldoser generellt och vid effekthöj-ningar i synnerhet.
Varje delprojekts slutsatser är presenterade i delprojektets kapitlet. Vi vill dock med hän-syn till projektet och dess mål framhålla följande slutsatser:
Optimering av arbetsprocesser för att begränsa tiden på kontrollerat område är av stor vikt. Ledarskap, sam-mansättning och organisation av stora utmanande projekt är kritiska faktorer för att genomföra en effekt-höjning med lyckat resultat. God planering och förbe-redelse som tar hänsyn till liknande projekt vid andra anläggningar, användning av in-struktioner och att kraftverkets egen personal utför en noggrann övervakning av arbeten samt införande av ALARA principer och användandet av goda förebilder är viktiga fakto-rer. Någon direkt relation mellan effekthöjning och personalens stråldoser har inte kunnat påvisas. Personalens stråldoser på några kraftverk verkar öka medan på andra sjunker doserna. En generell trend i lättvattenvat-tenreaktorer världen över är gradvis minskade doser till personalen.
Det har inte kunnat påvisas någon tydlig korrelation mellan effekthöjning och bränsleska-dor. Emellertid har bränsleskadeutvecklingen för PWR och BWR gått motsatta vägar. För PWR har den förbättrats men för BWR har den försämrats.
Table of contents
List of abbreviations ...2 1. Introduction ...5 2. Project description ...6 2.1 Project overview ...6 2.2 Working method ...6 2.3 Participants ...73. Compilation of power uprates ...8
3.1 Introduction ...8
3.2 Data Collection and Sources...8
3.3 Content of the data base...11
3.4 Conclusions ...15
4. Analysis of the selected plants...21
4.1 Olkiluoto 1 and 2 ...21
4.1.1 Introduction ...21
4.1.2 OL1/2 power uprate...21
4.2 Cofrentes...53
4.2.1 Introduction ...53
4.2.2 CNC power uprate ...53
4.3 Asco and Tihange ...78
4.3.1 Introduction ...78
4.3.2 Asco NPP power uprate...81
4.3.3 Tihange NPP power uprate...89
4.3.4 Comparison of two PWR uprates ...96
5. Reconstruction experience...103 5.1 Technical factors ...103 5.1.1 Introduction ...103 5.1.2 BWR uprates...103 5.1.3 PWR uprates ...122 5.2 Organisational factors...134
5.2.1 Reducing the exposures ...134
5.2.2 Implementation of power uprate...136
5.2.3 Lesson learned ...138
6. Conclusions ...140
7. References ...147
List of abbreviations
AB Auxiliary building ABB ASEA merged with BBC ACEC Alstom ACEC Energie
ACLF Grouping of ACEC/C-L//Framatome/WNE
AEE Atomenergoexport
AFW Auxiliary Feedwater
ALARA As Low As Reasonably Achievable
AO Axial Offset
AOA Axial Offset Anomaly ASEA
Allmänna Svenska Elektriska Aktiebolaget (General Swedish Electrical Limited Company)
BBC Brown Boverie et Cie BOC Beginning Of Cycle
BRAC BWR Radiation Assessment and Control BWR Boiling Water Reactor
°C Degrees Centigrade CCU Condensate Clean-Up CE Combustion Engineering CILC Crud Induced Local Corrosion C-L Creusot Loire
CMI Cockerill Mechanical Industry CNC Confrentes nuclear power plant CRD Control Rod Drives
CVCS Chemical Volume Control System
DB Deep Bed DG Diesel Generator DH Dissolved Hydrogen DO Dissolved Oxygen dP Delta Pressure DR Dose Rate E Extended power
EPU Extended Power Uprate DZO Depleted Zinc Oxide EBA Enriched Boron Acid
FRAM Framatome
FRAMACECO Framatome-ACEC-CO
FW Feedwater
GBq Giga Becquerel
GE General Electric Gpm Gallons per minute
HP High Pressure
HWC
Hydrogen Water Chemistry in BWRs with injection of hydrogen in order to reduce the risk of environmental assisted cracking
HWC-M Moderate HWC
IAEA International Atomic Energy Agency
ICRP International Commission on Radiological Protection IGSCC Intergranular Stress Corrosion Cracking
ISOE Information System on Occupational Exposure KWU Kraftwerk Union
LEFM Ultrasonic feedwater flow measuring system
LP Low Pressure
MP Measuring Position for dose rate
MSL Main Steam Line
MSLR Main Steam Line Radiation MU Measurument Uncertainty
MUR Measurument Uncertainty Recapture
MWt MW thermal power
NM Noble Metal
NMCA Noble Metal Chemical Addition NPP Nuclear Power Plant
NRC Nuclear Regulatory Commission NSSS Nuclear steam supply system
NWC Normal Water Chemistry in BWRs without injection of hydrogen O&M Operation and Maintenace
OECD Organisation for Economic Cooperation and Development
OL1 Olkiluoto-1
OL2 Olkiluoto-2
OLNC On Line NobleChem PCI Pellet Cladding Interaction
PCMI Pellet Cladding Mechanical Interaction PCS Power Conversion System
pH300 pH at 300 C
PI Performance Indicators
PLR Primary Loop Recirculation (i.e. recirculation lines) PS Pressure Suppression
PWR Pressurized Water Reactor
R2 Ringhals 2
R3 Ringhals 3
RCS Reactor coolant system RFO Refuelling Outage RHR Residual Heat Removal Rpm Rounds per minute RPV Reactor Pressure Vessel RTD Reactor Temperature
RW Reactor Water
RWCU Reactor Water Clean-Up
Rx Reactor
S Stretch power
SG Steam Generator
SGR Steam Generator Replacement SHE Standard Hydrogen Electrode SPF Spent Fuel Pit
SPU Stretch Power Uprate SS Stainless Steel
SSI Swedish Radiation Protection Authority STP Standard Temperature and Pressure T Ave Average temperature
T½ Half-life for radionuclide
TMI Three Mile Island TVO Teollisuuden Voima Oy
WANO World Association of Nuclear Operators (www.wano.org.uk)
WEC Westinghouse
WNE Westinghouse Nuclear
1. Introduction
Most nuclear power plants in Sweden are planning power uprates within the next few years. Permission to increase power is given by the Swedish Government. The Swedish Radiation Protection Authority, SSI, is one of the bodies to which the application for power uprates is referred for consideration. The Department of Occupational and Medical Exposures at SSI has initiated an inquiry to consider the radiological implications of thermal power uprates on light-water reactors throughout the world. The information gained from the research will be firstly used as a reference and background information source and then toreview the the applications for power uprates and in the assessment of the after-effects of these uprates.
Available information shows that a relatively high percentage of all operating NPPs in the world have implemented, or are considering, some form of power increase (power uprate). Such uprates vary significantly. Small uprates of a few percent of the plant’s power may be achieved by modification of the power conversion system and/or adjust-ments to control systems. Conversley large uprates, sometimes in excess of 30% nominal power, may be undertaken which require substantial changes on the reactor side, includ-ing fuel, operatinclud-ing regime and limits, etc.
The majority of power uprates are in the middle range (between 5 and 10 % of nominal power) and typically involve changes to both reactor and power conversion system (PCS). However, all power uprates require either major or minor modification to operat-ing practices and conditions. The radiological doses to personnel are related to these up-grades, both during normal operation and during outages, whilst also being sensitive to differing materials and operating regimes. Integral doses could often be found from WANO indicators and other sources of information. However, these had not been sys-tematically analysed to determin which specific features of the uprates were influencing radiological doses.
2. Project description
2.1 Project overview
The aim of the inquiry was to investigate what specific conditions and practices affect the operational doses received when reactor power is uprated. Identification of these factors on a worldwide basis should then allow power uprates to be planned in way that provides better exposure optimisation.
The inquiry was divided into three tasks:
1. A compilation of power uprates of light-water reactors worldwide. The compila-tion contains a technical descripcompila-tion in brief of how the power uprates were car-ried out.
2. The main emphasis of the inquiry was an analysis of the radiological conse-quences at four selected Nuclear Power Plants. Affects on the radiological situa-tion due to the changed situasitua-tion was discussed by checking areas of special in-terest, such as
− degradation of material resulting in more repair work,
− verification of safety and security resulting in more testing and − work performed in controlled areas in relation to the uprate.
3. Experience from the reconstruction period with bearing on the radiation protec-tion of workers
This report is a compilation of all three tasks. Each task has its own chapter and for task 2 the analysis of the selected plants, are shown in three different subchapters. Task 3 is divided into two subchapters where the technical factors to control radiation fields are discussed in one and the organisational issues in the second.
2.2 Working method
This inquiry was implemented with three specific elements (tasks), starting with the col-lecting of information on the implemented and planned uprates on PWR and BWR reac-tors internationally. The information was catalogued in accordance with criteria focusing
persons. There was a good response for the data sought for the BWR’s. For the PWRs detailed radiological data was received but less technical and chemistry. The PWR Task 2 report is therefore, not the detailed analysis we hoped to make. Though a detailed analysis on radiological data has been performed.
2.3 Participants
Three experienced companies carried out the inquiry. The experts involved in the project were:
Tea Bilic Zabric and Bojan Tomic from Enconet Consulting, Vienna Klas Lundgren from ALARA Enginnering, Skultuna
Mats Sjöberg ES-konsult, Solna
3.
Compilation of power uprates
3.1
Introduction
Quite a few NPPs have implemented, or are considering increasing the power level on which they operate (power uprate). Those power uprates vary significantly, from small ones of a few percentages to large uprates above 30% of the nominal power. The altera-tions to the plants particularly those with larger power uprates, require changes and modi-fications to the plant, in both hardware and operating arrangements (procedures, operating regime, and operating window). Apart from different requirements (on power conversion system) fuel remains an important (and also a limiting) issue during an uprate.
In addition to the safety impact of uprates that is normally verified in depth before a li-censee for an uprate is issued the radiological aspects, the consequences of an uprate are also of interest. Changes in operating regimes, but also changes and operation with new hardware might have an impact on the operational doses and their distribution. Increased power level may also have certain impact on the effluents, especially on tritium.
The first task was to compile a database using worldwide sources. This database will be accompanied by a discussion of the sources used and the initial conclusions that could be drawn from the data.
3.2
Data Collection and Sources
The data collected within this task relates to the worldwide uprates performed (or planned) and which shows the radiological consequences and compares the data before and after the uprates. The data was collected from the literature sources; including a vari-ety of databases, regulatory filings, analyses and other available information.
The following sources were used: WANO Performance indicators
WANO maintains five programmes for information exchange, promoting mutual com-munications and benchmarking. Two of them: ‘Exchange of Operating Experience’ and ‘Performance Indicators’ – a series of standardised parameters for the comparison of power plants, were reviewed for data collection within this project. The data, readily available from the WANO performance indicators database is more general and cannot be used to determine doses in e.g. outages. The data is available from 1992. In some samples for multi unit sites the doses in WANO indicators database are just a fraction (1/3 or 1/2) of the plant’s total value. The WANO database was used for the initial review of
occupa-and subcontractors. ISOE database was established in 1992, but the data on collective doses start in 1977.
The ISOE database was used to extract the information on occupational doses during outages and during normal operation (annual doses).
Nuclear Engineering
The World Nuclear Industry Handbook is a reference guide to the nuclear power industry. It is updated each year. Among other information the Handbook contains information on power reactors, a country-by-country summary of reactors showing type, status, location, main contractors and key dates; main data on each unit including technical detail on core, vessel containment, fuel, coolant, moderator, control, fuelling, operating strategy, turbine and more.
IAEA
The IAEA is a leading publisher in the nuclear field. It’s scientific and technical publica-tions cover fifteen subject areas. They include the proceedings of major international conferences, as well as international guides, codes, standards, reports, documents and conventions. IAEA PRIS data base and publication was used for reviewing information and proceedings from conferences.
NRC
The NRC's REIRS system provides the latest available information on radiation exposure to the workforce at certain NRC licensed facilities. REIRS contains several data bases that record the radiation exposure information. We used ‘Effluent Database for Nuclear Power Plants’, which was developed to track annual aqueous and atmospheric effluent release data and offsite doses calculated for each nuclear power plant in the United States. The data is available from year 1998. The OECD developed the document ‘Thermal Power Uprating in Europe’ which reflects the cooperation of many experts in Europe.. In addition to the uprating data, also included was some ‘Plant data’ and general information available from relevant countries, mostly based on the "IAEA PRIS" data.
EC
The Commission periodically publishes reports on releases to the environment of radioac-tive substances in airborne and liquid effluents from Nuclear Power Stations and Nuclear Fuel Reprocessing Sites in the European Union. These reports cover discharges from Nuclear Power Stations of capacity greater than 50 MWe as well as from (former) Nu-clear Fuel Reprocessing Sites.
Comments on the comparison of data across the sources of data
There is no systematic collection of data covering uprates and related activities, nor there is any specific collection of radiological exposure information. Therefore, the information of relevance for radiological impact of uprates was collected from a combination of sources. While some of the sources were traditional ones, in others the data collection started only recently. Because of that, a meaningful comparison in relation with earlier uprates is not possible. The main source of data that was used for radiological releases cover the years after 1995. Therefore, it was not possible to assess the effects of earlier
To assure the correctness and to be able to corroborate the ISOE data, a comparison with the WANO data base entries for analysed plants was undertaken.
The table below compares ISOE and WANO data for the average recorded Occupational doses during outages (for a period before and after an uprate) with the recorded Occupa-tional dose for the outage during which an uprate was implemented. The assessment was made for several plants that are comparable in their characteristics.
As can be seen from the data in the table, significant differences are visible in some cases between ISOE and WANO data. Even after evaluating the reporting requirements, the explanation for those differences could not be found.
To assure the consistency of any analysis within this project, a decision was taken to ex-clusively use the ISOE data as a figure of merit for the occupations exposures during normal operation and outages. The ISOE Programme is the world's largest collection of information on occupational exposure. The ISOE data collection is structured in a way to relate doses during outages with specific activities undertaken. Moreover the ISOE data separate plant's personnel and subcontractors, thus allowing for a comparison of plants that use external support differently.
Occupational dose in operating year Dose during uprate (annual doses in year uprate was implemented) Before the uprate
(manSv)
After the uprate (manSv)
manSv Examples
ISOE data WANO data
ISOE data WANO data
ISOE data WANO data
Plant1 1.202 1.14 0.879 0.83 3.30 1.49
Unit1/Plant2 1.282 0.99 0.677 0.78 3.22 2.03
Unit2/Plant2 1.432 0.99 0.986 0.78 1.41 2.03
3.3
Content of the data base
Keeping in mind the overall objective of the project, the criteria for cataloguing the in-formation to be collected was established. These reflected the knowledge of elements that are impacting on the radiological doses, and that could be related to the uprate activities. The printout of the Data base containing all information collected is provided in the Ap-pendix 1.
The table below describes the fields that are included in the data base and discusses the contents of each of those.
Field # Title Description/comments Main
Reference 0 Country Country where plant is located
1 Plant name
Plant name with unit indication
(if more uprates were performed, year of the uprate follow the unit designator, i.e. Thiange 2/2001)
WANO PI
2.1 Vendor of NSSS Vendor (GE,WEC, FRAM, etc) WANO PI
2.2 Commercial data
of operation Month, Day, Year, WANO PI
3.1 Reactor type (PWR, BWR)
OECD, Nuclear Engineering 3.2 Initial power Original thermal power in MWt
OECD, Nuclear Engineering 4.1 Thermal power Uprated thermal power in MWt OECD, IAEA,
NRC 4.2 Year
implemented
Year when the uprate was implemented (in some
cases approved, data sometimes inconsistent) OECD, NRC
4.3
Uprate type & total power increase in the percentage for particular year
-MU -Measurement uncertainty (uprates are less than 2 %)
-S -Stretch power (uprates typically up to 7) -E - Extended power (uprates greater than the stretch)
Example:
1985 S 4.1% 2001 E 19.4% The first uprate was in 1985 (4.1%) and the second in 2001 (15.4). The % always indicate the total power increase compared with original design (thus 19.4% in second)
OECD, NRC
4.4 Technical solution
Technical solution for an uprate. Example:
Whether the uprate was implemented by increase of Rx T Avg (with the same FW mass flow) OR T Avg remains same (but FW/MSL mass flow and pressures were increased)
Data entered where available
OECD, NRC
4.5 Equipment Where available, list of main equipment
Field # Title Description/comments Main Reference 5.1 Fuel cycle Length of the fuel cycle - in the months Nuclear
Engineering 5.2
Average linear fuel rating (before uprate)
Fuel rating - in kW/m Nuclear
Engineering 5.3
Average linear fuel rating (after uprate)
Change in fuel rating – kW/m Nuclear Engineering
5.4 Fuel type
Type of fuel used.
Sometimes different types used, depends on core design. Equilibrium cycle fuel entered (when available). Nuclear Engineering 6.1 Annual liquid effluents (before uprate)
Total Liquid release in GBq. (Data from EC used, available from 1995. For US, data
available from 1998) EC 6.2 Annual liquid effluents (after uprate) As above EC 7.1 Annual gaseous effluents (before uprate)
Total Airborne releases in GBq EC
7.2 Annual gaseous effluents (after uprate) As above EC 8.1 Annual occupational dose (before uprate)
Average value of the total collective dose over the three-year period before the uprate in manSv (when three years not available, it is noted in table) ISOE, NRC 8.2 Annual occupational dose (after uprate)
Average value of the total collective dose over the three-year period after the uprate in manSv (when three years not available, it is noted in table) ISOE, NRC 9.1 Occupational dose during outage (before uprate)
Average value of the collective outage dose over the three-year period before the uprate - in manSv (when three years not available, it is noted in table) ISOE 9.2 Occupational dose during outage (after uprate)
Average value of the collective outage dose over the three-year period before the uprate - in manSv (when three years not available, it is noted in table) ISOE 10 Occupational dose during uprate
Doses received during the uprate (if equipment was changed) – in manSv.
Data not systematically available. In some cases data cover annual occupational dose for the year when the uprate was implemented.
Of no relevance for MU.
Classification of uprates
There are considerable economic benefits to uprates because they allow more value (en-ergy) to be generated by the existing plant. Whilst the fuel costs may marginally rise the remaining costs do not increase. This makes uprates highly attractive to the utilities. Nev-ertheless, the complexity and significance of the safety and operational issues associated with uprates make additional gains anything but easy. Comprehensive safety analysis and, depending on the country, re-licensing by the regulator are important elements of every uprate project. Changes in operating practices and methods of maintenance organisation following uprates lead to radiological consequences both in normal operation and during outages.
The aim of every uprate is to increase the electrical power output available from the main generator. This can be achieved by modifying the power conversion system (e.g. turbine, generator, associate equipment) and/or by increasing the reactor energy output.
The development of technology of, in particular, turbines in the last decade is such that many plants increased the power by installing new turbines or parts of them, and achieved the power increase of up to 3%. As this project is focused on radiological issues, the in-crease of the generated energy through modifications on the PCS does not introduce any effects of interest.
The second way to increase generation is to increase the power of the reactor. Typically there are three distinctive categories of power increase (although in the first category, MU, the reactor power is, physically, not increased), as follows:
Measurement Uncertainty (MU) Recapture Power Uprate: uprates of 1 to 2 percent power, typically achieved using more precise techniques for measuring Feedwater flow and/or performing analysis to reduce unnecessary conservatism
Stretch Power (S) Uprate: uprates of 5 to 7 percent power, typically achieved by chang-ing instrumentation set points, re-analysis (to recover excessive margins) together with a small number of major plant modifications
Extended Power (E) Uprate: uprates of up to 20 percent power, achieved by major changes of core design and significant modifications to major plant equipment
The majority of power uprates implemented or planned are in the middle range of be-tween 5 and 10 % nominal power. These typically involve changes to both the reactor and the power conversion system. Some plants have performed different types of uprate on two or more occasions.
Improved measurement and analysis techniques have allowed utilities to increase the licensed power limits of existing plants as a cost-effective method of increasing power. Currently, 76 PWR units (19 Europe and 57 USA) and 45 BWR units (11 Europe, 32 USA and 2 Mexico) have uprated thermal power. Of these, 24% were small uprates of up to 2% increase, 49% were stretch and 27% were large power uprates.
A number of European and Asian utilities are planning to implement power uprates within the next few years:
Dukovany 1-4 (PWR) is planing to increase power for 2.3% in the years 2005-2008 with installation of new turbine blades. It plans a 10% uprate at a later date.
Brokdorf (PWR) is planning 3.9% uprate (date not known) Emsland (PWR) is planning 4.9% uprate (date not known) Grafenrheinfeld (PWR) is planning 4.9% uprate (date not known) Grohnde (PWR) is planning 4.5% uprate (date not known)
Gundremmingen B and C (BWR) are planning 6.8% uprate (date not known) Isar-1 (BWR) is planning 7% uprate (date not known)
PAKS 1, 2, 4 (PWR) are planning 9.1% uprate in 2006 PAKS 3 (PWR) is planning 9.1% uprate in 2007 Kori 3 & 4 (PWR) are planning 5% uprate in 2006 YGN 1 & 2 (PWR) are planning 5% uprate in 2006
Higasidory (ABWR) is planning uprate (% and date not known) Shika (BWR) is planning uprate (% and date not known) Forsmark-1 (BWR) is planning 19.9% uprate in 2010 Forsmark-2 (BWR) is planning 19.9% uprate in 2009 Forsmark-3 (BWR) is planning 25.0% uprate in 2011 Oskarshamn-3 (BWR) is planning 29.8% uprate in 2008
Ringhals-1 (BWR) is planning 11.9% power uprate in not known
Ringhals-3 (PWR) is planning 7.8% uprate in year 2007 and 13.5% uprate in 2007 Ringhals -4 (PWR) is planning 13.5% uprate in 2011
The following table describing intended future power uprates in the USA is based on information obtained from a survey of all licensees conducted in March 2006.
Fiscal Year Power Uprates Expected
MUR SPU EPU MWt
3.4
Conclusions
Some conclusions are raised from the review of the data collected. Issues of interest are discussed in section below.
Relevance of yearly occupational doses:
The data table provided the annual occupational doses for (usually) 3 years average be-fore and after the uprate has been implemented. While this provides (some) insights re-lated with occupation doses, the annual occupational doses are often driven by processes and activities that have nothing to do with uprate, rather with specific repairs and inter-ventions during outages and/or some specific operational issues (i.e. unusual leaks, change of chemistry, material used, etc). In some case, unusual events might add to the collective annual doses. While the averaging over a longer period (i.e. 3 years) remove some of the impact of unusual events or specific repairs, it does not remove it completely. Therefore, it is difficult to make any global conclusions and relate the uprate with any of the annual occupation doses as documented in the data sources used.
Cycle length
In the last decade, many plants decided to extend their fuel cycle (new design of fuel al-lowed for higher burnup) to increase the plant’s availability. In many cases the extension of the fuel cycle coincides with the plant modernisation/modification (which required extensive safety analysis and which were then used to justify the extension of the cycle), which in many cases coincided with the uprate. When a fuel cycle is extended beyond one year, the fact that there was an outage in a given year dominates the annual occupa-tional dose. The three-year averaging tends to remove some obvious peaks (and valleys) , which are present in the data, but not completely, and the exact time of the outage varies and the lengths of about 15 month present additional challenges. Moreover, if the cycle duration was changed simultaneously with the uprate, then the comparison of the annual occupational dose before and after the uprate is (almost) meaningless.
Recognising of the impact of uprates
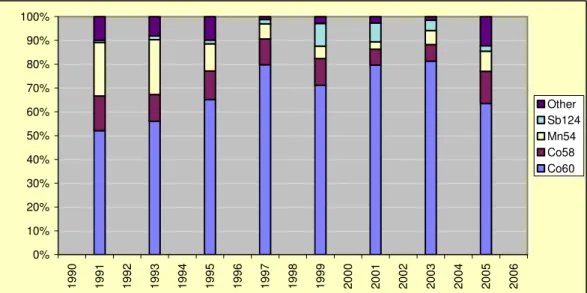
During the process of data collection, some analysis of the data were undertaken to both focus the data collection (and presentation) and make initial conclusions. Some interest-ing patterns, as supported by the graphical presentation below, emerge:
Throughout the world, occupational doses at NPPs have been steadily decreasing over the past decade, mainly through better application of ALARA principles, the use of better shielding material, but also increased attention paid to occupational dose issues. The ICRP suggested reduction in annual limits for radiation workers also impacted the overall doses
Occupational exposure in the BWR plants is typically about 50% higher than in PWR plants, due to specific of the design.
No direct relationship between the uprates and the occupational doses could be estab-lished. The occupational doses on some plants seem to be higher after the uprate, while on others seem to be lower. Without a detailed analysis (on a plant specific level) no gen-eral conclusion could be raised.
As it can be seen when comparing units at multiple units sites (that are presumably oper-ated in a same fashion) even with 3 years averaging does not remove the variations caused by specific events
The three years averaging is helping in “smoothing” some of the obvious variations in the annual occupational doses. Nevertheless (as discussed above) even the 3 years average does not always allow for removing of external effects
Collective Radiation Exposure (CRE) Ringhals2 PWR & Ringhals1 BWR
0 1000 2000 3000 4000 5000 6000 7000 1996 1998 2000 2002 2004 2006 years m a n m S v 3-Yr CRE, BWR 3-Yr, CRE, PWR Figure 3.1: PWR to BWR variation
Collective Radiation Exposure (CRE) Clinton 1, uprate 2002 (20%) 0 500 1000 1500 2000 2500 3000 1996 1998 2000 2002 2004 2006 years m a n m S V
3-Yr, CRE, Clinton2
Figure 3.3: Same site variation among units
Figure 3.4: Effects of the averaging on presentation
Effects of the uprate on fuel failures
The status of and the effects on fuel are one of the most important elements of the uprates, in particular for extended uprates, where originally established fuel margins are exceeded (requiring new design of fuel). This is the reason that the Uprate Database con-tains information on the fuel used in each NPP evaluated. Moreover, fuel failures have a direct negative impact on occupational doses in normal operation and accident releases. Therefore, it is of interest to review the effect of the uprates on fuel by evaluating fuel failures in relation to the time of uprate.
The total number of reported fuel failures since January 2000 has decreased in the US (the trend is the same for scrams and general operational events). However, the number of units experiencing fuel failures increased in the same period (about 80% of all units re-ported fuel failures). The performance of fuel in PWRs and BWRs went in opposite
direc-Collective Radiation Exposure (CRE) Loviisa1 (1977) & Loviisa2 (1981)
0 200 400 600 800 1000 1200 1400 1996 1998 2000 2002 2004 2006 years ma n mS v
3-Yr CRE, Loviisa 1 3-Yr, CRE, Loviisa 2
Collective Radiation Exposure (CRE) Brunsw ick 2, uprate 1996 (5%), 2002 (15%) 0 1000 2000 3000 4000 5000 6000 1991 1996 2001 2006 years m a n m S
V 1-Yr CRE, Brunsw ick2
3-Yr CRE, Brunsw ick 2
assemblies per 1,000 installed) for PWRs is still higher than for BWRs. It appears that whilst all fuel vendors have experienced fuel failures these failures are clustered on spe-cific fuel models.
In PWRs, the dominant fuel failure modes are grid-to-rod fretting followed by debris-related failures (this being greatly reduced by fuel filter and better control during outages with open reactor). On BWRs, the dominant failures are debris fretting (five times higher than for PWRs) and pellet-clad interaction/stress corrosion cracking (PCI-SCC). BWR fuel designs are moving toward more closely packed fuel arrays (10 x 10), increasing the potential for debris-induced failures. With smaller channel dimensions, the possibility of debris-induced failures is greater. On PWRs, most failures are occurring on 11 units (16%). Among BWRs, there are 8 units (25% of total) where most failures occur.
The debris-related failures are hard to relate to an uprate, as it depends mainly on the operation and maintenance processes itself. The rod fretting and PCI are dependant on the fuel loading, but higher fuel loading might be a consequence of an uprate, but also of an extended fuel cycle. However, uprates increased thermal duty in both PWRs and BWRs. Therefore, from a mechanistic point of view, power uprates would be likely to result in reduced margins for fuel.
Contrary to expectation, the evaluation on the distribution of fuel failures and correlating it with the uprates offer a highly inconclusive picture. Only 17 US units did not perform any power uprate at all. Of those, 14 experienced at least one fuel failure. On the other hand, 14 units performed large power uprates (12 BWR and 2 PWRs). Of those only 9 experienced a fuel failure. This suggests that there is no obvious correlation of the power uprate with fuel failures.
Review of recent operational events related to uprates
During the process of data collection the project team initiated some limited-collection and review of information on operational events that occurred as a consequence or are otherwise related to uprates. The aim of this activity was to help identify any specific aspect that could be of interest to consider either during the data collection within or on in depth analysis on selected plants. While no specific issues were identified, some insights of interest were noted, as below.
A review identified more than 40 events that have occurred over the past five years as a result of inadequate design or implementation of uprates. The events involved equipment issues, unanticipated responses to conditions, or challenges for operating staff. The num-ber and types of events indicate that more significant consequences could occur if uprates are not conducted in a controlled manner.
None of the events below had direct consequences on doses to the personnel or releases. However, all of them might have contributed and/or raised the probability of
inci-− Operational transients and equipment damage due to lack of training of plant staff on changes to PCS operating characteristics
− Unanticipated challenges and degraded performance from reductions in margins − Operation beyond licensed power levels for extended periods due to errors in
thermal power calculations following uprates
Steam Dryer Damage at a BWR
After an extended power uprate (18 %), increased steam flow rates led to a high-cycle fatigue failure of a steam dryer cover. The plate broke into several pieces, resulting in a 10-day forced outage to retrieve the loose parts. This condition was not anticipated be-cause the effects of the increased steam flow conditions in combination with existing steam dome forces on the steam dryer were not well understood.
Extended Operation in an Overpower Condition of a BWR
A BWR with stretch uprate was operated at power level greater than 100 % because changes to the process-computer calibration constants for feedwater flow were not identi-fied when the feedwater transmitters were replaced.
Unexpected Feedwater Heater Problems at a BWR
Existing feedwater heater material condition was recognized in the preparation for a stretch uprate, but not implemented due to budget limitations. The problem was identified BEFORE an event occurred. 50 % of the nozzles on the feedwater heaters required repair to mitigate the condition.
Turbine Control System Changes Result in Unanticipated Operational Challenges at a PWR
After a stretch uprate on a PWR, operators experienced difficulty controlling turbine speed and generator load. The need for new operating strategies was not recognized be-fore implementation of the uprate.
Power Reduction at a PWR
Stretch uprate resulted in a reduced-stator cooling water differential-temperature operat-ing margin. A power reduction was required to cope with the situation.
Reactor Instability in a Core after Subsequent Trip of Both Recirculation Pumps in BWR
In parallel with the extended uprate, new fuel elements of GE11 type (9x9 fuel with part length rods) were introduced in a small BWR4 core, thus having a mixed core of GE11 and GE8 (8x8 fuel). During the performance of stability measurements, as part of an uprate, power oscillation was observed. Before this event the plant had not experienced any core power oscillations.
Flow-Induced Vibration Issues (FIV issues) and steam dryer cracking
The commercial nuclear industry has experienced several incidents of steam dryer crack-ing and FIV issues at nuclear power plants operatcrack-ing at extended power uprate conditions.
After installation of new steam dryers in two BWR units in the middle of the year, which had an improved design to increase their structural capability, the licensee discovered significant degradation of the electrometric relief valves (ERVs) at the end of the year. The licensee shut down the units to repair the ERVs and restarted the units with operation up to pre-uprate power levels.
BWR plants had operated for several years at the extended power uprate level with the modified steam dryers without significant damage. Cracking was found later in two units. The licensee repaired the cracks and installed additional modifications to the steam dry-ers. The licensee plans to replace the drydry-ers.
During outage inspection activities cracking was identified on a lower guide rod follower bracket at the base of the steam dryer in the BWR plant, but only after several years of operation at 5 percent power uprate conditions.
Abnormalities in Ultrasonic Flow Meter Instrumentation
Use of ultrasonic flow meter of the type used for MUR power uprates has led to unex-pected but small differences in power level indications at some plants.
No single event listed above has any casual relation with radiological impact at affected plants, but it does not mean that the above events could not be precursors to these events having radiological impact. Moreover, it could be argued that some of the events (e.g. steam dryer) contributed to occupational doses due to need for repair (in the area with increased radiation level).
It should also be noted that most of the events are occurring at units with a power increase of 5% or more, possibly indicating that the system interactions and PCS issues are not always well understood or addressed during the planning or implementation of an uprate.
4.
Analysis of the selected plants
Based on the data collected in the task #1, two PWR and two BWR plants were selected for additional analyses.
4.1
Olkiluoto 1 and 2
4.1.1 Introduction
One of the BWR plants selected for detailed analyses was Olkiluoto nuclear power station consisting of two twin BWR units, Olkiluoto 1 and 2 (OL1 and OL2, both reactors were included in the review). Main reasons for that selection were:
− A considerable power uprate of 25% compared to the initial thermal power level. − Reactor design and operation conditions very close to most of the Swedish
BWRs.
− A good availability of reactor data.
The following sections present the result of the indepth review performed for the OL1/2 plants. Data for the review had been obtained from the TVO utility owning and operating the plants, and great acknowledgment is given to them for supplying the large amount of information.
4.1.2 OL1/2 power uprate
4.1.2.1 Power uprate characteristics
On the west coast of Finland, in Eurajoki, Teollisuuden Voima Oy (TVO) operates two 840 MWe boiling water reactors, Olkiluoto 1 and 2 (OL1/2). Construction work began at Olkiluoto early in 1974. The first reactor unit OL1 was supplied on a turnkey basis by the Swedish company ASEA-ATOM AB (now Westinghouse Electric Sweden AB). In Sep-tember 1975 construction work began on the second identical plant unit. The OL2 unit was supplied on the same principle with the exception that TVO was responsible for the civil construction work. The major subcontractors for the units were STAL-LAVAL Tur-bin AB (turTur-bine plant), ASEA AB (electrical equipment, generator), Uddcomb Sweden AB (reactor pressure vessel), Finnatom (reactor internal parts, mechanical components), Oy Strömberg Ab (electrical equipment) and Atomirakennus (OL1 civil construction). The OL2 civil construction was carried out by a Finnish-Swedish consortium, Jukola. The OL1 unit was first connected to the national grid in September 1978 and the OL2 unit in February 1980.
The units have been uprated twice since the commissioning. The thermal power of each reactor was increased from 2000 MW to 2160 MW in 1984 and to 2500 MW in 1998. The corresponding nominal values of the net electrical output were 660 MWe, 710 MWe
a thermal power level of 125% compared to the initial power level. The net electrical output from the plants during the period 1990-2006 is shown in Figure 4.1.1.
The latter uprate was a part of an extensive modernization program implemented in 1994–2006. After the modernization, the plant units fulfilled most of the safety and tech-nical requirements for new nuclear power plants. The modernization program was in line with TVO´s policy to keep the plant units continually up-to-date technically.
80 90 100 110 120 130 140 1990 1991 1992 1993 1994 1995 1996 1997 1998 1999 2000 2001 2002 2003 2004 2005 2006 R e a c to r p o w e r [%] OL1-Pow OL2-Pow
Figure 4.1.1: OL1/2 – Relative reactor power based on net el. output(100% = 660 Mwe)
The reactor building (Figure 4.1.2) is the dominant and highest building of the plant. It encloses the primary containment of the reactor and serves as a secondary containment. The reactor service room, at the top of the building, contains the reactor and fuel pools with storage racks for fuel and internals, the reactor service bridge for refuelling opera-tions, and the overhead crane for handling the containment dome, the reactor vessel lid and other heavy components. The bottom part of the reactor building contains separate compartments for important safety-related systems, such as the emergency core cooling systems. The reactor containment is a pre-stressed concrete vessel.
The containment is based on the principle of pressure-suppression. This allows for a compact containment design, with the minimum of equipment installed inside the con-tainment. The use of internal main circulation pumps has allowed further reduction of the containment volume. All components requiring regular service during normal operation of the reactor are located outside the containment. The tightness of the containment is
Figure 4.1.2: OL1/2 - Section through the reactor building and the reactor containment 1 – Reactor, 2 - Main steam lines, 3 - Fuel storage pool, 4 - Reactor service bridge,
5 - Reactor service room crane, 6 - Main circulation pumps, 7 - Control rod drives, 8 - Reactor containment vessel, 9 - Control rod service platform, 10 - Blow-down pipes,
11 - Embedded steel liner. 12 - Condensation pool, 13 - Scram system tanks, 14 – Venturi scrubber
The reactor pressure vessel (Figure 4.1.3) is made of low-alloy steel, with a lining of stainless steel. All major pipe nozzles are located above the top of the core, to ensure that the core is kept flooded in the event of a pipe rupture in the primary systems. The reactor vessel hangs on top of the biological shield by means of a welded-on support skirt. The vessel support skirt is located near the primary system pipe connections, an arrangement which minimizes the pipe stresses resulting from the thermal expansion of the vessel. This location also allows for more maintenance space around the recirculation pumps. The reactor internals are designed to allow for fast and safe handling during refuelling operations. Apart from the moderator tank support skirt and the pump deck, which are welded to the reactor vessel, all internals are removable. The internals are held in position in the reactor vessel by means of resilient beams in the reactor vessel cover. When the cover has been removed, the internals can be lifted out of the reactor without breaking any bolted joints. Another related feature is the thermal insulation of the reactor cover, which is fastened to the inside of the containment dome, they are removed together when the reactor is to be opened. The procedures for removing the reactor vessel cover have been considerably simplified by eliminating all the external pipe connections to the reac-tor cover and making the connection inside the reacreac-tor.
Figure 4.1.3: OL1/2 - Sectional view of the reactor pressure vessel
The coolant flow through the core is maintained by means of six internal circulation pumps. The internal circulation pump design is based on the use of wet motors, thus eliminating shaft seals. The motor housing forms an integral part of the reactor vessel. Internal circulation pumps offer a number of advantages over external pumps:
− no risk of major pipe rupture below the top of the core − compact containment design
through a coupling that can be disassembled from the bottom of the motor housing. A pump motor or impeller can thus be removed or replaced without draining the water from the reactor vessel.
The turbine plant comprises a single turbine-generator unit. It is a 3000 rpm tandem-compound, single-shaft machine with one high pressure (HP) cylinder and four low pres-sure (LP) cylinders. The turbine is equipped with a single-pass condenser, mounted across the longitudinal axis of the turbine. The condenser is sea water cooled, and equipped with titanium tubing. The heating of the condensate and feedwater up to a tem-perature of 185°C is carried out in five stages. Both the LP heaters and the HP feed heat-ers are split up into two half-capacity, parallel circuits, each equipped with a bypass sys-tem.
The purpose of the offgas system (Figure 4.1.4) is to limit the emission of radioactive gases from the plant. The system employs charcoal absorption, and consists basically of two decay vessels, two dryers, two fans and three charcoal columns. The gas from the turbine ejectors flows through the recombiner system, the first decay vessel, one of the dryers, one of the charcoal columns, one of the fans and finally the second decay vessel. The xenon content in the offgas flow will be absorbed in the charcoal. When the absorp-tion capacity of the column has been used, the flow is automatically routed through an-other column. The “used” column is then connected to the turbine condenser, and the xenon in its charcoal is desorbed by a small flow of “cleaned” air to the condenser. The main difference between this offgas system and other charcoal-type systems is that it uses a relatively small quantity of charcoal and that the radioactive gases decay in sand beds instead of charcoal columns. Thus, only a small fraction of the radioactive gases, essentially low energy radiation emitters, will reach the charcoal columns.
Figure 4.1.4: OL1/2 – Offgas system
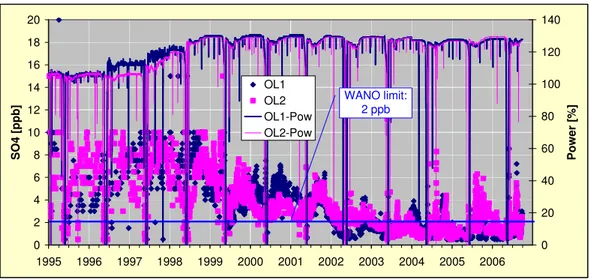
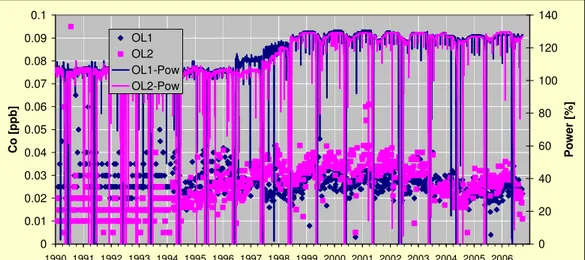
The primary circuit of the reactor operates without chemical additives to the coolant. That means that neither hydrogen gas1 nor zinc2 is injected as in many other BWRs. Feedwater chemistry corresponds to that of “neutral water”, i.e. water with very low electrical con-ductivity. High reactor water purity contributes substantially to reliable operation of the reactor, prevents crud deposits on the fuel rods and reduces the radioactive contamination of the primary systems, thus ensuring better accessibility and lower occupational radia-tion exposure.
The primary circuit water is treated by two independent, coordinated cleanup systems, the reactor water cleanup and the condensate cleanup systems (Figure 4.1.5). The reactor
rate in the reactor water cleanup system was increased after the power uprate to maintain the 2% capacity per filter unit. The cleanup flow is generated by one pump in the shut-down cooling system, through two regenerative heat exchangers and one cooler, to one of the ion exchangers, and returns to the reactor via the regenerative heat exchangers. A portion of it flows through the scram system, purging and cooling the control rod drives. The condensate cleanup (CCU) system, connected between the first and second conden-sate preheaters, comprises seven parallel coupled trains with deep-action, rod-type pre-coat filters. Note that all turbine drainage is cascaded back and cleaned in the CCU sys-tem (Figure 4.1.5).
Figure 4.1.5: OL1/2 – Reactor water and condensate cleanup system (Reactor water: deep bed filters, condensate: pre-coat filter demineralizers)
The reactor cores of OL1 and OL2 contain 500 fuel assemblies each, which means 5 MWth per fuel assembly at present maximum power level, compared to 4 MWth per
as-sembly at initial design power. The fuel assemblies for the first cores and subsequent reloads of OL1 and OL2 were of 8x8 design. Since then, new fuel designs have gradually been adopted. At present 10x10 fuel is used in both reactors. This type of fuel has new features that have made reactor power uprating and more efficient fuel utilizations possi-ble. The linear heat load has in principle been maintained compared to the initial core. Main data for the OL1 and OL2 reactors are provided in the Table 4.1.1.
Table 4.1.1: OL1/2 – Main data
A summary of all modifications that have been introduced in the OL1/2 plants during the period 1994 – 2006 is presented in Table 4.1.2 and Table 4.1.3. Note that all modifica-tions are not mainly due to the power uprates, but in many cases part of the ongoing plant modernization programs carried out. Those two aspects are not always easy to separate, introduced modifications are in many cases addressing both aspects. The major bulk of work in association to the power uprates was performed during the 1996, 1997 and 1998 outages in OL1, and during the 1997 and 1998 outages in OL2. Note also that major mod-ernization work was carried out during 2005 in OL2, and during 2006 in OL1. The varia-tion in outage lengths 1990 – 2006 is presented in Figure 4.1.6. The normal strategy is that a larger outage is performed at one of the plants during one year, but only a shorter outage for refuelling at the other plant, and vice versa the next year. The years 1997, 1998 and 2000, however, display somewhat prolonged outages in both plants. Generally speak-ing, both plants are characterized by short outages and high plant availability, and the modernization and power uprate programs have been carried out with a rather small im-pact on average outage length (imim-pact on occupational exposures will be addressed later in the report).
A summary of all modifications that have been introduced in the OL1/2 plants during the period 1994 – 2006 is presented in Table 4.1.2 and Table 4.1.3. Note that all modifica-tions are not necessarily due to the power uprates, but in many cases were part of the ongoing plant modernization programs carried out. Those two aspects are not always easy to separate; introduced modifications are in many cases addressing both aspects. The major bulk of work in association to the power uprates was performed during the 1996, 1997 and 1998 outages in OL1, and during the 1997 and 1998 outages in OL2. Note also that major modernization work was carried out during 2005 in OL2, and during 2006 in OL1. The variation in outage lengths 1990 – 2006 is presented in Figure 4.1.6. The nor-mal strategy is that a larger outage is performed at one of the plants during one year, but only a shorter outage for refuelling at the other plant, and vice versa the following year. The years 1997, 1998 and 2000, however, display somewhat prolonged outages in both plants. Generally speaking, both plants are characterized by short outages and high plant availability, and the modernization and power uprate programs have been carried out with a rather small impact on average outage length (impact on occupational exposures will be addressed later in the report).
Table 4.1.2: OL1/2 – Summary of modernization work performed 1994 - 1999
YEAR OL1 OL2
1994 • Replacement of two vessels in Condensate
system to SS-steel.
• Replacement of two heat exchangers in Con-densate system.
• Replacement of core grid.
• Replacement of RHR syst. piping app. 185 m outside of containment.
• Replacement of Main generator.
• Replacement of two vessels in Condensate system to SS-steel.
1995 • Modifications of operating equipment of
per-sonnel air lock doors of PS-containment
• Modifications of operating equipment of personnel air lock doors of PS-containment. • Replacement of four heat exchangers in
Con-densate system
1996 • Installation of two new safety relief valves with
blow down piping.
• Replacement of LP3- and LP4-turbines. • Replacement of Main generator. • Modifications of HP-turbine. • Modernization of turbine automation. • Increase of capacity of Secondary cooling
systems.
• Replacement of condensate lines to SS-steel (app. 50 m)
• Modernization of Reactor service bridge.
• Increase of power to 113% (2268 MW).
• Preparation works for the 1997 moderniza-tion.
1997 • Installation of new Moderator tank head /
Steam separator unit.
• Replacement of 2 valves and some piping in RHR syst.
• Replacement of some piping in the Core spray syst.
• Replacement of LP1- and LP2-turbines. • Modernization of Condensate pumps P1-P6 and
modifications of Condensate pipelines. • Change of Generator switch.
• Installation of new Moderator tank head / Steam separator unit.
• Installation of two new safety relief valves with blow down piping.
• Replacement of LP3- and LP4-turbines. • Modifications of HP-turbine.
• Replacement of some piping in the RWCU syst.
• Increase of capacity of Secondary cooling systems.
YEAR OL1 OL2
1998 • Modifications of HP-turbine and replacement
of shaft sealings.
• Replacement of six vessels in the Reheater and moisture separator syst. to larger.
• Installation of new moisture separators in steam lines to the Reheater and moisture separator syst.
• Related to the modifications of turbine plant, replacement of plenty of pipelines in Reheater and moisture separator and Steam extraction syst.
• Modernization of the reheaters in the Reheater and moisture separator syst.
• Replacement of HP-regulator valves to larger and changes for main steam lines.
• Lifting of level of two condensate tanks (1 m) • Modernization of Boron syst.
• MODE-project complete. Increase of power
to 2500 MWth (840 MWe net)
• Replacement of 2 valves and some piping in RHR syst.
• Replacement of LP1- and LP2-turbines. • Modifications of HP-turbine and replacement
of shaft sealings.
• Replacement of six vessels in the Reheater and moisture separator syst. to larger. • Installation of new moisture separators in
steam lines to the Reheater and moisture sepa-rator syst.
• Related to the modifications of turbine plant, replacement of plenty of pipelines in Reheater and moisture separator and Steam extraction syst.
• Modernization of the reheaters in the Reheater and moisture separator syst.
• Replacement of HP-regulator valves to larger and changes for main steam lines.
• Lifting of level of two condensate tanks (1 m) • Modernization of condensate pumps P1-P6
and modifications of condensate pipelines. • Change of Generator switch.
• Modernization of Boron syst.
• MODE-project complete. Increase of
power to 2500 MWth (840 MWe net)
1999 • Modifications of Core spray pipelines inside of
RPV.
• Assuring the opening of two safety relief valves during severe reactor accident conditions. • Commutation of halon to halotron in Fire
ex-tinguisher system.
• Modifications of Core spray pipelines inside of RPV.
• Assuring the opening of two safety relief valves during severe reactor accident condi-tions.
• Commutation of halon to halotron in Fire extinguisher system.
Table 4.1.3: OL1/2 – Summary of modernization work performed 2000-2006
YEAR OL1 OL2
2000 • Replacement of two valves in the RHR syst.
and parts of the piping after these valves. • Replacement of steam extraction pipelines from
LP1- and LP2-turbines to one LP feedwater heater.
• Replacement of the main part of the piping of the Flange cooling syst. in- and outside of the containment.
• Changes for the suction lines of pumps P1 and P2 and modification of the tank T1 of Boron
• Replacement of steam extraction pipelines from LP1- and LP2-turbines to one LP feed-water heater.
• Changes for the suction lines of pumps P1 and P2 and modification of the tank T1 of Boron syst.
2001 • Modifications introduced for lower personnel air lock of PS-containment by considering pos-sible steam explosion.
• Replacement of one valve in the RHR syst. and part of the piping after the valve. • Replacement of the main part of the piping of
the Flange cooling syst. in- and outside of the containment.
• Install of a new service valve in Flange cool-ing system.
• Modifications for the fluid couplings and changes of the rotor wheels of the feedwater pumps P301. P302 and P304.
2002 • Replacement of the water mixing location of
Feedwater and Auxiliary feedwater system. • Install of a new service valve in Flange cooling
system.
• Modifications for the fluid couplings of the feedwater pumps P301 and P302.
• Modifications introduced for lower personnel air lock of PS-containment by considering possible steam explosion.
2003 • Modifications for the fluid couplings of the
feedwater pumps P303 and P304.
• Replacement of the feedwater spargers in the RPV.
• Condensate cleanup project, including proc-ess modifications, replacement of heat ex-changer E1 and increasing the pressure of condensate pumps P5 and P6 with 3.5 bar.
2004 • Replacement of the feedwater spargers in the
RPV.
• Main steam line supports replacements. • Condensate cleanup project, including process
modifications, replacement of heat exchanger E1 and increasing the pressure of condensate pumps P5 and P6 with 3.5 bar.
• Preparative works for the replacement of Mois-ture separator / reheaters and retrofit of HP tur-bines at 2006.
• Main steam line supports replacements. • The "old" feedwater spargers were placed
back.
• The preparative works for the replacement of moisture separator reheaters and retrofit of HP turbines at 2005.
2005 • Preparative works for the replacement of
Mois-ture separator / reheaters and retrofit of HP tur-bines at 2006.
• Main steam line supports replacements.
• The replacement of Steam dryer in RPV. • The replacement of repaired feedwater
spargers.
• The replacement of HP-turbine (rotor includ-ing blades, inner casinclud-ing includinclud-ing stationary blades, steam inlet piping).
• The replacement of steam Reheater / moisture separators and drainage piping and tanks. • Main steam line supports replacements.
2006 • The replacement of Steam dryer in RPV.
• The replacement of HP-turbine (rotor including blades, inner casing including stationary blades, steam inlet piping).
• The replacement of steam reheater / moisture separators and drainage piping and tanks. • Main steam line supports replacements. • Replacement of one inner isolation valve in
RHR syst. and one valve in the Flange cooling syst. in the containment.
• Inspections and repair of the LP4 rotor because of the stress corrosion cracks.
• Main steam line supports replacements. • The "old" Steam Dryer were reinstalled