I . I
Cl:.
c.
R
COPY
2 fo-r t~e by f3ol :0. ?.es:-11 ck C~, ·r 1 l En!!:.nceri!"L": Ss ctic:-1Colorad o .Ag1:' i cul tu ral ;::x:r:; eri men t 3ta t i on
F6rt Collins , Ccl or ~d o
prep.1.r ed. fo r
EN~I~UJU~G
R SEARCH
DEC 1 7
'7C
FOOTH lL<> R£ADI~G HOOM r:orthern Colorado ~·~at ura l Reso'...lrces Associ a tionFort Coll i ns , Colorado
tr~ rou -sh
Th e Color a do Agri cul tur a l hese ~rch Foundation
T A B L E 0 F C 0 N T E N T S
E'U:8.E'·lORD
SYNC? SIS
I ~ IN~:EODUC~ION
'J'he P:r·o bl ~m
I'f, METHODS CF ANALYSIS
PAG:S i ii 1 1 2
Precl.pitation on Target Area 2
Preetp.l.tation on Ta:get A:r-t3a Versus Control 2
.Area
Snowfall on Ta~gat Area 3
Snowfall on Target Area Versus Control Area 3
Precipitation on "i'iestern United States 3
Precipitation Patterns 3
III . RESULTS OF A~ALYSIS
Pre cipitation on Target Area
5
5
Precipitation on Target Area Versus 6
Control Area
Snowfall on Target Area
6
Snowfall on Target Area Versus Control Area
6
Precipitation on Wester n United States 6
Precipitation Patterns
7
IV. CONCLUSIONS 8
V ~ GENEF.AL OBSERVATIONS 10
TABLES 11
FORE\JORD
The analysis of climatological data described in this report was made for the period I:'larch 1, 1951 to June l s 19511 during the
cloud-seeding operations by the Water Resources Development Corporation of Denver~ Colorado, covering a target area roughly
defined as the valleys of the Cache la Poudre, Big Thompson, and St. Vrain Rivers east of the Continental Divide. The study was authorized by a contract between the Colorado Af.ricultural Re-search Foundation of Colorado A
&
M College, through the Civil Engineering Section of the ~xperiment Station, and the NorthernColorado Natural Resources Associationo
lv'Ir? ~!illiam D. Farr~ President, NCNRA, and l"ir. Donald i{.
Fa::anham, Acting Secretary .• NCNRA, were in consul tat1on with Colo-:raC:o A & 11 College staff members and made valuable suggestions
~ur~ng the course of the study.
The Section Chiefs of the U. S, Weather Bu~eau and Mr . Homer
J. Stock,·.rell, Irrigation Engineer, Soil Conservation Service,
USDA, 1,rere very cooperative in making available climatolog1.cal
data.
~rof. Andrew G. Clark, Head, Mathematics Department, Colorado
A
&
1'-1 College, advised on t;he statistical analysis of the clima-tological data.College staff engineers ~.rho contributed to the studies 't'ITere
Prof. Maxv.rell Parshall1 Nho assisted in the assembly and analysis of the climatological data; . Mr. Irving S. Dunn~ who advised on the
meteorological aspects of the analysis and reviewed the report; Mr . James R. Barton, who assisted in the analysis of the snowfall data; Nr. Chong-.Hung Zee, 1rrho assisted in the analysis of the precipitation data; a.'Yld Mr. Victor Grimm, 1•7ho assisted in the assembly of the data for the report.
P~. D. F. Peterson, Jr., Chief of tbe Civil Engineering
Section, assisted in analysis of the results and preparation of the report. Dean T. H. Evans, Chairman of the Engineering
DiVision of the Station and Dean of Engineering, advised on direction of the work and assisted in analysis of results and preparation
ot
the report. Prof. Sol D. Resnick was leader of the project. As such he had major responsibility for organiza-tion and technical d.i:rect:!..on of the '"'ork, analysis of results, and preparation of the report .Cost of the study was borne by both parties to the contract. The College contributed the time of its personnel, "!r.rhich in Prof . He snick 1 s case was t1..ro .... thiro.s time for four and one-half months.
The NCNa~ paid the costs of student assistants , travel, communi ca-tion ~ extra rain ga~ es, and report preparation.
SYNOPSIS
Presented i.n this report is an analysis of the clima- · to:ogical data for the period March
1, 1951
to June1, 1951,
during the cloud-seeding operati ons over north central Colorado.The results of the various methods of analysis are as follows: the March, April, and May ,
1951,
mean depth ofpre-cinitation on the target area was
4.36
inches as compared to a f orty-year normal of5o40
inches and the pro babilit y study revealed that the4.36
inches which fell during the three month period on the target area has been e qu~led or exceeced69
per-cent o: the time or approximately every two years out·of three. Secular series studies for the neriod of March, April, and
May indicate a signific ar..t up1•J&rd trend in precipitation and the presence of a possible wet cycle.
The mean denth of nrecipitation on the control area for the month of :f\~arch,
1951,
'tll[as found to be62
percent of t h enor mal mean depth of precipitation on the cont rol a rea for t he month of March , whereas t t e mean depth of precipitation on the target area for the month of March,
1951,
was found to be52
percent of the no r mal mean d epth of preciFitation on the target area for t h e month of lJiarch.
The mean depth of snow-water content increase on t he target area for the period of Harch and April,
1951,
was4.9 ·
inches as compared to a thirteen-year normal of3.1
inches~ However, theaoove normal water content increase for the period of March and April,
1951,
was apparently the result of the below normalmonthly temperatures, which reduced the snow melt, for the same period.
The mean depth of snow-water content increase on the con-trol area for t he period of March and April,
·1951,
was lL~7percent of the thirteen-year normal; whereas, the mean depth of water content increase on the target area for the same period was
158
percent of the thirteen-year normalQA study of t he precipitation in the western United States for the period of March, April, and May,
1951,
showed that in general the Pacific coastal states, the eastern Rocky Mountain st ates, and the southwestern states were below normal in pre-cipitation; whereas, the western Rocky r.1ountain states, t he plains states, and the mi d-western states were above normal in precipitation.The analysis in which the isopercential theory was used to determine the changes in patterns and amounts of rainfall due to cloud seeding was not completed be cause of limited
The results indicate that there was no apparent increase in precipitation resulting from ·cloud seeding during the
period Tvlarch 1, 1951, to June 1, 1951, over north central Colorado"
There is also no proof that possibly good results cannot be brought about by artificial cloud seeding. Extensive field experimentation over a period of years, under conditions t hat permit scientifically ade quate observation, may be required
to establish the degree of success which cloud-seeding opera-t i ons may be expecopera-ted opera-to achieve.,
The report by tfue American Institute of Aerologica l Research , Denver, Colorado7 on cloud-seeding operations in northern Colorado during the period March 1, 1951 to June 15, 1951, contained the following conclusions:
"1. In the period ~Jiarch 1, 1951 to June 15, 1951
generator operati ons for the benefit of northern Colorado totaled 1013 hours and 17
minutes9
2. Weather conditions for cloud seeding opera-tions were generally poor with only one good seeding inter val in each of the months of r~'lay
and June.
3~ Precipitation over the project averaged
slightly below normal during the period of ope r ations.
4.
It is probable that seeding operations pro-duced an inc r ease in pr ecipitation of betweenzero and
5
percent over what would have fallen naturally."CHAJ?TER I INTRODUCTION
The evaluation of cloud- seeding result~? is kno't-m to be
extremely difficult, and perhaps even i mpossible because of the tremendous variation and extremes of natural ''ITeather phenom-ena. The analysis of precipitation records which 1s presented herei.n was undertaken wlth a full realization of the possibility t hat for the short perioa considered nothing significant mi ght be detected. The change resulting from seeding operations can be detected only if of unesual statistical significance ~hen
compared by approved scientifi.c methods to past precipitation records. Lack of any s1gni.ficant changes for even a season, on the other hand, indicates that there is no real evidence for the success of the operation.
Colorado A
&
N College decided to enter into this study for the NCNRA because it 1·r1shed to ass1:st in seeking answers to the many questions raised about artificial cloud seeding. It was an opportunity to asslst the public, which it serves, and at least determine some of the problems involved in evaluation of this new de·velopment . The staff hoped ~lso that somedef1n1 te recommendations could be made 1,rhich might ass.tst in evaluations of future operations and in improvement of the type of contract used ~
The Problem
_ _ The study undertaken is concerned N'i th analyz1.ng the attempts to increase precipitation1 improve precipitation pat terns, and reduce the Neather extremes of violent dov..rnpour and excessive erosi on and destruction ~ The target area :t.s
outlined accurately on the map attached as Fig. 1~ It oan be
defined roughly as the valleys of the St . Vrain; Bi.g Thompson, and Cache la Poudre Rivers east of the Continental Divide and north to the Wyoming border .. The period co'ITered by this study 't'laS for March~ April, and Hay of :L95l.
CHAPTER II ¥lliTHODS OF AlALYSIS
Tho methods used in the analysis of the attenpts to in-crease precipitation and improve precipitation patterns
~JOrc develo;>c d during the progress of the study.
One me t hod of evaluation considered was that of using scientific forecasts of what would happen if artificial nuclei had not been introduced . Af ter a pilot attempt to cor:'clate commercial and govern.."ilental forecasts with actual occurrences was made t his method was abandoned as too un-reliable or indefinite to enable the investigators to detect
s~gnificant change s if they occurred.
The attempts to increase tho total pre cipitation were therefore analyzed by t he following methods: statistically studying precipitation on the target area and a control ar ea ; comparing snow pack on the target area nnd a control area; and st~dying the rainfall patterns over the entire western
United States.
Precipitati on
££
Tar get ~~The statistical study of precipitation on the target area consisted of computing the mean depth of precipitation on the t arget area for each year from 1911 through 1951, using the Thiessen polygon method , f or the months of l\1arch, April ,
Hay, and the surr.mation of tho three months. The artificial nucloati .on operations for the target area lend t hemselves in general to an investigation o~ the cumulative effects on
monthly precipitation which may be produced by sustained cloud seeding • . A plot was drawn for each of the periods, consisting of mean depth of precipitation on the target area versus
years, fortyw,year normal mean depth of precipitation on the target area, and forty~ and fifteen-year secular series . A
moving ten-year secular series for the three month period was also computed and plotted. The above time series studies were made to denote trends in total monthly and seasonal precipitation. Probability curves were then plotted and the frequency of occurrence of the precipitation which occurred during the s eeding period was computed.
Precipita tion .£!! Target Area VersuE. Control ~
Comparing precipitation on the target area and control area, see Fig.
1,
consisted of computing the normal mean depth of .precipitation on the target and control areas by the isohyetal method for the month of March and the mean depth of precipitation on the areas for March, 1951. The ratios of Harch,1951,
precipitation to normal Harchprecipitation for target and control ~reas were compared.
Seeding operation~ were undertaken in the control area
during the month of April, 1951, and hence this method of analy sis vras possible only for the month of March. T~c
control area was chosen on the basis of correlation studies betHeen stations in the target and control areas.
Snowfall £g Tar get Area
The effect of seeding on the snow pa ck in the target area was studied statistically by computing the mean depth of water content change of the sno1rr on the target area, using an arithmetical mean, for the months of Harch and April, and summation of the tt·JO months .:fbr each year from
1938 through 1951 . Snowsurvey information was not avail -able for the month of Nay . A plot 1.1as drawn for each period consisting of mean depth of water -content change versus years and the thirteen-year normal mean deptn of water content
change . Snow- pack records are based on monthly snow surveys made through April of each year by the Soil Conservation
Service and, hence, the a~ount of snow melt, which depends
to a great extent on temperature, between surveys, affects the sr:ow-pack value s obtained almost as much as the snm,Ifa.ll itself during the i nterval . Therefore a study was made
showi ng the relationship of 'ivater content change and ternpera-ture for the months of i'Iarch and April, and the summation of the two months for each year from 1938 through 1951.
SnoHfall
E.!l
Target Area Ve rsus Control AreaCompari ng snow pacl{ on the targe t a:r>e£' and control area, see Fig . 1, con sisted of comparing mean depths of water
content change for the periods of March, April, and the summation of the two months for each year from 1938 through
1951.
Preci pitati£!! .£!} ~ter£ United States
Another !nethod of anal ysis used consisted of findi ng
nornals f or I1arch, April, May, and the summation of the three months .for stations with precip itation records of forty-five
to fifty-five years chosen in the United States west of the lvJ:ississippi River . The rainfall of rtrarch, April, ~1ay , 1951,
and t h e sumn1at~on of the three months was computed as a percent of the normal and points of equal percentages above and below normal were connected. The resulting patterns shm-r hov.J the .seeded area compares with other sections of 1v-estern United States in terms of normal preci~i ta tion.
Correlation studi es were r1ade bet1-reen stations in seeded and non- se eded areas .
Precinitati on Patterns
over the area. In order to investigate this possible effect, the rainfall patterns on the target area and immediately
east of the target area in eastern Colo~ado, western
Nebraska and Kansc..s ·;..rere studied, using the Corps of Engineers isopercential theory . This theory is based on the observed fact that in basins which have pronounced oro-graphic effects, the rainfall depths of various sta tions for a particular storm tend to be uniforril percentage of a normal for the storm type regardless of the masnitude of the rain-fall, the altitude of the station, or the position of the sta tion Hith relation to " rain shadows" . Isopercential patterns consisting of lines co m1.e cting points of equal percentage are dra.1.·m for type storms which occurred during
t h e se eding period and compared with the patterns of storr.1s of the saree t yp e occurring pri or to the seeding period. "Hi thin type groups of past storm statistical methods of
co .. _parison are used . One metl od, concerning the targe t area only , consisted of computing the standard deviations of the precipitation recorded at stations on the target area from the mean depth of preci pitati on on the area as a percent of the n ean depth and also in ablsolute values for similar type storms whi ch occurred durins and prior to the seeding period. Prooabili ty curves 1.-.rere then plotted for each case
and the frequency of occurrence of the standard daviations 1.vhich occurred duri nc; the seedi ng peri od were computed.
This me thod was also used f or de termlni ng any change in rainfall distr:.bution resulting from cloud seeding for the period of Uarch, April, and Hay, 19.51, as compared ~Jith the
same period for each year from 1911 through 19.50 .
CHAPTER III RESULTS OF A!fALYSIS
The results of analysis of the climatological data for the period March 1 , 1951 to June 1, 1951, during the cloud-s3e cing operations over north central Co:orado are presented in the following discussi on .
Pre cipitation££ the Tarset ~
In the sta tistical study of the mean depth of precipitation on the t arget area the followi~g results were obtained . In
each case the month or group of months was cor.1pared to the forty- year normal fo r that month or group, and the probability of that occurrence being equalec or exceeded was cal culated from the charts so plot ted . See Figs. 2-9, inclusive, and Table s 1-13, inclusive.
Honth He an Percent of time Approximate or 40···year depth Equaled or Years Equaled
Gr~~ No:r'!11al ]:.951 Exceeded or Exceeded
Harch 1.05 0.49 72'/a 3 out of 4
April 1 . 98 1.39
58%
3 out of ,_J~
Hay 2.37 2.47 40% 2 .out of
5
r-1ar-l'1ay inCL 5 . 40 4 -36 69% 2 out of
3
The t abulation shows, for exar>J.ple, that during Harch, 1951, 0.49 inches of rain fell, whereas the normal mean depth of precipitation on the target area for r1arch over the past 40 years has been 1 , 05 inches . It further shows that in approximately three out of every four years the March rain-fall has exceeded that of r·Tarch, 19
51 .
Considering the tvhole Harch-April-Hay period, the 1951 depth of 4 .36 inches isloss than the 40-year nornal of 5 . 40 inches . In tHo out of every three years the natural rainfall has exceeded that for the 1951 cloud-seeding period . The rainfall for Hay, 1951, slightly exceeded the normal, however two years out of five are naturally wetter than Hay, 1951 .
The forty- and fifteen-year secular series studies of rr-ean depth of precipitation on the target area revealed that the 1'1arch , April, and Nay trends are relatively insignificant , see Figs . 2, 4 and 6; vJhereas, for the summation of the three months , the forty- year tre r~d i s 0 . 0111 inches per year upward
and the fifteen- year trend is 0 . 0611 inches per year upward. Both of these trends can be co ns idered signi ficant, see Fig .
8
and T&bles 14 and 15. The moving ten-year secular series study for the su.li'..mation of the three months, see Fig . 10 and Table 16, revealed a possib"l.e cyclic trend, wnich indicates the presence or a series of wet Spring pe~iods, and a signiftcant
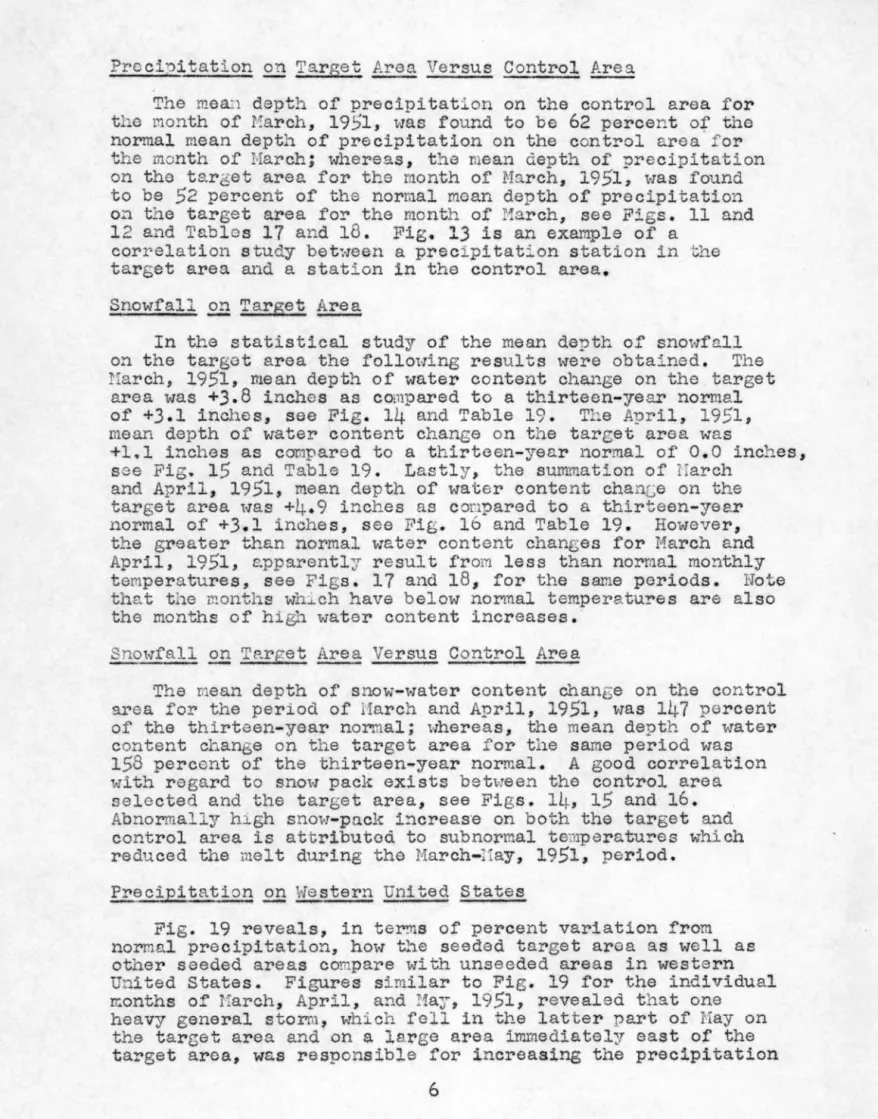
Preciuitation ~ Target Area Versus Control Area
The meaYl depth of precipitation on the control area for t he month of r1arch , 1951, 1r.ras found to be 62 percent of the normal mean depth of precipitation on the control area f or t he month of Narch; whereas, the mean depth of precipitation on the target area for the month of .Harch, 1951, was found to be
52
percent of the normal mean depth of precipitation on the target area for the month of f.1arch, see Figs. 11 and12
and Tables17
and18.
Fig. 13 is an example of a correlation study bet~reen a precipitation station in thetarget area and a station in the control area. Snowfall ~ Target ~
In the statistical study of the mean depth of snowfall on the target area the follouing results were obtained. The r1arch, 1951, mean depth of water content change on the target
area was +3. 8 inches as COillpared to a thirteen-year normal of +3.1 inches, see Fig. 14 and Table 19. T .... e April , 1951,
mean depth of water content change on the target area was
+1.1 inches as compared to a thirteen-year normal of 0.0 inches, s ee Fig. 15 and Table 19. Lastly , the summation of riarch
and April, 1951, mean depth of water content chanGe on the target area Has +4.9 inches as con pared to a thirteen-year normal of +3.1 inches, see Fig . 16 and Table 19. However, the greater than normal water content changes for Harch and April, 1951, epparently result from less than normal monthly t emperatures, see Figs.
17
and18,
for the same periods. Note tha t t he months which have below normal tempera.tures are also the months of hi ~~ water content increases.SnoHfall .££: TP .. rget Area Ve rsus Control ~
The mean depth of snow-water content change on the control area for the period of l''Iarch and April, 1951, was 147 percent of the thi rteen-year normal; lvhereas, the mean depth of water content change on the target area f or the same period was
158
percent of the thirteen~year normal. A good correlationwith regard to snow pack exists between the control area selected and the targe t area, see Figs . 14, 15 and 16.
Abnormally high snow-puck increas·e on both the target and control area is att ributed to subnormal temp eratures whi ch reduced the melt during the Narch-I'Iay, 1951, period .
Precipitation £Q We stern United States
Fig. 19 reveals, in terms of percent variation from normal precipitation, how the seeded target area as well as other seeded areas compare with unseeded areas in western United States. Figures similar to Fig. 19 for the individual n:onths of' Narch, April, and HaJ~, 1951, revealed t hat one
heavy general storm ~ whi ch fell in the latter part of l':fay on
t he target area and on a large area imrnediately east of tpe target area, was responsible for ~ncreasing the precipitation
for the period of March, April, and May, 1951, to near normal and above normal for many precipitation stations in eastern Colorado and western Ka~sas and Nebraska .
Correlation studies between stations in the seeded areas and unseeded areas to the east, see Fig. 20, show that the stations in the seeded areas received less precipitation
during March, April and May, 1951 than would normally be indi-cated on the basis of the correlation.
Precipitation Pattern~
A visual comparison of·the isohyetal patterns on the target area for l\~arch, 1951, and the normal March , see Figs . 11 and 12~ revealed no significant improvement in the
rain-fall pattern for March, 1951, due to cloud seeding.
The analysis in which the isopercential theory was used to determine the changes in patterns and amounts of rah1fall due to cloud seeding was not completed because of limited· funds . After drawing isohyetals for eight similar storms,
each of which was caused by a synoptic situation which resulted in a circulation from the east over the tar.<:set area, an
abbreviated approach also based on the isopercential theory '.'las used. This shorter method of analysis consisted of using precipitation stations on several east-west lines from western Kansas to the continental divide and drawing profile s of
pre-cipitation depths, see Figso 21 and 22, for the above type of storms, which occurred prior to and during the cloud-seeding period. The profiles of precipitation depths for storms occurring prior to the seeding period did not show any con-sistency and hence could not be used for comparison with profiles for stor~s occurring during the seeding periodo
The abbreviated method , therefore, is apparently not suit-able for determining changes in patten1s and amounts of
CHAPTER
rJ
CONCLUSIONSThe results of the analysis of the c:imatological data
Jed to the conclusion that there Has no appapent increase in pre cipitation as a res 1lt of cloud seeding over north central Colorado for the period of March 1, 195~ to
June 1 , 1951 .
'rhe above conclusion is supported by the folloHing results of the analysis:
1 . ').1he mean depth of precipitation on the targe t area during the seeding period was less than normal and has been equaled or exceeded naturally every two years out of three for the past forty years.
2. The precipitatiop on the areas to the east and west of the seeded area was above norma:.. durint:, the cloud-seeding period. A conclusion that the natural precipitation on the tarGet area would have be en significantly less than that which actually fell is held to be unlil!ely.
3.
The mean depth of precipitation, as a percent ofnormal, on the control area for Harch, 1951, was approxiraately equal to the mean depth of precipitation, as a percent of
normal, on t he target area for Harch, 1951. This does not indicate any increase in precip itation on the target area due to cloud seeding. The a )proximation of equality was used, alth ough the control area was ten percent higher than the target area, because a di fference of this magnitude observed fo r only one period i s not considered significant, either as to the degree or the cause.
4.
The mean depth of snow-water content i ncrease , as a percent of normal, on the control area for the period of March and April, 195l,was approximately equal to the mean depth of snow-water content increase, as a percent of normal, on the target area for the same period. This does notindicate any significant increase in snow pacl( in the target area due to cloud seeding . As;ain, the approximation of
equality 'tvas used, al tho-:.1.gh the target area was eleven percent higher than the control area, because such a small difference
was not considered significant in view of the short period considered . If such a difference were maintained consistently over a long period o~ years under similar temperature
con-di tions, then the question would arise as to the cau se . The mean depths of snow-water content increase on both the
control and target area were above normal for the period of
~:arch and April, 1951, but the greater than normal increase
for both areas 'tvas due, in part at least., to the below normal m.onthly tenperatures and re sulting decreased snow melt for
the same period .
•
In spite of its limited use in the above analysis the isopercential theory appears to be a promising method of determining changes in rainfall patterns and amounts due to
cl~ud seeding in basins which tave pronounced orographic
effects. Even the abbreviated method if refined further by using an average of precipitation depths for several precipitation stations on the same elevation on approxi-mately a north-south line instead of using only precipita-tion depths for single staprecipita-tions on the east-west line as in this analysis, may prove to be a valuable elevation method •
The·report by the American Institute of Aerological Research, Denver, Colorado, o~ cloud-seeding·operations in
northern Coloradu during the period, March 1, 1951 to June 15, 1951, contained the following conclusions:
"1. In the period March 1, 1951 to June 15, 1951 generator operations for the benefit of northern Colorado totaled 1013 hours and 17 minutes.
2. Weather conditions for cloud seeding operations vvere ~enerally poor with only
one good seeding interval in each of the . months of r"lay and June.
3. Precipitation over the project averaged slightly below normal during the period of operations.
4.
It is probable that seeding operations produced an increase in precipitation of between zero and 5 percent over what would have fallen naturally."As a result a cloud··seeding h ave been made.
on the specific to any project .
CHAPTER V
GENERAL OBSERVJ.TIONS
of t:'le ex?erience gained by this analysis of experiment, the following general observations
Uhile t he first observation has bearing project studied the remainder. might pertain
1 . Note that the \JRDC'S forecasts for Harch, April .• and then May,
1951,
predicted above normal precipitation for t r is area. The U. S. Weather Bureau forecasts were also of t he same nature. The statistical trend lines shown in the report indicate the possibility of a wet cycle. All of these factors reinforce the need for more research in the field of artificial nucleation to explain the dry spr ~ ng period underseeding.
2 . The discoveries, experiments, and conclusions of many prominent scientists strongly support the opinion that the science of increasing precipitation may have great
pos sibilities. There is, however, no asre ement at all at the present time among outstanding meteorologists that
economically significant changes can be brought about. The Civil Engineering Secti on Staff f i rmly believes that much more experimentation on a field scale of practical size
should be carried out for several years in order to determine t he pertinent facts and to apply t h ose facts to intelligent pr actical use . Evaluation should be done by an impartial scientific agency. The staff is convinced, further, that t h is worlr must be accomplished on a strictly scientific ba sis with t h e primary objective of obtai ning the necessary basic informa tion. This means ade quate control areas in the vi cinity of target areas, close cooperation between operator and evaluator, and adequate staff to do the job.
3.
A possibility of obtaining comparison between natural and artificial results mi ght be to pick days at random on wni ch t h ere would be no seeding , as agai nst day s when seeding would be tried.4.
To promote mutually beneficial research cooperation be t ween the operator and t he evaluating agency (as arepre-sentative of the purchaser), a staff member of the latter should observe and consult wi th the operators frequently during the contract peri od.
5.
i.fuile more seas ons of research will undoubtedly lead to better methods of evaluation and analysis, the methods used in this report are believed to be as good as any now available and that they are sufficiently sensitive . to indicate any significant changes wh ich may occur. -v;henthe study is of a longer duration, the methods would be even more sensitiveo If significant changes are detected then the question will arise as to how much may be attributed to artificial means. A distinct improvement in analyzing cause and effect that definitely needs to be brought about for future evaluations is to require the operator to notify the purchaser of details of his operations on the day they take place. This will assist in evaluation studies as well as in checking on the operator's estimate of a seeding
opportunity. It does not appear unreasonable to request operators to " call their shots" as a means of further strengthening an evaluation.
6.
The purchasers would be spending money wisely to cooperatively provide adequate staffs to evaluate one ormore projects. During the developmental years in the science of artificial nucleation, when all efforts are unproven and
subject to great controversy, it would appear economically desirable to be certain that the results would not have occurred naturally.
7.
There is need for a more elaborate study, which would include tracking storms to learn in detail what they did during their complete movement . This will serve the purpose, among other things, of determining just where the moisture falls and whether or not precipitation in one arearobs any other area along the storm path.
g.
A fairer type of contract for the purchaser, during the unknown and uncertain stages in the aevel opment of this science, would include a performance re quirement. Examples of this t ype of contract are the ones drawn up for the Tri-County operation in Oregon and the San Luis Valley operation in Colorado.9.
Other independent evaluation studies have been made by the Oregon State College Agricultural Experiment Station in collaboration with the U. S.Soil Conservation Service. The reports in general state that there was nocon-clusive evidence of changes in precipitation as a result of cloud seeding.
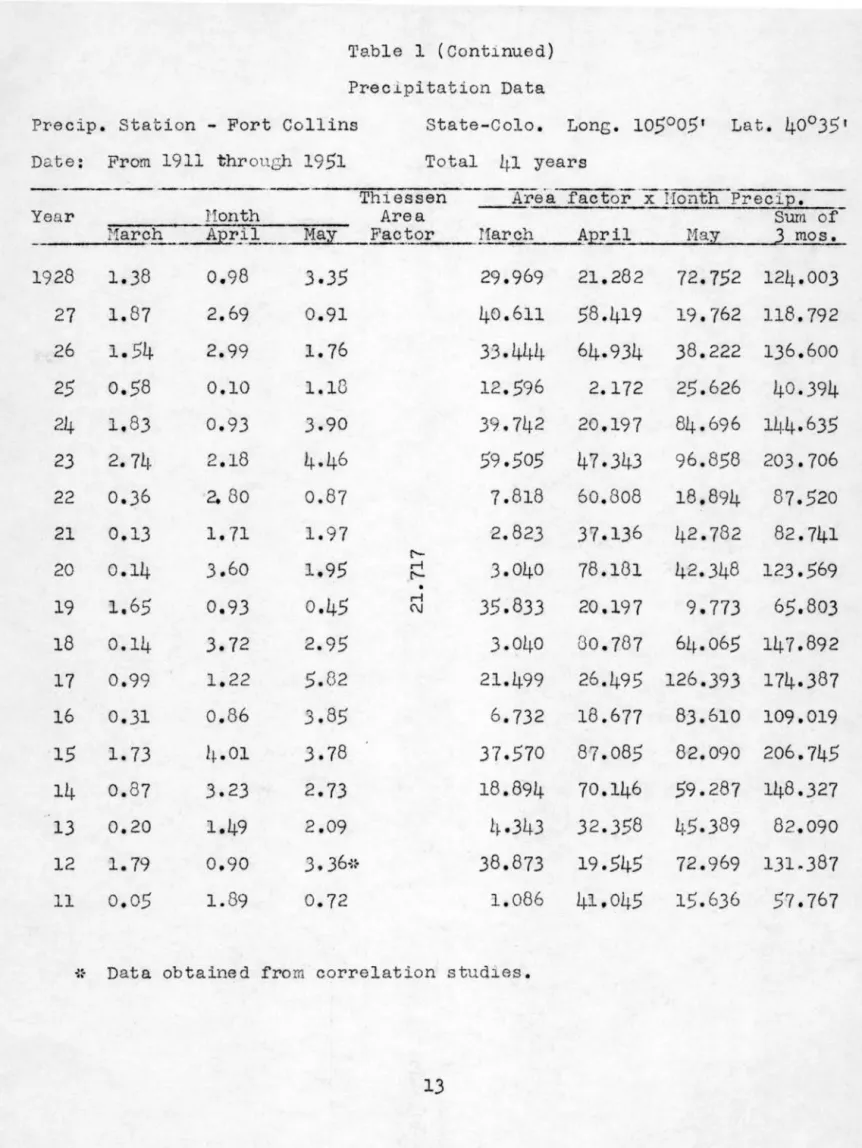
Table 1
Precipitation Data
Precip. Station - Fort Collins State-Colo. Long.
105°05'
Lat.40°35'
Date: F rom . , ..' . - · 1 ,· 1 ... . ... '-'-:1'1 u ~ , ·'·~·-l-·' ·1
1·'1'1
.. --;:.; Total41
yearsThiessen Area factor x :r-.fonth_
PrecJ.:~--Year Month Area Sum of
March April · May Factor March April May
3
mos.1951
0.35
1.39
2.59
7.601 30.187 56,247 94.035
50
0.36
2.00
3.91
7.818 43.434 84.913 136.165
49
1.96
1.53
2.94
42._565 33.227 63.848 139.640
48
0,68
0.67
2.16
14.768 14.550 46.909 76.227
47
0.95
1.41
3.62
20.631 30.621 78. 616
129.~6746 0,78
o.43
2.68
16.939
9.338 _58.202
84.479
45 0.42
3.02
1.88
9.121 65.585 40. 828 115.534
44 2.01
4.10
1.98
43.651 89.039 42.999 175.689
43
0.71
1.45
5.95
15.419 31.489 129.216 176.124
42
0.30
5.50
2.26
6.515 119.444 49.080 175.039
41 1.16
3.49
2,01
2.:).192 75.792 43. 651
14L~.635
1,83
["-1_5.636 30.187
85.565
40 0.72
1.39
('-r-139.742
•39
1,60
1.42
1.56
r-134.747 30.838 33. 079
99.464
(\j38
1.28
2.47
2.70
27.798 53.641 58.636 140.075
37 1.48
2.23
1,48
32.141 48.429 32.141 112.711
36
0.71
1.16
1,10
15.419 25.192 23. 889
64.500
35
0.21
1.24
6.71
4.561 26.929 145.721 177.211
34 0.71
1.41
1,92
15.419 30.621 41.697 87.737
.
33
0,60
1.91
4.56
13.030
41.~. 7999 .030 153.539
32 1.09
0.88
2.14
23.672 19.111 46.474 89.257
31 0.41
1,07
2.55
8.904 23.237
55.378
87.519
30
0.70
0,56
4.08
15,202 12.162 88.605 115.969
29
1. 78
2.37
1,08
38.656 51.469 23.454 113.579
12
Table 1 (Conti nued) Prec ip itation Data Precip . Station - Fort Collins
Da te : From
1911
thr ough1951
State - Colo. Long.
105°05'
Lat.40°35
1Total
41
years Yea r1928
27
26
25
24
23
2221
20
19
18
17
16
15
14
13
12
11 Harch1.38
1. 87
1.54
0.58
1, 83
2. 7L~0.36
0.13
0.14
1.65
0.14
0.99
0.31
l.73
0. 87
0.20
1.79
o.o5
Honth0.98
2.69
2.99
0.10
0.93
2.18
2.80
1.71
3.60
0.93
3.72
1.22
0.86
lj..01
3.23
1.49
0,90
1. 89
May0.91
1.76
1.18
3.90
4.46
0.87
1. 97
1,95
0.45
2.95
5. 82
3. 85
3.78
2.73
2.09
3.
36~!-0.72
Thiessen Area Factor r--r-1 r--.
r-1 (\j29.969
40.611
33.
4L~412.596
39.742
59 .505
7.818
2.823
3.040
35.833
3.040
21.499
6. 732
37.570
18.894
L~.343
38.873
1.086
~~ Data obtained fro m correlat ion studies .21.282
58.419
64.934
2.172
20,197
47 • .343
60. 808
37.136
72.752 124.003
19.762 118.792
38.222 136.600
25. 626
1+0.394
84 . 696 144.635
96 . 858 203.706
18,894 87.520
42.782 82.741
78.181 42.348 123.569
20.197
9.773 65.803
80.787 64.065 147.892
26.495 126.393 174-387
18.677
87 .085
70.146
32.358
19.545
41.045
83.610 109.019
82.090 206.745
59.287 148.327
~.5.38982.090
72.969 131-387
15. 636 57 .767
Table
2
Precipi t a t ion Data
r~e cl p . Stati on - Longmont
( 2)
St ate -Colo. Long .105°04'
Lat.40°10'
Dat e: From ~:. ·. ~1 .. 1 ~} . L. : ·;. ').._::~;
17:SJ.
Total ~ l YearsTl'n ess"en Area factor x Honth P~eciE•
Year Honth Area Sura of
l1arch _AE._rfl-~ 1ay Factor Harch April Ha]L __ _)_!11_o~
1951 0.62
1.15
2.00
4 .. 964
9.207 16.012 30.183
50
0~1 71.61
2.30
1.361 12.889 18.414 32.664
L~91.65
1.30
3.05
13.210 10.408 24.418 48.036
48
0.41
1.32
1.51
3.282 10.568 12.089 25.939
47
0.95
1.31
3,66
7.606 10.488
29. 302 47. 396
L~60,35
0.72
2. 08
2. 802
5.764 16. 652 25,218
L~50.25
2.36
3.90
2.002 18. 894 31.223 52.119
44 1.20
3.53
1,47
9.607 28. 261
11.769 1+9. 637
43
0.59
1.15
3.91
4.724
9.207 31,303 45.234
42
0.37
4,09
2,09
-..a2.962 32.
741~16.?33 52.439
0L1.1 0.78
3.54
1. 30
06.245 28.341 10 .408
44.994
• co40 1.33
1.36
2. 84
10.648 10.888
22.737 44 .273
39
1.07
1.27
1.06
8.566
10.168
8.486 27 .220
38
0.97
2.98
2.87
7.766 23.858 22, 977 54.601
37
o.6o
o. 8o
1.47
4. 804
6,405 11.769 22.978
36
0.74
0.76
1.58
5.924
6.085 12,
6~.924. 658
35
0.13
2.52
5.63
1.041 20.175 45. 074
q6 .• 2FfQ34
o.85
1.12
1,93
6. 805
8. 967 15.452 31o224
33
o.l-1-6
2.30
3.31
3. 683
18.414 26.499 48.596
32 0.65
1.0L~1,08
5 .204
8.326
8. 646
22.176
31
0.45
1,
OL~2. 27
3.
603
8.326
1 8 ~17430.103
30
0,41
0,90
3~063 . 285
7.205 24.498 34.988
29
1.79
1.58
1,40
14,331 12.650 11.208 38.189
14
Table 2 (C ontinued) Precipitation Data
?recip . Station - Longmont ( 2) Stat e-Colo. Long. 105°041 Lat. 40°10'
Date : From 1911 throu·gh. 1951 Total 41 Years
Thiessen Area factor
x
J'.<Ionth Precip-. _ _Year ~1onth Area SUl:l of
March April "1fay Factor Harch April --~-).mos.
1928 1.16 1.03 2. 75 9. 287 8. 246 22,017 39.550 27 1.17
2,05
1,36 9.367 16.L~l2 10.888 36 .667 26 1.13 2.062.85
9.047 16.492 22.817 48.35625
0.33 0.04 1.46 2.642 0.320 11 .689 lL~. 651 24 1.19 1.03 3.38 9.52? 8 .246 27.060 44 . 833 23 1.25 1.213.05
10.008 9.687 24.418 ~-4.113 22 0.43 1.66 0.16 3-443 13.290 1.281 18,014 21 0.24 ,3.78 2.12 ._!) 1.921 30.263 16.973 49.157 0 20 0.275.20
0.78 0 2.162 41.631 6.245 50.038 • co 19 0,38 l. 27 1.10 3.042 10.168 8.807 22.017 18 0.73 3.06 2.025.
8L~4 24.498 16.172 46.514 17 1.23 1.36 4 . 66 9.847 10.888 37.308 58.043 16 0.44 1.31 3,02 3.523 10.488 2L~.l78 38.189 15 1.16 4.20 2.97 9.287 33.625 23.778 66 .690 14 1.18 2.78 3.46 9 .447 22.257 27.701 59.405 13 0.46 1.50 1. 60~~ 3.683 12.009 12.809 28 .501 12 1.40 1.263.05
11.-208 10.089 24.418 LJ.5. 714 11 0 , 21 1.50 1,00 1.681 12.009 8 .oo6 21.696Table
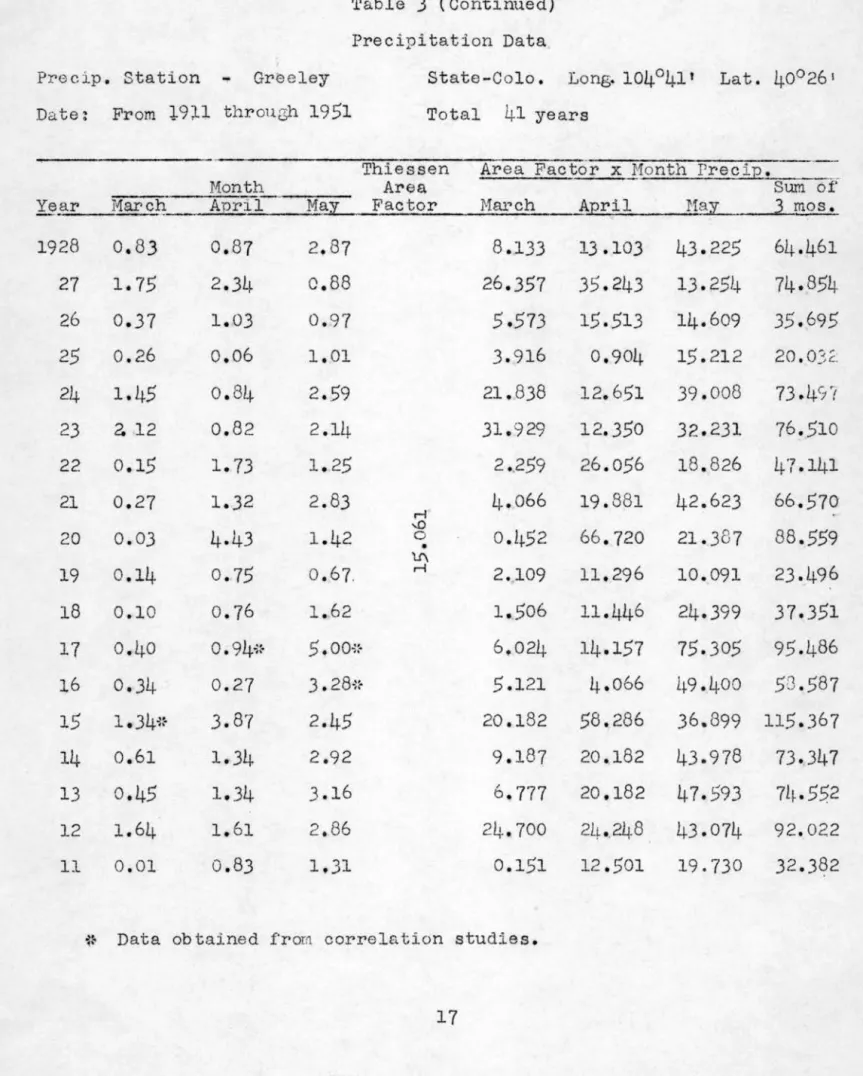
3
Prec ip itat ion Data
Prec ip . Station
-
Gre eley State-Colo. Long·.104°41
1 La t.40°26
Da te: from :t ·.·,.J. ·G~ ·. . 1'" · !
<h 1·:J51
....
Total L: l yearsThiessen Area Factor x Honth Prec i p.
Honth Area S"ll..i.ll of
Ye.BI' March Apr1l May Factor !1arch April May
3
mos.1951 D.42
,1.29
3.43
I6·.326 19.429 51.659 77·.414
50 0.25
1.89
2,32
3,765 28.465 34,942 67.172
49
1.39
1.01
2.97
20.934 15.212 44-731
8 0~87748 o. 81
0,38
1.13
12.199
5.723 17. 019
34. 941
47 0.79
1.32
2.78
11. 898
19. 880 41. 870
73.648
46
0.88
0.77
2.05
13,254 11.600 30.875 55.729
45 0.21
3.07
3.50 '
3.163 46.237 52.714
102,11LJ-44 1.56
4.32
1,66
23.495 65·. 064
25.001 113.560
43
0.45
1.56
4.45
6.778 23.495 67. 021 97.294
42
0.31
3.19
2. 92
4.669 48.044 43. 978 96.691
41
1.053.04
1.87
r-f15. 814 45.785 28.164 89.783
...0 040
1,00 .
1.22
1. 51
'V\ •15.061 10.374 22.742 56.177
r-l39
1.17
0.56
1.23
17.621
8.434 18,525 44-580
38
0.55
1.89
2.84
8.284 28.465 42.774 79.523
37
1.04
1.40
1.21
15.663 21.085 18.224 54. 972
36
0.59
0.85
2.92
8. 886 12. 802 43.978 65.666
35
o. 29
0.92
5.
79
4.368 13.856 87.203 105.427
34 0.49
0.96
1.35
7·.380 14.459 20,332 42.171
33
0.12
1,53
3.56
1.807
23.043 53.617 78.467
32 0.83
0.52
1.47
12 •. 501
7.832 22.140 42. 4
73
31
0.55
0.63
1.38
8.284
9.488 20.
78L~38.556
30 0,33
0.47
2.41
4-970
7.079 36.297 48.346
29
1.Lt-2
3.01
0.75
21.387 45.334 11.296 78.017
l9
Table
3
( Continued) Precipitation Dat aPrec i p . Station
...
Gre e ley St ate - Colo . Long.104°41
1 Lat .40°261
Date: From 1.9~1 throu. gh
1951
Total41
yearsThiessen Area Factcir x Month Prec i E•
Honth Area Sum of'
Year I'iar c~-·- Apri-l M~ Factor March Apr il Hay 3 ~
1928
0. 83
0. 87
2. 87
8. 133
13 .103 43 . 225
64 .461
27
1.75
2.34
0. 88
26 . 357 35 . 243
lJ .251-t
74 . 854
26
0. 37
1. 03
0. 97
5 .573 15.513 14. 609
35 . 695
250. 26
0. 06
1. 01
3. 916
0.904 15 . 212 20 . 03c:
21-t1. 45
0. 84
2.59
21 . 838
12. 61)1 39 . 008
73.4(/ f23
2.12
0. 82
2.14
31 .929
12. 350 32 . 231
76 . 510
22
0. 15
1. 73
1. 25
2 •. 259
26 . 056
18. 826
47 . 141
21
0. 27
1.32
2. 83
r-14. 066 19 . 881
42 . 623
66 . 570
-..!)20 0. 03
4 -43
1. 42
00
. 1~5266 .720
21 . 387 88 .559
• "V\19 0.14
0. 75
0. 67.
r-12. 109
11 . 296
10. 091
23 . 496
18 0.10
0.76
1. 62
1. 506 11 . 446
24. 399
3 7. 351
17
0. 40
o.
94-:~ 5 .00-l:·
6,024 14. 157 75. 305 95 .486
16
o.
3L~0. 27
3 . 28·::·
5 .121
4 . 066
1~9 .400
5:3 .587
15
1 . 34~:-3. 87
2. 45
20 . 182 58 . 286
36.899 115. 367
14 0. 61
1. 34
2.92
9 . 187
20 . 182 43.978 73 . 347
13
0. 45
1. 34
3. 16
6. 777
20 . 182 4 7. 593
71~ . 55212 1.64
1. 61
2.86
24 . 700
24 •. 248
43 . 074 92. 022
11
0. 01
0.83
1, 31
0. 151 12 .501 19.730
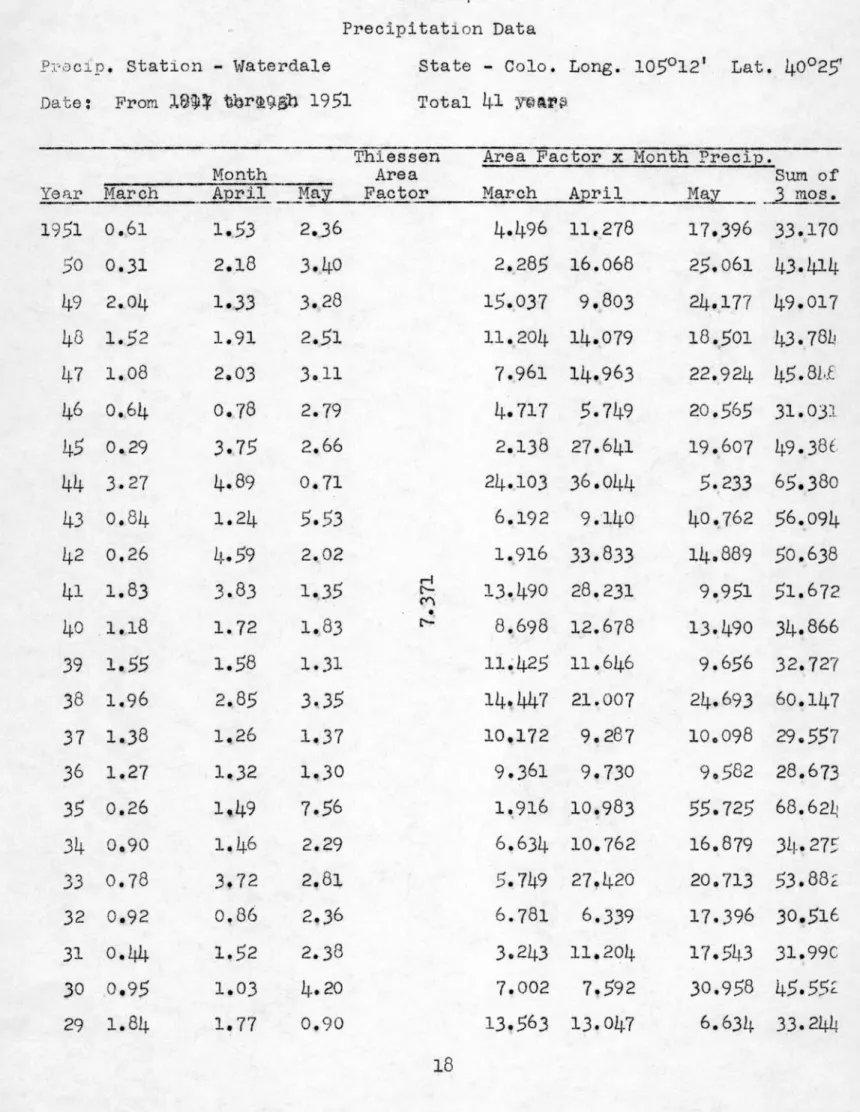
32 . 3~2Table LJ.
Precipitati on Data
Pra cip . Station - Waterdale State - Colo. Long.
105°12
1 Lat.40°25'
Date : From ~e~~ tbr~~Sh
1951
Total41
Y~Afl~Thiessen Area Factor x Month PreciE·
Month Area Sum of
Year March A:eril Ma:,y Factor March Ap~i~ I1~
__ _ 3
mos.1951 0.61
1.53
2.J6
4.496 11.278
17.396 33.170
500.31
2.18
3.
L~O2.285 16.068
25.061 43.414
1+9 2.04
1.,33
3.28
15.037 9,803
24,177 49.017
48 1.52
1.91
2.51
:1,1.
20LJ.14.079
18 •. 501 43. 781-!
47 1.08
2.03
3.11
7.961 14 .. 963
22.924 45.
8L.E
46 0.64
0.78
2.79
4.717
5.
749
20,565 31.031
1+5
0.29
,3.75
2.66
2.138 27.641
19.607 49. 38E,
44 3.27
4.89
0.71
24.103 36.044
5.
233 65.380
43 0. 84
1.24
5.53
6.192 9.140
40 •. 762 56.094
42 0,26
L}.59
2.02
1.,916 33.833
14.889 50,.638
41 1.83
3.83
1.35
r-1 ['-13.490 28.23.1
9.951 51.672
('f) •40 1.18
1.72
1.83
['-8.698 12.678
13.490 34.866
39 1.55
l.58
1.31
11~42511.646
9.656 32.727
38 1.96
2.85
3-35
14.447 21.007
24.693 60.147
37 1.38
1.26
1.37
10,172 9. 287
10.098 29e557
36 1.27
1.32
1.30
9.36l 9.730
9o582 28.673
35
0.26
1,49
7.56
1 •. 916 10.983
55.725
68.62~34 0.90
1.46
2.29
6.634 10.762
16.879
3L~.275
33
0.78
3.72
2.81
5.749 27,420
20.713 53.88c:
32
0.92
0.86
2.,36
6.781 6.339
17.396 30.516
31 0.44
1,52
2.38
3.243 11.204
17.543 31,.99C
30 .0.95
1.03
4· 20
7.002 7.592
30.958
45.55L
29 1.84
1.77
0.90
13.563 13. 04.7
6.634 33.244
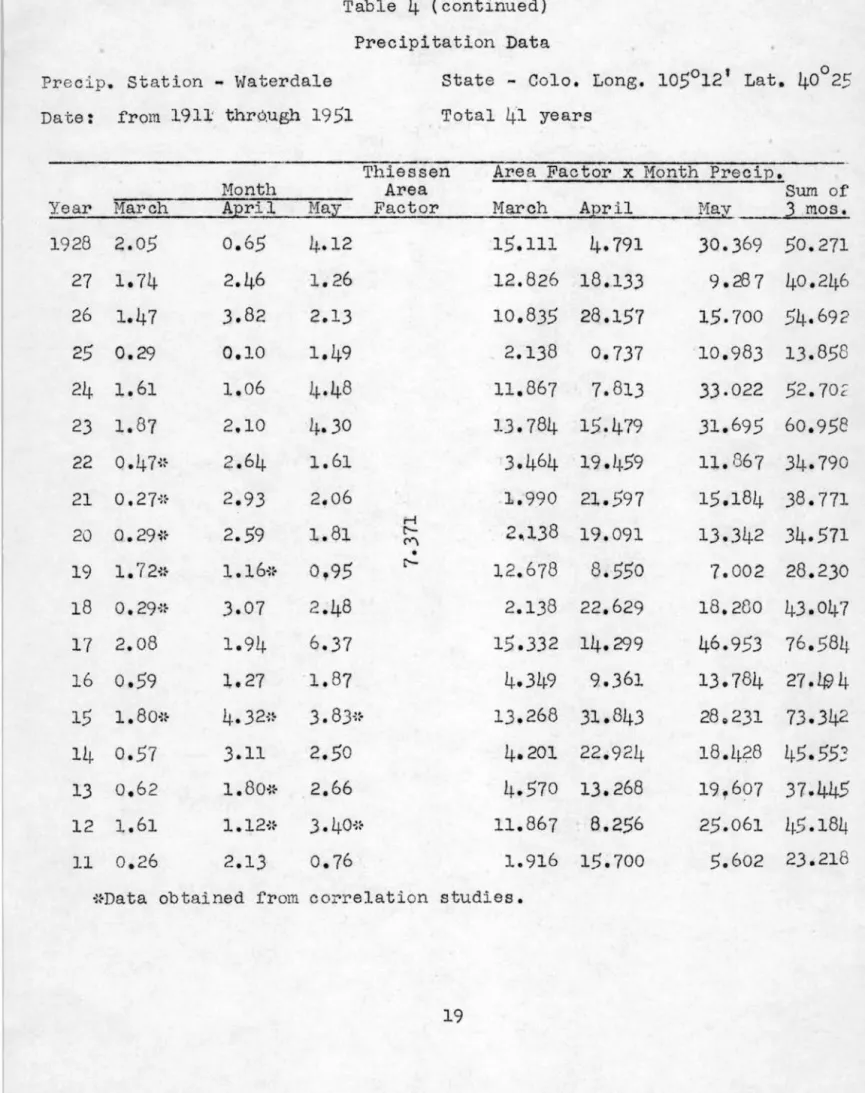
18
Table
4
(continued ) Precipitation DataPre cip. Station ~ Waterdale State - Colo. Long.
105°12'
Lat.40°25
Date: from
191],:
thro.ugh1951
Total4"1
yearsThiessen Ar.ea Factor x Month Precip,
Month Area Sum of
Year March April ~1a;y: Factor March A.12ril Hay
.2
mos.1928
2.05
0,65
4.12
15.111 4.791
30.369 50.271
27 1.
7L~2.46
1. 26
12.826 18.13,3
9.287 40.246
26 1.47
,3.82
2.13
10,835 28.15?
15.700 54.692
25
0.29
0,10
1.49
2.138 0.737
10.983 13.858
24 1.61
1.06
4.48
11.867 7.813
33.022 52.702
23 1.87
2,10
4.30
13.784
15~47931.695 60.958
22 0.4
7~:-2.64
1.61
3.464 19 .1-J-59
11. 867 34.790
21 0. 27-l:·
2.93
2.06
1.990 2],. 597
15.184 38.771
r-l2 •. 138
20 0.
29~:-2.59
1.8l
r--rr\19.091
13.342 34.571
•19
l. 72~~],
.16-l~o,95
['-],2. 678
8.550
7.002 28.230
18 0.
29.;~3.07
2.48
2.138 22,629
18,280 43 .. 047
17 2.08
1.94
6.37
15.332 14.299
46.953 76.584
16 o.59
].,27
1.87
4 .3L~99.361
13.784 27.
if)4
15 1.
8o.;~ ~.•
32~:.3.
8J.;~13.268 31.843
28
Q231 73.342
14 0. 57
3.11
2.50
4.201 22.924
18.1.~?845.553
13 0, 62
1.
80~~2,66
4-570 13.268
19.607
' .37-445
12 1.61
1.12-i~3.
40·:~11.867 8.256
25.061
L~5.184
11 0,26
2.13
0.76
1.916 15.700
5.602 23.218
Table
5
Precipitation Data
Pre cip . Station - Estes Park State-Colo. Long.
105°31
1Lat.
40°23
1Date: From
1911·
t.'J,r()UgO1951
Total4l:
yearsThiessen Area Factor x Morith Precip.
Month Area Sum of
Year March !\pr,il May ·- Factor Marcg __ April Max .,..). mos.
1951 0.45
0.94
2. 15
7 .. 439 15.539 35.542
58.520
50
0.28
1.58
2.19
4. 629 26.119 36.203 66.951
49 3
.10~:-1.54
2.64
51.246 25.458 43.642 120.346
48 1.52
1.08
1 .12
25.127 17.853 18.514 61.494
47 1 .18
2.07
3.49
19.507 34.219 57.693 111.419
46 1.46
1.59
4-32
24.135 26.284 71.414 121.833
45 0.75
4-35
2.10
12.398 71.910 34.715 119.023
44 2.20
4.90
1.70
36.368 81.002 28.103 145.473
43 1.30
1.80
2.80
21.490 . 29.756 46.287 97.533
42 0.76
5.43
1.42
12.564 . 89.763 23.474 125.801
41 2.03
2.91
0.68
r-l33.558
48.105 11.241 92.904·
C'\ '1..1\40 1.99
1.25
2.20
-.!) •32.897 2Q.664 36.368 89.929 .
r-139 0.87
0. 89
1. 85
. 14.382 14.713 30.582 59.677
38 1.80
2.28
2.43
29.756 37.691 40.170 107.617
37 1.01
2.74
1.65
16.696 45.295 27.276 89.267
36 1.28
1.16
0. 74
21.160 19.176 12.233 52.569
35
T2.62
4.49
0
43.311 74.224 117.515
34 0.41
1.57
2. 11
6.778 25.954 34.880 67.612
33 0.1.5
3.30
0. 87
2.479 54-552 14.382 71.413
32 1.22
1.31
0.72
20.168 21. 656 11.902 53.726
31 0.69
2.00
2.5011.406 33.062 41.328 8.5.796
30 0.90
0.08
0.26
14.878
1~3224· 298
20.498
29 0,83
0.
,32~:-1.95-l:-
13.721
5.
290 32.235 .51.246
20
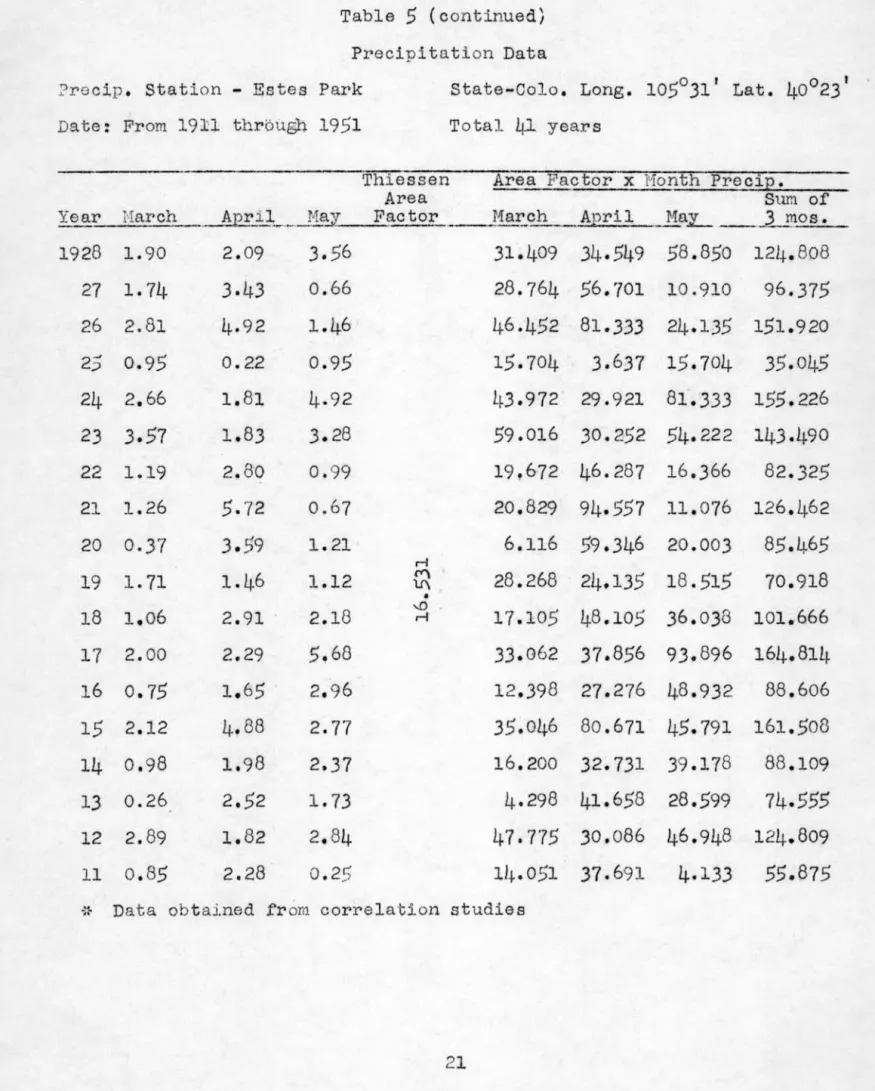
Table
5
(continued/ Precipitation Data::?recip. Station - Estes Park State-Colo, Long.
105°31
1Lat.
40°23
1 Date: From19£1
through1951
Total41
yearsThi essen Area Factor x Month P~eciE•
Area Sum of
Year Har•ch __ _AEE_i ~~---ME0.'. Factor ·- -·---March Apri]. _MaL_ _ _ .)_1'!!-0S.
1928 1.90
2.09
3.56
31.409 34.549 58.850 124.808
27 1.74
3-43
0.66
28.764 56.701 10.910 96.375
26 2.8].
4.92
1.46
46.452 81.333 24.135 151.920
25
0.95
o.
22
0.95
15.704 3.637 15.704 35.045
24 2.66
1.81
4.92
L~3.972 29.921 81.333 155.226
23
3.57
1.83
3.28
59.016
30.252
54.222 143 .l+90
22 1.19
2. 80
0. 99
19,672 46.287 16.366 82.325
21 1.26
5.
72
0.67
20.829 94.557 11.076 126.462
20 0.37
3. 59
1.21
6.116 59.346 20.003 85.465
rl19 1.71
1.46
1.12
~ •28.268 24.135 18.515 70.918
18 1.06
2.18
-..!)17.105 48.105 36.038 101.666
2.91
rl17 2.00
2.29
5,68
33.062 37.856 93.896 164.
81L~16
0.75
1.65
2. 96
12.398 27.276 48.932 88.606
15 2.12
4,88
2.77
35.046 80 .671 45.791 161.508
14 0.98
1.98
2. 37
16.200 32.731 39.178 88.109
13 0.26
2.52
1 .73
4.298 41.658 28.599
74.555
12 2.89
1.82
2. 84
47.775 30.086 46.948 124.809
11 0. 85
2.28
0.25
J.4. 051 37.691
4-133
55.875
Table 6
Prec1pitation Data
Pre c ip . Station
-
Longs Peak State-Colo. Long.105°34'
Lat.40°17
Da te: From 19J,l through
1951
Total4-;t
YearsThiess-en _ . Area_-factor x rfol_].th- P.!_e cJ.p.
Yoar Honth Area Sum of
!i_ar ch- _...AE_r i
1
Nay Factor-- ---·
Harch April--
}1~y3
mos.1951
o
.
5o~l...
1.26-:;.
2 .60-ll-
3.130
7.886 16.27.3' 27.289
50 0.30-ll-
2.
oo-:~2. 67·::-
1.878 12.518 16.712 31.108
4.9
4.
20~~1. 95·:;.
3.15-ll-
26.288 12. 205 19.716 58.209
48
1.51
1.31
1.18
9,451
8.199
7.386 25.036
47
2.
56-:~2. 62-ll-
4.
oo~z._16.023 16.399 25.036 57-458
46
1.
95~:·2.
00~:-4
. 92~~12.205 12.518 30. 794 55.517
45 1.00-lZ.
5.35-:z.
2.55·::-
6. 259
33-486 15 .960
55.705
44 3.07
4-93
2.66
19.215 30.857 16.649 65.721
43
1.98
1.84
3.91
12.393 11 .517
24 .473 48.383
42
1.34
8.17
1.56
8.387
51.136
9o764
69.287
41
2.45
4.11
2,04
15.335 25.724 12.768 53,827
40
2.63
1.70
3.22
'LI'\ 0'16.461 10.640 20.154 47.255
<\I •39
1.75
1.42
2.28
...010.953
8.888 .14. 271
3t~.112
38
3-55
3.26
3.58
22.219
20.404. 22.407 65 .030
37
1.3L~3.25
2.27
8.387 20.342 14.208 42.937
36
1.63
1.82
1.64
10.202 11.391 10.265 31.858
35 0.75
4.20
L~ .29
4. 694
26.288
26.851 57.833
34 1.04
2.38
2.09
. 6.509 14.896 13.081 34-486
330.97
5 .91
3.46
6.071 36.991 21,656 61+. 718
32
2.09
1.85
0. 8£3
13.081 11.579
5.508 30.168
31
3.20
2.50
3.50
20.029
15.648 21.907 57.584
30 0.73
0.28
1.45
4.569
1.753
9.076 15.398
29
2.H3
0.46
2.41
13.645
2.879 15.084 31.608
22
Table
6
(ContinuAd ) Prec ipit ati on Datafrecip . Station
-
Longs Peak St ate- C olo~ Long.105°34'
Lat .40°17!
Da.te : From1911
thr oi,lgh1951
Total41
Year s-- -
Thiessen Area fact or x Mon t h Precip.Year No nth Area Sum of
March April r-r~y Factor Harch April Hay _)_~.
1928
2,02
2. 20
5.15
12 . 643
13.770 32,234 58 .647
27
1.16
2.65
1.1 2
7.260 16.586
7.010 30 .856
26
2 .59
2.49
1.73
16.211 15e585 10. 828 42.621;
25.
0.39
T1.83
2.441
0. 000
11. 454 13.895'
24
5.25
2.12
6. 09
32.860 13.269 38. 117 84.
2L!-[
23
4.84
2.06
3.32
30.294 12,69 4 20e780 63. 96f
22
1.59
2
. 8L~1.,80
9.952 17.776 11.767 39.49.:
21
2.18
6.99
1.
07~~13.645 43.750
6. 697
64 .09 ~20
0.52
7. 85
T3. 255
L~9.133
o.ooo
52 .38t
19
2. 46
2.63
1. 53·;<-
'U"\ 0"15.397 16,461
9.576
41 .43~ N18
0.74
2. 65
0.93
--o •4.632 16.586
5. 821 27
.oy;
17
2. 60
1. 84
3.29
16. 273
11 . 517
20.592
48 .3 8~16
2.49
3.40
2.84
15.585
21.281 17. 776
54.64~15 4.06
4.78
2~97 25 .L~l229.'918 18 . 589
73.91S
14 1.45
3.85
0.90
9.076 24.097
5 .633
38
. Bot13
0.72
3
.1.5-l~o.8o
4.506 19.716
5.007
29.
22~12 3. 35
3.04
4.40
20 .968 19.027
27.540
67 .53:
111. 20
3.18
0.73
7.511 19.904
4. 569 31.'981
Table 7
Precipi t ation Data
Precip . Station
-
Fort Lupton State-Gulo . L0ng •. 10h043; Lat . 40°U5 ·Dete: From 19 :Ll. thrqugt 1951 •rotal 41 Years
Thiessen _ t..rea facto~ x Honth Precip .
Year Honth Area Sum of
March April Hay- Factor --·-- _11~rch Anri1 ~~_gx .3__mos.L
1951
0.52
1.20 0. 97 1.591 3.672 2.968 8.23150
0.31 2.31 2. 00 ~:- 0.949 7 .. 069 6.120 14.138 49 1.92 1., 81 7. L~65.875
5-539
22 . 828 3L~. 2L~2 48 0. 67 1.65 0.922.050
5.049 2. 815 9 . 9 1L~ 4-7 0.24 1.28 3 . 00 o. 734 3.917 9.180 13 ~ 8 31 ! ~6 0. 40 1. 27 4 -73 1.224 3.886 14·474 19.584 45 0.11 2.86 1.64 0.337 8.752 5 . 018 14.107 44 1.44 3.81 1. 80 4 -406 11 . 6595.508
21 .573 43 0.68 1.76 3-45 2.081 5 . 38610 .557
18.024 42 0,19 3 . 91 1.34 0.581 11.965 4.100 16.646 410.53
2.90 3.08 0 1. 622 8.874 9.425 19.921 'D 0 40 1.72 1.14 2.01 0'1 • 5 . 263 3.488 6.151 14.902 390.50
1.27 1. 251.530
3. 8863.825
9.241 38 0. 51 2.33 4 .17 1. 561 7.130 12.760 21,45137 o.5l
0 ,66 1. 61 1.561 2.020 4 .9278.508
36 0. 69 0.56 1.78 2.111 1 .. 714. 5.1+4
7 9.27235
0. 22 2.32 7.13 0. 673 7.099 21. 818 29 .590 340.58
0.70 2.11 1.775 2.142 6.457 10.374 33 0.33 2. 96 2.71 1.010 9.058 8. 293 18. 361 32 0,36 0.95 1 .15 1.102 2.907 3.519 7.528 310.50
1.62 1.91 1.530 4-9575.845
12 .• 332 300,25
1.10 2.32 0.765 3.366 7.099 11.23C 29 0. 99 o.o6 2.15 3.029 0.184 6.579 9.792 24Table
7
( Continued ) Precipitat1on DataPreci p . Station
..
Fort Lup ton State -Colo. Long .104°43'
Lat.40°05 '
Da te; From
1911
through1951
Total41
YearsThi essen Are e. fac~orx Tfo nth Prec1p ; __
-Year Mon th Area · Sum of
March Apr:Cr- N a~r ___ Factor Harch p April r1_ay )._In~
I '