¨
Orebro University, School of Science and Technology
¨
Orebro Studies in Technology 73
Only a Shadow
Industrial Computed Tomography Investigation, and Method Development, Concerning Complex Material Systems
Anton Jansson
Mechanical Engineering School of Science and Technology ¨
c
Anton Jansson Title: Only a Shadow Publisher: ¨Orebro University www.publications.oru.se ISSN 1650-8580
ISBN 978-91-87789-10-6 Printed by Repro 2016
It usually ends in laughter and a delight in the futility of trying to understand what this atom in the universe is, this thing - atoms with curiosity - that looks at itself and wonders why it wonders.
Abstract
The complexity of components fabricated in today’s industry is ever in-creasing. This increase is partly due to market pressure but it is also a result from progress in fabrication technologies that opens up new possi-bilities. The increased use of additive manufacturing and multi-material systems, especially, has driven the complexity of parts to new heights.
The new complex material systems brings benefits in many areas such as; mechanical properties, weight optimisation, and sustainability. How-ever, the increased complexity also makes material integrity investigations and dimensional control more difficult. In additive manufacturing, for ex-ample, internal features can be fabricated which cannot be seen or measured with conventional tools. There is thus a need for non-destructive inspec-tion methods that can measure these geometries. Such a method is X-ray computed tomography. Computed tomography utilizes the X-rays ability to penetrate material to create 3D digital volumes of components. Mea-surements and material investigations can be performed in these volumes without any damage to the investigated component. However, computed tomography in material science is still not a fully mature method and there are many uncertainties associated with the investigation technique.
In the work presented in this thesis geometries fabricated by various additive manufacturing processes have been investigated using computed tomography. Also in this work, a dual-energy computed tomography tool has been developed with the aim to increase the measurement consistency of computed tomography when investigating complex geometries and material combinations.
Sammanfattning
Komplexiteten hos de komponenter som tillverkas i dagens industri ¨okar st¨andigt. Detta sker delvis p˚a grund av p˚atryckningar fr˚an marknaden men ¨
ar ocks˚a ett resultat av frammsteg inom nya tillverkningsmetoder som ¨ opp-nar upp f¨or nya designm¨ojligheter. Den ¨okade anv¨andningen av additiv tillverkning och multi-materialsystem, har i synnerhet drivit komplexiteten hos komponenter till nya h¨ojder.
De nya komplexa materialsystemen ger m˚anga f¨ordelar, till exempel inom omr˚aden som; mekaniska egenskaper, viktoptimering, och h˚allbarhet. Den ¨okade komplexiteten leder dock till att materialutredningar och dimen-sionskontroller blir sv˚arare. I additiv tillverkning kan exempelvis inre struk-turer tillverkas som inte g˚ar att se eller m¨ata med konventionella verktyg. Det finns s˚aledes ett behov av icke-f¨orst¨orande inspektionsmetoder som kan m¨ata dessa geometrier. En s˚adan metod ¨ar r¨ontgentomografi, ocks˚a kallad datortomografi. Datortomografi anv¨ander r¨ontgenstr˚alningens f¨orm˚aga att tr¨anga igenom material f¨or att skapa digitala 3D volymer av komponenter. I dessa volymer kan m¨atningar och materialunders¨okningar utf¨oras utan att n˚agon skada tillkommer den komponent som unders¨oks. Datortomografi i materialvetenskapssammanhang ¨ar dock fortfarande inte en helt mogen metod och det finns fortfarande m˚anga os¨akerheter hos tekniken.
I denna avhandling har geometrier tillverkats med olika additiva tillverkn-ingsprocesser och unders¨okts med datortomografi. I detta arbete har ¨aven ett dubbel-energi verktyg utvecklats i syfte att ¨oka m¨atningsnoggrannheten hos datortomografi vid inspektion av komplexa geometrier och materi-alkombinationer.
Acknowledgements
I would like to thank my supervisors Prof. Lars Pejryd and Dr. Jens Ekengren for their guidance and encouragement during my studies. I would specially like to thank Lars for allowing me to develop and pursue my own ideas.
I would like to thank my office mate Amir Reza for good company and the lesson that nothing is perfect.
I would also like to thank my colleagues at the engineering department at ¨
Orebro University, friends and family. Finally my deepest gratitude goes to Sofia.
Contents
1 Introduction 1
1.1 Motivation . . . 1
1.1.1 Scientific and Industrial questions . . . 3
1.2 Methodology . . . 3
1.3 Contributions . . . 4
1.4 Publications . . . 4
1.5 Thesis structure . . . 5
2 Complex material systems 7 2.1 Additive manufacturing . . . 8
2.1.1 Selective Laser Melting . . . 11
2.1.2 Selective Laser Sintering . . . 13
2.1.3 Additive Manufacturing geometries . . . 15
2.2 Multi-material systems . . . 17
3 Computed tomography 19 3.1 General principles . . . 20
3.1.1 X-ray sources . . . 24
3.1.2 Stage and Detector . . . 26
3.1.3 Reconstruction and Analysis . . . 27
3.1.4 Phase Contrast . . . 29
3.1.5 Diffraction Contrast . . . 29
3.1.6 Limitations . . . 29
3.2 Dual-energy computed tomography . . . 33
3.2.1 Dual-energy tool . . . 34 xi
xii Contents
4 Material integrity 39
4.1 Computed tomography results . . . 39 4.2 Fibre orientation results . . . 41 4.3 Mechanical results and discussion . . . 42
5 Dimensional accuracy 45
5.1 SLM and SLS accuracy . . . 45 5.2 Dual-energy and measurement consistency . . . 50
6 Summary 55
6.1 Future work . . . 56 57 Bibliography
CHAPTER
1
Introduction
In this section the underlying motivation for the work that comprises this thesis is presented. The industrial and scientific questions that this thesis aims to answer are given. The motivation is followed by a short description of the methodology that was used to answer the questions. The methodology is followed by a contribution section where the main contributions of this work are briefly presented as bullet points. Thereafter a short section about the thesis structure is presented and finally the publications that this thesis is based on are presented.
1.1
Motivation
Today’s industry is experiencing an increased demand of products that are lighter, stronger, and more durable than ever before. Some of these require-ments originates from the increased awareness of environmental issues. The transport sector produces a large contribution to greenhouse gas emissions and regulations to decrease the emissions are frequent. The emissions can be reduced by increasing the efficiency (or replacing) of the engines that are being used, which can be difficult. Or, the product being transported can be made lighter. There is also an issue regarding the competition from low-wage countries that can produce products at a higher pace with a lower price. To be able to compete there is a need to produce products that have superior quality, and function, when it comes to e.g. strength and weight.
2 Introduction One possible way to produce lighter products is to combine several dif-ferent materials. By using material combinations it is possible to exploit the strengths of a material while diminishing its weaknesses. A classic example of such a multi-material is the combination of carbon fibre and plastic, where the plastic is used as a matrix to guide the superior mechan-ical properties of the carbon fibre. Other common combinations are, for example, a metal with plastic, where the metal is used as an conductor and the plastic as an isolator.
The properties of a component can also be improved by optimisation of the geometry. Classical, subtractive, manufacturing processes are to some extent limited in their ability to shape optimal geometries. Only straight holes can be drilled and surfaces that cannot be reached by a tool can not be machined. However, new techniques, like additive manufacturing (AM), have recently opened up the possibility to manufacture parts with highly complex geometries. In AM a part built layer by layer, enabling the creation of, for example, intricate lattice structures and internal geometries. An example of an AM part can be seen in figure 1.1.
Complex material system can be complicated to fabricate and to make sure that the fabrication was succesful the parts needs to be investigated. The inspection of parts is generally done for two reasons; to check the material integrity and/or part dimensions. The inspection of parts in a non-destructive fashion can be done using several different methods, each one with its own benefits and drawbacks. X-ray computed tomography (CT) is the only non-destructive method today that is capable of measuring internal geometries. CT has been used in medicine since the 1970’s but it has only been used in metrology applications for the past ten years [1]. CT opens up investigation possibilities that are necessary for further development and
Figure 1.1. Classical vs Additive Manufacturing design for a bracket a) Classical design producible by, for example milling b) Additive Manufacturing design with weight optimisation.
1.2 Methodology 3
use of complex material systems, however, there are still issues regarding the CT method that must be resolved. The following section will highlight the specific questions that this thesis has aimed to answer.
1.1.1
Scientific and Industrial questions
The work presented in this thesis was aimed to answer the questions below. The questions are divided into industrial, and scientific interests.
Industrial questions
How can industrial computed tomography be utilized to gain knowledge about new, complex, material systems?
How can the measurement consistency in industrial computed tomogra-phy investigations of complex geometries, and material combinations be improved?
Scientific questions
How can absorption computed tomography be used as a tool for material integrity investigations of complex material systems?
How can the computed tomography method be improved concerning the data quality of complex geometries and material combinations? Espe-cially in the case of objects that contain large differences in density and thickness.
1.2
Methodology
The main part of the work presented in this thesis concerns the use of CT to investigate and/or measure complex material systems. The equipment used for all of the CT work was a Nikon XT H 225 system. This is a mid range CT system that can be used for characterisation and inspect of medium sized components. The data that was acquired from the CT system was analysed in the commercially available software VGstudioMAX 2.22 [2], where porosity calculations and dimensional measurements can be performed. For some of the work presented in the thesis the data from the CT system was processed by an in-house developed enhancement tool to improve certain aspects of the data before it was analysed.
4 Introduction
1.3
Contributions
The main contributions from the work presented in this thesis relates to the fields of material science and metrology. The contributions are listed below:
• Increased knowledge concerning the material integrity of composite materials fabricated by Selective Laser Sintering (SLS).
• Insights into the fabrication process of composite materials fabricated by SLS.
• Insights into the accuracy and possibilities provided by the Selective Laser Melting (SLM) technique.
• The development of a new phantom for multi-material and high aspect-ratio CT measurements.
• The development of a dual-energy tool for the improvement of the measurement consistency of computed tomography concerning com-plex material systems.
1.4
Publications
The work presented in this thesis have been previously presented in two journals and two conferences. The following list contains the included pa-pers and where they have their main contributions in the thesis.
• Paper I
Anton Jansson, Lars Pejryd, Characterisation of carbon fibre-reinforced polyamide manufactured by selective laser sinter-ing, Additive Manufactursinter-ing, 9, 7-13 (2016).
Found in chapter 2 and 4. • Paper II
Anton Jansson, Amir Reza Zekavat, Lars Pejryd, Measurement of Internal Features in Additive Manufactured Components by the use of Computed Tomography, Digital Industrial Radiology and Computed Tomography (DIR), Online proceedings, 9p. (2015) Found in chapter 2 and 5.
1.5 Thesis structure 5 • Paper III
Anton Jansson, Jens Ekengren, Amir Reza Zekavat, Lars Pejryd, Ef-fects of X-ray Penetration Depth on Multi Material Com-puted Tomography Measurements, Industrial ComCom-puted Tomog-raphy (iCT), Online proceedings, 8 p. (2016).
Found in chapter 2 and 5. • Paper IV
Anton Jansson, Lars Pejryd A Dual-Energy approach for im-provement of the measurement consistency in Computed Tomography, Measurement Science and Technology, 27, 11, 9pp (2016).
Found in chapter 2 and 5.
The authors contribution to each paper is indicated by the position of the author in the author line.
1.5
Thesis structure
Chapter 2 describes the term complex material systems and how it is used in the thesis. The chapter describes the fabrication processes that have been used in paper I and II. Finally the chapter discusses multi-material com-ponents and presents the cases that have been studied in paper III and IV. Chapter 3 provides a background to CT and some of the different meth-ods that are used today. It also presents the dual-energy method that is used in paper III, and that is described in paper IV.
Chapter 4 presents material integrity results obtained from CT investiga-tions of the carbon fibre reinforced material described in chapter 2. These results originate from paper I.
Chapter 5 starts with a discussion concerning the accuracy of the AM method described in section 2.1.1. The chapter continues with an im-plementation of the dual-energy method described in section 3.2 on the multi-material phantom presented in section 2.2. These results originate from paper III, and IV.
Chapter 6 gives a short summary of thesis followed by an outlook for future work in the area.
Finally the papers that comprise the work that has been done in this thesis can be found at the end of the thesis.
CHAPTER
2
Complex material systems
This chapter starts with a brief definition, history, and summary of AM, followed by a section that describes the AM methods that were employed in this thesis. The final section describes multi-material combinations that were considered in this thesis work.
Complex material systems is a broad term and in the context of this thesis it refers to material systems that contains either of two properties; complex geometries and/or multi-materials. Geometries can be considered complex due to, for example, a high amount of features and/or double curved sur-faces. A complex geometry can also contain internal features, such features were previously difficult to manufacture but can now be produced more easily using AM. Complexity can also be due to difficulties in acquiring accurate dimensional measurements. In this thesis the last two cases of complexity will be considered. Multi-material systems refers to material systems that contains two or more materials. For such applications mate-rials combinations including plastics, ceramics and metals are common. In other applications materials are combined to utilize their mechanical prop-erties more efficiently. A common example today is the combination of plastic and carbon fibres in a composite to create lightweight components with a high stiffness to weight ratio. Multi-material systems can be diffi-cult both to manufacture and perform non-destructive testing on. In this thesis work material combinations that are common within the industry have been studied.
8 Complex material systems
2.1
Additive manufacturing
AM is an evolution from rapid prototyping that has been around since the 1980’s (actually AM has been around for much longer) [3, 4]. In AM, a 3D design is sliced into thin digital layers that contain the geometric information about that specific section of the component. These layers, also known as slices, are then processed to create the scanning/travel path of an AM machine. The fabrication process in AM vary, but the core principle is to add small portions of material, layer by layer, to create a component. A schematic of the work-flow in a AM process can be seen in figure 2.1. AM techniques have significant advantages versus classical manufacturing methods when it comes to design possibilities. Designers creating parts with AM are no longer constricted by what can be milled, lathed or moulded but can build whatever geometry that suits their needs, without compromising.
There are many materials available for AM, such as a variety of plastics with and without reinforcement fillers as well as a selection of metallic alloys. However, the selection of materials suitable for AM is still somewhat limited. Common plastic materials that are available for AM today can be seen in table 2.1.
Table 2.1. Common plastic materials available for various AM processes today [5, 6, 7]
Material Main properties
Polyamide 12 (PA12) Multi-purpose plastic, Bio-compatible, Good chemical resistance
Glass bead filled PA12 High stiffness, Wear resistant Aluminium filled PA12 Thermally conductive Carbon-fibre reinforced PA12 High strength to weight ratio Polyamide 11 Ductile, Renewable
Polyaryletherketone Wear resistant, High stiffness Acrylonitrile butadiene styrene Ductile, Relatively heat resistant Polylactic acid Ductile, Renewable
Cyanate Ester 220 High stiffness, High heat resistance
It should be noted that there is also a large variety of material combi-nations that include polyamide and polylactic acids but these are mostly for prototyping purposes. It might seem that there is a large selection of materials to pick from when it comes to plastic AM but to put the selec-tion into context it can be said that for injecselec-tion molding there are tens of thousands of different plastic materials to choose from [6].
2.1 Additive manufacturing 9
Figure 2.1. General work-flow of Additive Manufacturing. A 3D design is created by a designer. The design is sliced into digital layers, ”slices”, that contain the geometrical information about that specific layer of the design. The slices are stacked together and are now ready to be 3D printed. Depending on the printing process and finish requirements the product is complete after the print or needs to be processed further with, for example, surface treatments or hot isostatic pressing.
10 Complex material systems
On the metal side of AM there are less materials to choose from than for plastics. Some of the common metal alloys used in AM today can be seen in table 2.2.
Table 2.2. Common metal alloys available for various AM processes today [8, 7]
Material Main properties
Maraging steel High strength, stiffness and hardness Stainless steel Ductile, High strength
Nickel alloys Heat resistant, Corrosion resistant
Cobalt chrome Bio-compatible, High strength, Heat resistant Titanium High strength to weight ratio, Bio-compatible Aluminium Thermally conductive
Copper alloys Electrical and thermally conductive
In metal AM methods there are three main techniques; powder bed, powder feed and wire feed [9]. In the powder bed process the material (in powder form) is raked onto a build table. The build table moves downwards in steps between the powder depositions while lasers or electron beams melt part slices in the powder. The melted surface layer is fused together with the layer underneath, this process continues until the whole part is complete [6]. Powder bed systems have the ability of generating good dimensional control [9]. A drawback of these systems is that for some materials they leave excess material that cannot be reused (the powder which is not melted into a part).
In the powder feed system the powder is deposited by a nozzle while a laser melts it at a specific distance. Either the build table or the nozzle moves to build the part layer by layer [9]. These systems are more suit-able for large geometries than the powder bed systems since the process produces significantly less non-reusable powder (mostly). These processes also provides the option to repair or extend old parts by building directly onto the old part. The process does, however, limit the designs somewhat because the lack of a support structure.
In metal wire feed systems the material is supplied in wire form that is melted into layers by either laser, electron beam or a plasma arc. The wire feed systems usually produces a rougher part that needs machining but is able to build large structures relatively fast [9].
Plastic AM also utilizes the powder bed method mentioned above. The powder feed systems are not used for plastics but the wire feed systems are, with some alterations. Plastics generally have a low enough melting point, enabling the use of a heated nozzle to melt the plastic which is then spread into layers by the nozzle.
2.1 Additive manufacturing 11
An additional technique used for plastic AM is where a liquid polymer is cured by ultraviolet light. This technique can be used in different ways, the liquid can be spread in thin layers onto a build plate to be instantly cured layer by layer [10]. The technique can also be used to draw a part continuously out from a liquid vat [5].
In this thesis work two AM methods have been investigated further, the powder bed technique SLM for metals and the powder bed technique SLS for plastics. These two techniques, and the geometries that were fabricated by them, are presented in the following section.
2.1.1
Selective Laser Melting
SLM is a powder bed technique where a geometry is built by the fusing of a metallic powder. The process follows the same work flow as described in figure 2.1. The fabrication process begins by the placement of a thin layer of powder onto a build table. After the powder is placed a laser traces the cross section of the part to be built, using the information produced by a digital slice. As the laser grazes the metal powder it brings the metal above its melting temperature, causing the metal to briefly enter a liquid state and fuse together. Once the entire cross section has been traced the build table is lowered and a new layer of powder is spread on top of the fused cross section. Each time that the laser liquefies a new cross section it melts both the new powder and the fused cross section underneath, causing the layers to fuse with a dense result. The process is repeated until a finished part has been fabricated. During the fabrication the part experiences severe heat gradients which results in residual stresses in the material [11]. To prevent the part from distorting, a support structure is built that connects the part to the build table and holds it down. The support structure can also be used to facilitate the fabrication of overhangs. The fabrication process is protected from the ambient atmosphere by a shielding gas. This is done to prevent the melt pool created by the laser to react with oxygen [12]. The build chamber can also be heated to slightly above 100oC to reduce the risk
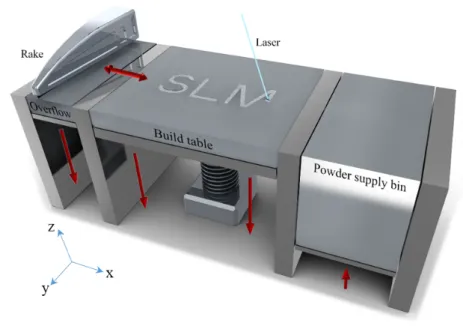
of contaminants, such as gas and moisture, being present in the powder. An schematic of the SLM process can be seen in figure 2.2 where a rake is used to spread the powder onto a build table from a supply bin.
There are several manufacturers of SLM systems located around the world. The systems comes in many different configurations and sizes, rang-ing from build volumes of 250×250×300mm to 500×280×325mm [9]. There is a variety of materials available for the SLM process, ranging from Alu-minium and Titanium to Cobalt-chrome alloys. In general, any weldable metal can be fabricated with the SLM technique. The SLM process is not fully understood, much work is spent on developing modelling tools and optimization of parameters [13, 3, 14].
12 Complex material systems
Figure 2.2. The configuration of the SLM machine used in in this work. Powder is supplied by a powder supply bin that moves powder upwards in incremental steps. Once the the powder is raised the rake spreads it over the build table and pushes any excess powder into the overflow bin.
There are many factors that can influence the part accuracy, some which can be effected and some inherent to the process. One of the part accuracy factors is the size of the raw powder, powder with smaller particles can increase the part accuracy but the powder is difficult to handle [15]. Other factors, such as the size of the melt pool, can be adjusted and tuned to give better part accuracy results, however, the increased accuracy comes at a cost. The dimensional accuracy and the material integrity are linked. Decreasing the size of the melt pool can be beneficial for the part accu-racy, however, it could cause the produced part to be highly porous since the metal particles will not receive sufficient energy to fuse [3]. Controlled porosity can in some cases be desired but for the most part a porous com-ponent is not suitable since it can display poor/unpredictable mechanical behaviour.
In this work the SLM system M290 from Electrical Optical Systems (EOS) was used to fabricate parts from a Titanium (Ti6AlV4) powder.
2.1 Additive manufacturing 13
2.1.2
Selective Laser Sintering
SLS is highly similar to SLM as it is also a powder bed technique. The SLS technique is, however, focused on plastic powders. The work flow is the same as in SLM, which was described in figure 2.1. The fundamental dif-ference between SLS and SLM is the way the the powder is fused together. In SLM the powder particles are exposed to enough energy that they melt, while in SLS the particles are kept in their solid state. Instead of melting the powder it is ”baked” together by exposing it to an exact amount of energy, bringing the powder particles close to, but not all the way, to the melting point [16]. The build chamber of the SLS process is preheated, depending on if the plastic to be sintered is semi-crystalline or amourphous the temperature of the chamber is brought close to the melting, or glass, temperature of the powder [6]. The laser used in the process is then only used to tip the powder over the edge to a liquid solid state so that it can fuse together. The processing window varies depending on the raw mate-rial but for some powders it can be fairly narrow, the temperature can not vary more than 3-4oC in some cases [6]. This places strict requirements on
the SLS systems when it comes to the laser properties and being able to produce an even heat distribution in the powder bed.
The production of high quality SLS parts is of interest in the industry since the main alternative to manufacturing of complex plastic parts is injection moulding. Injection moulding requires tools that can be both costly and time consuming to manufacture. Thus if only a smaller volume of components is desired the SLS method can be highly competitive, not to mention the new design possibilities that SLS provides.
As in SLM, there are many factors that influence the properties of the produced parts in SLS. Some of the important parameters are; powder size distribution, laser power, scanning pattern, build orientation and part placement in the build chamber [17]. Unlike SLM there is no need for support structure in SLS. This greatly increases the possibilities of what can be fabricated and it allows the manufacturer to fill the entire build chamber with parts on top of each other, which improves the efficiency of the method.
Since the powder particles in SLS are not fully melted there can be an issue with porosity for some materials. Fabricating a material with SLS that has the same properties as if it was injection moulded can thus be challenging since porosity has a large impact on the material properties [18]. The material properties of SLS parts is also influenced by the direction in which the part has been built. This is partly due to the weaker adhesion between build layers in the produced parts.
To alter and improve the properties of a plastic it can be mixed with a filler material. Such a material can be Copper or Aluminium to increase
14 Complex material systems
conductivity or it can be glass or carbon fibres to improve the mechanical properties of the material. The mixing of the filler material into the plastic powder can be problematic. The filler material is usually of a different size distribution and thus does not blend well and tend to separate from the plastic particles. To get a even mix the fillers are therefore commonly coated in the plastic before blending with powder particles [19]. Still, after this treatment there are complications with the spreading of the blended powder onto the build table. There are also problems with sintering of mixed powders because of the different properties of the constituents e.g. conduction, and shrinkage, can vary greatly between different elements.
In this work a material named CarbonMide (Sold by EOS) has been studied. The material is a composite blend of short carbon fibres (100-200 µm long and diameters around 10 µm) and polyamide 12. The material was fabricated into parts using the P396 powder bed system, also supplied by EOS. The P396 system spreads the powder from heated supply bins using a rake.
2.1 Additive manufacturing 15
2.1.3
Additive Manufacturing geometries
In paper I, carbon fibre reinforced polyamide parts were fabricated using SLS. The main interest was to characterise the material and relate the material integrity to the mechanical properties of the material. Since the carbon fibre reinforced polyamide material had previously displayed an anisotropic behaviour it was decided that tensile bars, according to ISO-527 [20], were to be fabricated in several build directions, seen in figure 2.3. Three bars were fabricated in each build direction, a total of 18 tensile bars. After fabrication the bars were bead-blasted to remove any remaining powder on the part surface.
Figure 2.3. a) Fabrication orientations of tensile bars in the build chamber, the movement of the rake that spreads the powder is along the x-direction b) Finished tensile bars fabricated in the x-direction, with dimensions displayed. Adapted from paper I.
In paper II parts were fabricated with both SLS and SLM. The part geometry was designed to determine the accuracy of the fabrication process when producing internal features. In this specific case the interest was to study the placement and shape of the internal features. The design chosen for this study can be seen in figure 2.4.
The design was fabricated in Ti6Al4V and polyamide 12. The finished parts can be seen in figure 2.5.
Two Titanium parts were fabricated, one of the parts were then post processed with a mill to reduce the material thickness. This was done in an attempt to improve the investigation process.
16 Complex material systems
Figure 2.4. Drawing of the complex part containing internal spheres, external half spheres, slanted edges, and steps. Adapted from paper II.
Figure 2.5. The finished complex parts a) The geometry fabricated in Ti6Al4V by SLM b) The Titanium geometry post processed by milling c) The geometry fabricated in polyamide 12 by SLS d) The main dimensions of the geometry. Adapted from paper II.
2.2 Multi-material systems 17
2.2
Multi-material systems
This is the second type of material systems that were studied in paper III and paper IV. Many components produced today utilizes several differ-ent materials, in differdiffer-ent sizes, shapes, and combinations. To investigate such components with CT can be difficult, because of density and material thickness related issues. A multi-material phantom was developed with the aim to study these systems with regards to measurement consistency. The phantom consists of a hollow cone geometry with precision spheres stacked on the inside. The precision sphere materials included in this work are listed in table 2.3 on the next page.
Figure 2.6. Schematic of the hollow cone geometry. Precision spheres are placed inside of the hollow cone. The diameter D is the same for all the precision spheres and is used as a reference value for investigations. Source: paper IV.
Precision spheres were chosen since they are reliable measurement points for CT evaluations. The precision spheres were placed into a hollow cone fabricated out of Aluminium (2.7 g/cm3), see figure 2.6. This geometry
18 Complex material systems
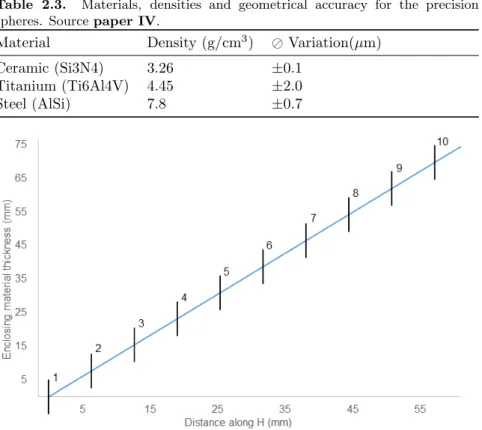
Table 2.3. Materials, densities and geometrical accuracy for the precision spheres. Source paper IV.
Material Density (g/cm3) Variation(µm) Ceramic (Si3N4) 3.26 ±0.1
Titanium (Ti6Al4V) 4.45 ±2.0
Steel (AlSi) 7.8 ±0.7
Figure 2.7. Enclosing material thickness as a function of the distance H. The black lines indicate the average enclosing thickness at the centre of each precision sphere. Source: paper IV.
is not complex to fabricate but it is complex with regards to CT investiga-tions, as will be explained in section 3.2.
The hollow cone causes the enclosing material surrounding the spheres to increase linearly with the height of the cone, according to figure 2.7. The dimensions of A and B were 6.35 mm and 40 mm respectively. Ten precision spheres with the dimension 6.35 mm were arranged inside of the hollow cone, one material at the time. This gave a total of three test assemblies.
CHAPTER
3
Computed tomography
This chapter starts with a description of the general principles of CT. These principles will contain the basics behind CT and also the limitations of the methods and the origins of the limitations. The chapter continues with a short descriptions of different CT methods to end up on dual-energy CT which, together with absorption contrast, has been the main method used in this thesis work.
X-ray computed tomography (CT) is a non-destructive testing method that generates a 3D volume of the examined object (or patient), revealing in-ternal features. The method has its very origins with Wilhelm R¨ontgen in the late 19th century when he discovered X-rays. The next breakthrough
concerning CT came in 1917 when Johann Radon formulated the Radon transform which was necessary for computations in CT [21]. It then took until 1963 before the physicist Allan Cormack applied the works of Radon to demonstrate a way to reconstruct X-ray images into volumes [22]. Fi-nally, in the early 1970’s an engineer named Godfrey Hounsfield invented the first CT machine (together with Cormack), intended for medicine [23]. CT started to see acceptance within the industry in 1994, but the method was still expensive and inaccurate compared with other methods for testing components [24]. Around 2005 the hardware development allowed for CT systems that were accurate enough for industrial use while still be-ing affordable [25]. There are today numerous systems bebe-ing used around the world. CT as an inspection tool offers advantages in several areas, for
20 Computed tomography
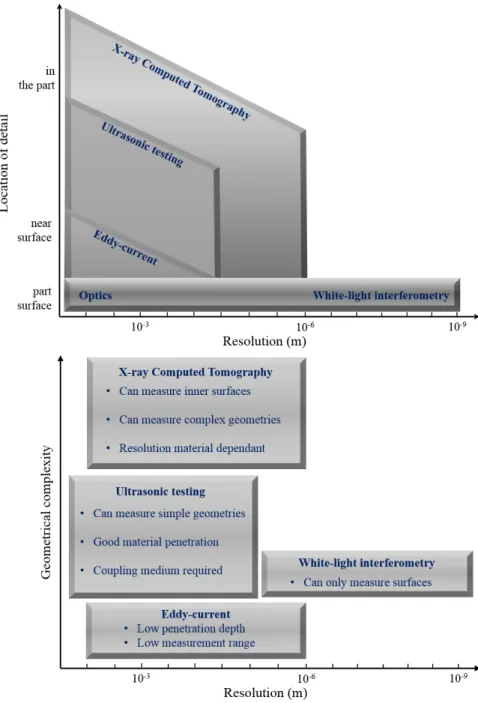
example: product development, process control, non-invasive metrology, material performance prediction, material integrity investigation, and fail-ure analysis. A rough comparison of capabilities between CT and other common non-destructive methods can be seen in figure 3.1.
3.1
General principles
CT exploit X-rays ability to penetrate material. When X-rays passes through a material they are attenuated depending on the amount of ma-terial that is penetrated and the attenuation properties of the mama-terial. The attenuation of a material is generally increased corresponding to the density of the material. The attenuation can roughly be said to follow the Lambert-Beer law,
I = I0e−µ(E)x, (3.1)
where I is the intensity of the X-rays that have passed through the sample, I0 the intensity of the incident X-rays before the sample, µ(E) the
attenu-ation coefficient of the material in the sample, which is dependent on the energy of the X-rays, and finally x is the thickness of the sample that the X-rays had to traverse. Using the attenuation of the X-rays it is possible to produce 2D shadows of an object that reveals internal features and geome-tries. These 2D shadows are called projections and if several projections of one object are obtained from different angles they can be combined into a 3D digital volume of the object. The 3D volume can then be investigated and analysed, revealing information about the interior of a part without damaging it. There are several different types of CT systems but all of them have three things in common; an X-ray source, a rotating stage, and a detector. The first CT systems were medical systems where the patient needed to be stationary, thus to acquire projections from several angles the X-ray source and detector needed to move. This solution is necessary for scanning patients since it would be highly impractical to rotate the patient during the CT scan. When scanning dead material, however, no concern of the object is needed and it can be rotated instead of the source and detector. This is preferred since it allows for more compact and accurate systems with less moving parts. There are several different CT techniques used today; pencil beam (rare), fan beam, parallel beam, and cone beam systems [24].
Pencil beam is one of the first types of CT systems that were produced. These systems uses a small beam of X-rays that penetrates only a small portion of an object at the time. These types of systems can be operated with a detector that has only one pixel, but it requires the source and de-tector to move all the way past the object in x and y plane to create a 2D
3.1 General principles 21
Figure 3.1. A rough comparison of the capabilities and characteristics of X-ray computed tomography, eddy-current, ultrasound, and interferometry. Adapted from [26].
22 Computed tomography F ig u re 3 .2 . A typ ic al c o n e b ea m X -ra y c o m p u te d to mo g ra p h y set u p . X-ra ys a re g en era te d wh en a cc el era ted e lec tro n s in tera c t wi th a ta rg et ma teria l, lo c a ted in sid e th e X -ra y tu b e. Th e X -ra ys tra v e l th ro u g h th e sp ec im en to b e in v est ig a ted a n d a re p ro jec ted o n to a d et ec to r th a t rec o rd s th e im ag e . Th e sp ec im en is fi x ed to a ro ta ti n g st a g e th a t ro ta tes a sm al l a n gl e in c reme n t a ft er ea ch im a g e h a s b een rec o rd ed . Th e p ro c ess is rep ea ted u n ti l e n o u g h ima g es h a s b een rec o rd ed to b u ild a 3 D v o lu m e o f th e sp e ci me n .
3.1 General principles 23
image. Repeating this process for a large amount of angle increments is highly time consuming but can give high resolution results. Fan beam sys-tems uses a fan of X-rays that can be collected by a line detector, collecting one row of the object at the time. This process is also highly time consum-ing, although not nearly as much as the pencil beam, but produces high quality scans. Parallel beam systems have many benefits but commonly depend on synchrotron facilities and are therefore not available to most industries. Cone beam systems are by far the most common set-ups in lab systems. The cone beam systems utilizes a cone of X-rays that illuminates the entire object in one flash for each angle increment. The cone beam causes some artefacts but are favoured over the other systems since it takes significantly less time to scan an object with a cone beam compared to the other methods. Schematics of the different setups can be seen in figure 3.3. In this work only the cone beam set-up has been used an henceforth it is the only one that is considered. A typical cone beam lab setup can be seen in figure 3.2.
Figure 3.3. Computed tomography setups displaying the sources, detectors and necessary sample movements a) Pencil beam setup b) Fan beam setup c) Cone beam setup d) Parallel beam setup.
The next section will give a description of the X-ray sources used in cone beam set-ups followed by a description of how the 3D volumes are recon-structed and analysed. This is followed by short descriptions of specialised CT methods.
24 Computed tomography
3.1.1
X-ray sources
The X-ray generation in an X-ray tube usually starts with the heating of a filament wire, typically made from Tungsten. The filament is heated by the means of a current and at some point it becomes energetic enough that electrons are emitted. These electrons are then accelerated by a strong potential and focused by magnetic lenses onto a target material. When the electrons interact with the target material X-rays are generated. The X-rays are generated mainly from two physical phenomena, the decelera-tion/deflection of electrons, and electron absorption. The deceleration of electrons causes them to loose energy, this energy is emitted as X-rays and can cover the entire energy spectrum of the incident electrons. This pro-duces a continuous X-ray spectrum. The deceleration type of X-rays is the by far dominating generation type and it is called ”Bremsstrahlung” , a con-traction from the German ”brems” (brake) and ”strahlung” (radiation) [27]. The second type of phenomena is when incident electrons excite electrons in the inner orbital of the atoms in the target material. The excited electrons transition onto a higher orbital in the atom where they are unstable, and transition back to a lower orbital. These transitions causes the emission of X-rays with exact energies (the transition energies), called characteristic X-rays since they are specific to the target material used. There are many different materials that can be used as targets. Common materials are; Tungsten, Molybdenum, Copper, and Silver. The target material effects where the characteristic peaks occur in the X-ray spectra, and when scan-ning low density materials it can be beneficial to have intensity peaks at low energies, while for dense materials it is usually better to have the peaks at higher energies. In general, the most influential factors for a X-ray spec-tra are; filament current, acceleration voltage, and target material. The filament current controls the intensity, the acceleration voltage the energy, and the target material the characteristics. An illustration of the X-ray spectra achieved with a Tungsten target can be seen in figure 3.4.
The higher energy that a photon posses the smaller is its wavelength. This increases the chances that a photon will travel through a material without any interaction. Thus, the higher energy that the X-rays have the easier it is for them to penetrate thick or dense material. The energy of the X-rays can be increased by increasing the acceleration voltage of the X-ray tube. The electrons that interact with the target will have higher energies and the width of the ”Bremsstrahlung” spectrum is increased. However, increasing the energy of the incident electrons comes at a cost, the interac-tion volume in the target material grows. Only around 1% of the incident electrons energy is emitted as X-rays, the remaining energy is transformed into heat [1]. Thus the target material needs to be cooled to keep the inter-action volume as small as possible and to prevent overheating the system.
3.1 General principles 25
0 0
50 180200220
100 160
Photon Energy (keV)
140 Acceleration Voltage (kV) 120 100 150 80 105 Intensity (n/mm ) 60 2 Bremsstrahlung 40 200 20 2 0 0 50 200220 180 100 160
Photon Energy (keV)
140 Acceleration Voltage (kV) 120 100 150 80 105 Intensity (n/mm ) 2 60 Characteristic peaks 40 200 20 2 0 0 50 180200220 100 160
Photon Energy (keV)
140 Acceleration Voltage (kV) 120 100 150 80 Intensity (n/mm )105 2 60 Total Spectra 40 200 20 2 a) b) c)
Figure 3.4. The X-ray spectra produced by a Tungsten target for various ac-celeration voltages a) Bremsstrahlung b) Characteristic peaks c) Total spectra. Data from [28].
26 Computed tomography
Figure 3.5. The electron beams interaction with a target material a) The in-teraction volume, called spot size in computed tomography b) A cross section of the target.
The interaction volume in the target is known as ”spot size” in CT and it will be discussed further in section 3.1.6. An example of this behaviour can be seen in figure 3.5.
When inspecting metal parts there is often a need for higher X-ray ener-gies to penetrate the material with sufficient intensity for the recording on the detector. Some examples of material thickness’s that can be penetrated, depending on X-ray energy, can be seen in table 3.1.
Table 3.1. Maximum penetrable thickness of materials for commercially aval-ibale acceleration voltages, adapted from [29]. It should be noted that being able to penetrate a material does not necessarily mean that the results will be useful.
Acceleration voltage 130 kV 150 kV 225 kV 450 kV Steel <5 mm <8 mm <40 mm <70 mm Aluminium <30 mm <50 mm <150 mm <250 mm Plastic <90 mm <130 mm <250 mm <450 mm
3.1.2
Stage and Detector
In most cone beam systems the sample is placed in a rotation stage that rotates the sample by small angle increments. There are also stages that moves the sample up or downwards while rotating them to create a
he-3.1 General principles 27
lix path for the sample. The accuracy requirements on the rotation stage are high since only small deviations can cause problems in the indexing of projections. For example, with a 2000 pixels wide detector an angular deviation of the stage of 0.03ois large enough to throw the indexing of pro-jections off track [24]. In many CT systems the rotation stage can also move between the X-ray source and the detector, changing the magnification of the scan.
There are many different types of detectors used in CT and the devel-opment of new, better detectors is rapid. The detector is critical for the quality of a projection, the size, amount, and sensitivity of the pixels are of importance. In lab systems it is common to use flat panel detectors. A CCD flat panel consists of a scintillator material that interacts with the incoming X-rays, producing lower energy photons. These photons can then be collected by a pixel behind the scintillator material that uses the photons to free electrons, that can be recorded and counted.
3.1.3
Reconstruction and Analysis
Once the projections of a sample have been recorded they need to be com-puted into a 3D volume, this is called reconstruction. The purpose of the reconstruction is to build a 3D volume of the projections with three dimensional pixels, called voxels. The by far most dominant method for reconstruction in material science is a version of the filtered back-projection (FBP) algorithm, presented in 1984 by Feldkamp, Davis, and Kress, known as the FDK algorithm [30]. In FDK the intensities of the 2D projections are divided into rows. For each row of the detector the values of the pixels are filtered and ”smeared” across the intended volume. The smeared inten-sities for each angle increment are then added together to form a slice of the object for each pixel row [31]. These slices can now be stacked on top of each other to form a complete 3D volume of the sample. A schematic view of the reconstruction process for a slice of an object can be seen i figure 3.6.
The FDK reconstruction is an approximation, except for the center slice of the volume which is reconstructed exactly. There are many other recon-struction methods to choose from today, especially in medicine. However, that is out of scope for this thesis as only the FDK algorithm was used for reconstruction.
Once a 3D volume has been reconstructed the analysis of the data can begin. The analysis usually starts with a thresholding of the volume. This is done to separate the voxels in the volume from each other by the means of gray values. Gray values are the intensities of the voxels, usually a high gray value corresponds to a high density material and a low gray value a low density material. Often the interest lies in a specific material and to isolate
28 Computed tomography
Figure 3.6. Schematic of a reconstruction. The blue lines represents a detector at different angles a) A cross section from an illuminated sample, the shadows on the detectors represents the collected intensities (inverted) b) The back projection reconstruction process, the intensities are ”smeared” over the volume to create the slice.
3.1 General principles 29
only those voxels a threshold is used that considers all voxel with a gray value less than those of interest to be background voxels. Once the material voxels have been determined measurements can be done in the volume. It is possible to measure, for example, dimensions, porosity, wall thickness, fibre orientations, and deviations from design. It is also possible to use the CT volume for structural or flow calculations. In the work presented in this thesis the main software used for analysis was the commercially available VGstudio [2].
3.1.4
Phase Contrast
When inspecting multi-material samples where the constituents have highly similar attenuation using only absorption contrast might not be sufficient to separate the materials in the CT data. A possible solution to this problem is to exploit the phase shifts of the X-rays [29]. As X-rays pass through a material the phase of the light shifts slightly, this shift is different for different materials. Even if the absorption of two materials is more or less the same the phase shift could be large enough to capture. There are many different ways to realize the phase shift lab systems. One way is to use gratings in front of and after the sample. The gratings produce fringes on the detector that can be used to calculate the phase shifts of the X-rays.
3.1.5
Diffraction Contrast
Many materials have a crystalline structure, and sub structures such as grains and plane dislocation. When the X-rays impinge on these planes they diffract, following Bragg’s law of diffraction. The diffraction is typically small and not detectable in normal lab set-ups. If, however, the distance between the sample and the detector becomes large enough (if a 1 mm sample is examined the distance to the detector should be around 5 m) the small diffraction angles can be detectable. Using this method it is possible to, for example, study individual grains in metals [32].
3.1.6
Limitations
Even though CT has been around for a long time it is not a fully mature method. This is especially true when it comes to material science and metrology. There are still many uncertainties associated with the method which needs to be resolved if CT is to gain a wide acceptance within the industry as a verification tool. In this section some of the bigger concerns regarding CT in the metrology area will be presented and discussed.
30 Computed tomography
Beam hardening
As presented in section 3.1.1 the X-ray spectrum used in most lab sys-tems is polychromatic. This means that rather than having one specific energy for all of X-rays the spectrum consists of a continuum of X-ray en-ergies. X-rays with a low energy are more susceptible to attenuate when passing through material than X-rays with higher energies. Thus when a polychromatic spectrum of X-rays traverses a material, the low end of the spectrum attenuates much more rapidly than the high end of the spectrum. This is problematic since most X-ray detectors only counts the amount of photons that hits the detector and not their individual energies. Since the low energy X-rays attenuate rapidly as soon as they interact with mate-rial it causes the detector to record a large decline of photons around the periphery of samples, especially for dense materials that have high atten-uation. When reconstruction the projections the reconstruction algorithm will, erroneously, create a dense shell on homogeneous materials because of this effect. The effect is called beam hardening.
The effects of beam hardening can be streaking throughout an entire CT volume, making the analysis process difficult and inaccurate. The dense shell in the CT volume also prevents accurate analysis of these sections. The effects of beam hardening can today be reduced in, mainly, three ways: physically filtering the X-ray spectrum, dual-energy setups, and algorithmic correction [33]. Physical filtering is done by placing a thin sheet of material between the X-ray source and the sample. When the X-rays traverse the filter they attenuate, depending on the thickness and material of the filter various amounts of the X-ray spectrum can be attenuated. Since the low energy X-rays attenuates more easily they can be significantly reduced by the filter while the high energy X-rays pass to a large extent. Physical filters are, however, not selective. Increasing the thickness of the filter will reduce the low end of the X-ray spectrum and can even cut off some low energy levels completely, but at the cost of reducing the intensity of the entire spectrum. Thus the physical filters are only useful to a limited extent. Dual-energy setups can be used to decompose the linear attenuation into its components, and use the components for a more accurate reconstruction. Algorithmic correction is a computational method that aims to transform the polychromatic data into monochromatic data. This is commonly done through a linearisation during the reconstruction.
Much work have been spent, and is still spent, on reducing the beam hardening impact on CT investigations [34, 35, 36].
3.1 General principles 31
Figure 3.7. Penumbral blurring for a focal spot with the size S.
Penumbral blurring
Penumbral blurring is caused by the fact that the X-ray source, called focal spot, has a finite geometry. The optimal form of the focal spot would be a point, but the focal spot in lab systems often come in the µm range at best. The size of the focal spot causes the edges of parts to be blurred on the 2D projections rather than sharp. A schematic of how the size of the spot size affect the resulting projections can be seen in figure 3.7.
As discussed in section 3.1.1 increasing the energy and/or intensity of the X-ray spectrum also increases the size of the interaction volume in the target and thus also the spot size. To penetrate large samples or dense materials, however, the energy of the X-rays needs to be high. This means that when investigating such samples it should be excepted that the blurring effect will be substantial. The effect of penumbral blurring is that it is difficult to determine the surfaces of components. The edge of a component can be blurred out over a large amount of voxels, causing the surface determination to become highly uncertain. Internal defects such as voids can also be completely erased by the blurring. The only way to prevent the blurring is to reduce the size of the focal spot. This often means to use lower X-ray energies and that means that the size of the samples often have to be reduced significantly for the penetration to be sufficient.
Thresholding and Segmentation
The first step of the analysis of CT data is to determine the surfaces of the object to be analysed. The voxel data set produced by CT contains voxels
32 Computed tomography
with a large range of different gray values. The gray values determine which material the voxel belongs to. For example, a value of 10000 can be the value for air and 60000 the value of material. Any voxels within a certain range of those values will then classified as either air or material. A common way to preform this classification is by using thresholds of gray values. If there are only two materials in the data set, for example air+material, then the ISO50 method can be used. In ISO50 a threshold is set at the halfway point between two peaks in the gray value histogram for a volume. All of the values that lies under this threshold is than classified as air (or background). This classification method can work well for data sets with only two materials. The strength of the method is that it is highly straightforward and easy to use with a good traceability. The weakness of the ISO50 method is that if there are more than two materials involved the method might not produce useful results [37]. For such data sets there is another method called local adaptive thresholding. In this method two sets of voxel volumes are selected by the user, these volumes are then used to calculate a surface between those two voxel group values. The local adaptive thresholding is more powerful than ISO50 when it comes to surface determination but it completely lack traceability. Since it is up to a user to select the voxel volumes there is no way to repeat the same thresholding operation between different users. This can be a big problem, especially with data sets that have a high noise-to-signal ratio. Different user might find that their results from using this method can differ by a substantial amount. There is a need for a thresholding method that gives similar or better results than local adaptive thresholding but without the user influence.
3.2 Dual-energy computed tomography 33
3.2
Dual-energy computed tomography
Certain geometries and material combinations can be particularly difficult to CT scan. Such material combinations and geometries were presented in section 2.2. When a sample contains materials with large differences in density it is difficult to find acquisition parameters that can capture both materials in a satisfactory way. If the parameters are optimised for the denser material, then the light material might get over exposed. If, on the other hand, the parameters are optimised for the light material then there is a risk that the dense material will not get penetrated. The same problems occur when investigating samples with high aspect ratios, or, large differences in material thickness.
To increase the contrast of the CT data in the case of large variety in material thickness and/or density there is an option to use a dual-energy (dual-energy computed tomography (DECT)) approach. DECT has proven to be useful in medical applications and is today employed at many clin-ics [38, 39]. DECT is also employed in security applications where small differences in density can be enough to distinguish between harmless, and potentially dangerous substances [40].
The main principle of DECT is to fuse the information from two dif-ferent energy spectrums. This is done to capture high quality data from each spectrum and discard low quality data. There are to date at least four methods to perform the data collection for DECT, sequential acquisition, rapid voltage switching, layered detector, and dual-source CT [41].
The sequential acquisition method is the most versatile of the methods and can be employed in almost any CT equipment. In this methods two complete projections sets are acquired at different energy levels separately. The drawback of this method is that it is time consuming to perform two complete scans for each object. In the rapid voltage switching method two projections are taken for each angle increment, one with high energy and one with low. This way one scan will give two sets of projections. This methods does place some requirements on the equipment since not all x-ray tubes can be operated in this fashion. There are also complications if one of the energy levels requires the use of a physical filter.
The layered detector technique uses a detector with two or more layers with different sensitivity. The sensitivity can be adjusted by the scintillator material used for the different layers. During the scan of the object the different layers record different spectral information. These systems are still under development. There are also other techniques being developed such as Quantum-counting detectors [41].
Dual-source CT are basically two complete CT systems sharing the same manipulator. The source-detector pairs are mounted orthogonally from each other and each one record a full data set during one scan. An
34 Computed tomography
obvious drawback of this setup is that the hardware costs of such a systems is doubled compared to the other systems. There can also be complications with cross-scatter radiation.
The computational steps after the acquisition of the data sets can generally be done in three different ways [42] pre-reconstruction, reconstruction and iterative-reconstruction. A drawback with the post-reconstruction methods is that artefacts (such as streaking from beam hard-ening) can be present in the reconstructed volumes and this can lower the quality of the result.
DECT is increasingly used in today’s material research, in biology for example, different density regions of specimens can be resolved nicely using the method [43]. Additionally, work has been presented where projections are fused with a dual-energy approach with the goal to perform dimensional evaluations [44]. It was found that the fusing could have positive effects on the deviations of measurements on step wedges. It has also been shown that the dual-energy approach can give good results when inspecting industrial parts for metrology purposes [45].
3.2.1
Dual-energy tool
In paper III and IV a DECT tool was developed and presented. The tool uses sequential acquisition data and pre-reconstruction fusing. Over and underexposed projections are acquired from a sample and used to build a fused projection. The fused projections are then reconstructed. The tool was developed and is run in MatLab 2015b [46]. The projections seen in the figures of this section are of the multi-material phantom presented in section 2.2.
Computational method
The computational method of the DECT tool follows the work-flow seen in figure 3.8. The work-flow and computational method was first presented in paper IV.Overexposed projections are used to build templates that controls the fusion process. The intensities of the overexposed projections are first normalised. The normalised projection is then used to build a template using the following expression;
I(xi, yn)T = ε(aIN5 + bI 4 N + cI 3 N+ dI 2 N+ eIN + f ), (3.2)
where I(xi, yn)T is the template, ε a scaling factor, IN the normalised
overexposed projection and a − f constants. The following notation will be used for the template henceforth:
3.2 Dual-energy computed tomography 35
Figure 3.8. Work-flow of the computational method. Overexposed projections are used to build templates that are in turn used to fuse the over and under-exposed projections together. A noise reduction filter is applied to the fused projections and which finally undergo a histogram adjustment to enhance the contrast. Adapted from paper IV.
36 Computed tomography
The template is used as a weight to fuse the two original projections using the following expression;
I(xi, yn)F = ITI(xi, yn)OE+ (1 − IT)I(xi, yn)U E, (3.4)
where I(xi, yn)F is the fused projection and I(xi, yn)U E the
underex-posed projection. The template is controlled by the user to ensure that desired values are extracted from each projection. The user can alter the values of the constants in equation (3.2) or choose from simpler fusing algorithms such as cos, sin, sqrt, and exp. The evaluation of the fusing results are performed by examining and comparing the intensity plot lines of the fused projections with the over, and underexposed projections. The deciding factor for the fusing function in paper III and IV was taken to be the relative contrast between the spheres and the cone. An example of this contrast and how it was evaluated can be seen in figure 3.9. The interface of the DECT tool during a fusion process can be seen in figure 3.10. More details concerning the DECT tool can be found in paper IV.
Figure 3.9. (a) A fused projection of the test object, the red line represents where an intensity plot is taken. (b) Three intensity plots, in blue the fused projection, red the underexposed projection and in black the overexposed pro-jection. The intensity for the projections have been normalized and the distance is in pixels across the projection. The depth of the center valleys stands in cor-respondence with the contrast of the object, the deeper the valley the larger the contrast. Adapted from paper IV.
3.2 Dual-energy computed tomography 37 F ig u re 3. 1 0. Th e in te rfa ce o f th e in -h o u se so ft w are d u ri n g fu si o n o f a p h a n to m . Th e in te rfac e d isp la ys th e o rig in a l p ro jec tio n s a n d th e fu sed res u lt , h is to g ra m s fo r a ll p ro jec tio n s, fi lt erin g fu n c tio n s a n d h ist o g ra m a d a p ta ti o n to o ls . Th e in te n sit y lin e p lo ts se en in th e rig h t o f th e in te rfac e a re a c qu ired fro m th e in ten sit y lin e in d ic a ted in red o n th e fu sed p ro jec tio n . Th e in ten si ty li n es fro m th e o ri g in a l o v er, an d u n d e rexp o se d p ro je ct io n s a re a cq u ire d fro m th e sa me lin e a s in th e fu sed p ro je ct io n . S o u rc e: pa p e r IV .
CHAPTER
4
Material integrity
In this chapter the results from investigations of the material carbon fibre reinforce polyamide introduced in section 2.1.3 is presented. These results were previously published in paper I. The carbon fibre reinforced polyamide was investigated with regards to, mechanical properties by the means of tensile testing, fibre orientation by the means of optical microscopy, and porosity and general structure by the means of CT. This chapter begins with a display of the CT results, following with the fibre orientation results and ending with the mechanical properties and a discussion as to why the materials behaves as it does.
4.1
Computed tomography results
The tensile bars where investigated with the Nikon XT H 225 system, using a Molybdenum target. A total of 18 tensile bars were scanned and the acceleration voltage and filament current were set to 62 kV and 153 µA throughout all the scans. Approximately 25-30 mm of the tensile bars gauge length were scanned for each tensile bar. It was found that the material was highly porous, an example of this can be seen in cross sections from a tensile bar built in the y-direction of the SLS build chamber, figure 4.1.
The levels of porosity for the tensile bars were calculated using CT data. Since the bars displayed severe fusion problems at the part edges it was not obvious what to include as porosity. Some of the pores in the tensile bars stretched from the surface of the tensile bars deep into the material. To
40 Material integrity
Figure 4.1. Cross sections from a y-oriented tensile bar a) cross section normal to the build direction b) cross section from the centre of the tensile bar, showing a layered structure that continues throughout the specimen c) cross section along the fusing area of two build layers. Source: paper I.
4.2 Fibre orientation results 41
Figure 4.2. Porosity of tensile bars, divided by build orientation. Both the porosity including/excluding the poorly fused part edges are displayed. Adapted from paper I.
accommodate for these circumstances two porosity measurements where made, one where only the internal voids are compared to the entire volume of the part, and one where the poorly fused edges are included in the porosity volume. The results can be seen in figure 4.2.
4.2
Fibre orientation results
The fibre orientation of tensile bars built in the x- and y-direction in the build chamber was examined by the means of optical microscopy. This was done since the CT system used for porosity investigation did not have sufficient resolution to segment fibres. The study was done to determine if there was any preferred direction of the fibres in the build layers. Samples of the tensile bars were polished down until the cross section at the centre of the tensile bars were exposed. At these cross sections, a total of 3000 fibres were examined and classified by their orientations. The results of these measurements can be seen in figure 4.3. It was also found that no fibres were oriented in the the z-direction of the SLS build chamber.
42 Material integrity
Figure 4.3. The orientation of carbon fibres in the x and y tensile bars. The orientation is along the tensile bars length direction, 90o is parallel to the build direction of the specimen while 0o is perpendicular. Adapted from paper I.
4.3
Mechanical results and discussion
The mechanical properties of the tensile bars were evaluated by the means of tensile testing, the results can be seen in table 4.1.
Table 4.1. Tensile test results for the carbon fibre reinforced polyamide tensile bars, depending on build orientation. Source: paper I.
Tensile strength (MPa) Strain at break (%) Young’s modulus (GPa) Orientation Avarage STD Avarage STD Avarage STD
x 66.7 0.3 3.0 0.6 6.3 0.2 y 54.0 1.1 5.1 0.1 3.6 0.3 xy 56.7 0.7 4.6 0.3 4.1 0.1 x 45o 31.3 1.3 2.7 0.9 2.4 0.1 y 45o 31.9 0.6 2.5 0.3 2.1 0.0 xy 45o 30.9 1.2 2.4 0.9 2.1 0.1
As can be seen from the mechanical results the material has the highest tensile strength and Young’s modulus in the building plane. This is most
4.3 Mechanical results and discussion 43
Figure 4.4. Illustration of the rake spreading a powder layer in the build cham-ber. Fibres that are not oriented in the plane of the build chamber will become aligned by the interaction with the moving rake. Source: paper I.
likely partly due to the severe porosity between the build layers, as could be seen in figure 4.1. The porosity can be due to several reasons, from powder packing problems caused by dissimilar constituents to the fact the the shrinkage of the constituents vary greatly during the sintering process. Further it was that the tensile bars built in the x-direction possessed a higher tensile strength than the ones built in the y-direction. This is most likely due to the fibre orientation in the build layers. The cause for this fibre orientation could possibly be the movement of the rake that spreads the powder. Since the length of the fibres are in the range of the layer thickness in the build the rake will mechanically orient any fibres previously oriented in the z-direction towards the direction in which the rake moves, the x-direction. An illustration of what the interaction could look like can be seen in figure 4.4.
Due to the highly anisotropic behaviour of the material it would be a difficult challenge to design parts that takes advantage of the material behaviour.
Regarding the fibre orientation analysis, it would have been beneficial to perform it using CT data. However, it was found that the available system was unable to produce the required resolution and contrast. If a system with a higher resolution had been used it would have been possible to acquire fibre orientation data from the CT volume. This could possibly have revealed more information than was found optically. The statistical accuracy of the fibre orientation analysis could also have been improved.
![Table 2.1. Common plastic materials available for various AM processes today [5, 6, 7]](https://thumb-eu.123doks.com/thumbv2/5dokorg/5399847.138180/20.667.90.575.505.719/table-common-plastic-materials-available-various-processes-today.webp)

![Table 2.2. Common metal alloys available for various AM processes today [8, 7]](https://thumb-eu.123doks.com/thumbv2/5dokorg/5399847.138180/22.667.94.555.180.342/table-common-metal-alloys-available-various-processes-today.webp)