IT 21 007
Examensarbete 15 hp
Januari 2021
Implementation of FaDO in React.js
Ammar Aldhahyani
Teknisk- naturvetenskaplig fakultet UTH-enheten Besöksadress: Ångströmlaboratoriet Lägerhyddsvägen 1 Hus 4, Plan 0 Postadress: Box 536 751 21 Uppsala Telefon: 018 – 471 30 03 Telefax: 018 – 471 30 00 Hemsida: http://www.teknat.uu.se/student
Abstract
Implementation of FaDO in React.js
Ammar Aldhahyani
This report describes the implementation of FaDO as a REACT.JS web-based tool. FaDO is a machine learning method for real-time fraud detection: it flags (financial) transactions as either fraudulent or normal in a real-time fashion. FaDO implements semi-supervised machine learning for this task: in semi-supervised learning, only a small portion of the presented data needs to be labeled. This tool is designed as a filter that works together both with existing automatic fraud filters and human experts. The contribution of this work is a dynamical webpage that implements and demonstrates the approach. Herefore, the REACT framework and the JSX program-ming language were used. The emphasis of this tool is put on real-time in-browser processing of all data. In order to illustrate the tool, a realistic artificial transaction generator was implemented. The tool then allows to organise different fraud filters to select fraudulent transactions from this high-frequency stream. This report gives also preliminary key performance indicators (KPIs) of the approach. A comparison to a realistic hand-crafted expert system is given.
Examinator: Johannes Borgström Ämnesgranskare: Kristiaan Pelckmans Handledare: Kristiaan Pelckmans
Table of Contents III
Table of Contents
Abstract II
1 Introduction 1
1.1 Financial fraud detection . . . 1
1.2 Detection using machine learning . . . 1
1.2.1 Supervised anomaly detection techniques . . . 2
1.2.2 Unsupervised anomaly detection techniques . . . 2
1.2.3 Semi-supervised anomaly detection techniques . . . 3
1.3 Instantaneous machine learning . . . 3
List of Acronyms 1 2 Methodology 4 2.1 Design of FaDO . . . 4 2.1.1 The algorithm . . . 4 2.1.2 A Layered Approach . . . 5 2.2 Implementation . . . 8 2.2.1 React . . . 8 2.2.2 Design . . . 8
2.2.3 Visualisation choices and Functionalities . . . 9
2.3 Key performance measures . . . 13
2.3.1 False positives and False Negatives . . . 13
2.3.2 Precision and recall . . . 14
2.3.3 ROC curve and AUC . . . 15
2.3.4 Label efficiency . . . 15
2.3.5 Computational efficiency . . . 16
3 Results 17 3.1 Case study: description of quasi-real data . . . 17
3.1.1 Transactions Generation . . . 18
3.1.2 Artificial labeling . . . 19
3.2 Test run . . . 19
4 Discussion & Analysis 22 4.1 Analysis . . . 22
Table of Contents IV
4.2 Discussion . . . 24
5 Conclusion and future work 25
5.1 Conclusion of the work . . . 25 5.2 Future work . . . 25
Bibliography 26
Appendices 27
.1 The Design OF React Implementation . . . 27 .1.1 Header . . . 27 .1.2 Layers . . . 27
Introduction 1
1 Introduction
1.1 Financial fraud detection
Financial fraud in financial transaction systems affects the financial industry, govern-ments, customers, and organizations in different ways. Fraud is increasing dramatically with the expansion of modern technology and the global superhighways of commu-nication, resulting in the loss of billions of dollars worldwide each year [1]. Financial fraud detection has always been a crucial task, but the traditional methods of detection relied on the manual handling of transactions for discovering fraudulent behavior. Many traditional methods are however time and money consuming, while they are not suited to deal with the high frequencies required in transaction systems. Nowadays in the age of big data and new technologies such as cloud and mobile computing, these methods are impractical. The automated process has been introduced to handle such data with great efficiency. Statistics and machine learning provide effective technologies for fraud detection and have been applied successfully to detect activities such as money launder-ing, e-commerce credit card fraud, telecommunications fraud, and computer intrusion, to name but a few [1]. However, the development of new fraud detection methods is made more difficult by the fact that the exchange of ideas in fraud detection is limited. In fact, not describing fraud detection techniques in great detail in the public domain is related to the fear that might give criminals the information that they require to evade detection. Data sets are not made available and results are often censored, making them difficult to assess [2].
1.2 Detection using machine learning
Machine learning which is a subset of Artificial intelligence can provide systems that have the ability to learn and improve their performance on a certain task or group of tasks over time. However, unlike statistical approaches which mainly focus on understanding how the data is generated (the process), machine learning techniques, on the other hand, focus on building systems that improve from previous results. Fraud detection which is often referred to as anomaly detection or outlier detection is a technique to identify rare items that have different patterns than the majority of the data-set. Three categories of fraud detection solutions exists [3]. Unsupervised anomaly detection techniques, Supervised anomaly detection techniques, and Semi-supervised anomaly detection
Introduction 2
techniques. Moreover, there are hybrid approaches where multiple techniques are being used to detect anomalies.
1.2.1 Supervised anomaly detection techniques
Supervised techniques required data comprised of fully labeled training and test data sets. A classifier need to be trained first on an labeled training data set, and is then applied to realtime data. Predictive supervised algorithms examine all previous labeled transactions to mathematically determine how a standard fraudulent transaction looks like by assigning a risk score (Sherman, 2002)[4]. Three problems are preventing a direct application of this approach:
• Class imbalance: outliers occur typically in less than 1% of the cases, making super-vised learning difficult. Indeed, a learned model that will predict any transaction as normal would achieve more than 99% accuracy, but will also be completely useless in this setting. Methods to overcome this problem are often based on over-and under-sampling, or learn using modified accuracy criteria.
• Relevant Labeling: A supervised method depends crucially on a good annotation of the data used for training. If the labeling is too messy, the derived models will not a good performance.
• Time variation: Models and data will be outdated fast: a transaction which was considered fraudulent before might become irrelevant anymore. Moreover, attacks as account take-over leverage historical trusted behavior to conceal fraudulent behavior. The usual approach of re-training the algorithms after a fixed time requires one to continuously (invest in) annotate new data.
This setup of supervised learning is the least flexible as compared to others since we are assuming all anomalies are known and labeled correctly which is not the case for many applications. Most of the time, anomalies are not known in advance and can occur spontaneously during the test phase.
Neural networks are popular in this setup. Also, Support Vector Machines (SVM) have been applied and would perform well.
1.2.2 Unsupervised anomaly detection techniques
Unsupervised anomaly detection doesn’t require any labels wherefore it is the most flexible setup. The idea behind the unsupervised way of detecting fraud is that the model assumes most of the transactions or data are normal. Based on that assumption, the model over time can identify what a normal transaction looks like and decides whether each new transaction is a normal transaction or if it should be flagged as fraud depending on the intrinsic properties of it.
Introduction 3
1.2.3 Semi-supervised anomaly detection techniques
Semi-supervised learning is an approach that combines a small amount of labeled data (supervised) with a large amount of unlabeled data (unsupervised) during training. Using unlabelled data with a small amount of labeled data can improve the learning accuracy. Labeling data in such an approach often required skilled experts to label the right data to infer the correct labels for the given unlabeled data. Since in fraud detection it’s hard or actually impossible in some cases to know all fraud cases beforehand and also how expensive is to have a whole labeled dataset, semi-supervised learning can be a very practical solution in such cases.
Figure 1.1: Different anomaly detection modes depending on the availability of labels in the dataset [5]
1.3 Instantaneous machine learning
The need is growing for real-time processing of transactions due to the rise of platforms and services that guarantee that transactions are getting processed immediately. The Swedish "Swish" is an example of such platform [6]. In case of real-time processing, all machine learning techniques could work depending on the use case itself. For example, if all fraud is known previously, supervised learning with a model sufficiently well trained, will work in this case. Other cases will require different techniques or might require a combination of multiple techniques working at the same time.
Methodology 4
2 Methodology
2.1 Design of FaDO
2.1.1 The algorithm
FaDO is an online fraud detection algorithm that was developed by Kristiaan Pelckmans with a guaranteed worst-case performance [7]. Algorithm 1 presents the pseudo-code of the standard version of FaDO.
Algorithm 1FADO (ε) Initialize w0=0n for t=1, 2, ... do (1) Receive transaction yt∈Rn (2) Raise an alarm if kyt−wt−1k2≥ε, and set vt= kyytt−−wwtt−−11k 2 ∈Rn.
(3) If ytwere a false alarm, then update
wt=wt−1+γtvt
Otherwise, set wt=wt−1 end for
In algorithm 1, First, the model is initialized as w0=0n, a zero-vector with dimensions
equal to the number of features in a transaction. Then, for every iteration, the transaction is received and encoded as a vector. In (2) the Euclidean distance between the transaction vector and the model is calculated and if it is equal or greater than the radius ( ε ), an alarm is raised. Then the transaction is manually inspected, and if ytis falsely positive
(ytis normal really), then the model gets updated with a factor γtvt. If the Euclidean
distance is less than ε, the model does not change wt=wt−1.
During the first iterations, the system will raise many alarms (which not necessarily mean that those transaction are indeed fraudulent) as in the first iteration the system is still in the exploration phase and still need to learn what a normal transaction is. Most
Methodology 5
of the alarms in the first iterations are false-positives and after the learning phase, the model gains certain power of detection and will start exploiting its gained knowledge so that the false positive alarms will decrease. FaDO can be tuned by changing ε: this
ε≥0 is the radius around the model that defines the normal class wt, and γ>0 sets the
learning rate. Further details and more careful implementations of FaDO can be found in this report [8].
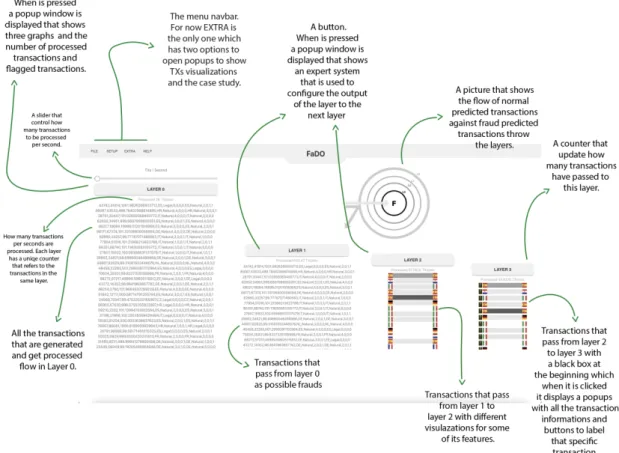
2.1.2 A Layered Approach
The tool contains 4 layers: each layer contains a flow of transactions, while transactions are filtered inbetween each layer. The first filter (L0>L1) implements FaDO based on
semi-supervised machine learning. The second filter (L1>L2) connects to an existing
cloud-based platform, while the third filter (L2>L3) invokes an expert system. Each
layer processes a decreasing amount of transaction, so that only around 10 transactions per hour are displayed in the last layer.
L0
Layer 0 is the one that generates the transactions, processes them, and implements the FaDO algorithm. First, the transactions are generated (see the results section). Then, each transaction is encoded using one-hot encoding as a vector that contains 45 dimensions. These 45 dimensions represent 3 features of the transaction: sender country, receiver country, and amount. There are 20 countries in the dataset and 5 different intervals of the amount. The first 20 bins of the vector represent the sender country which would be all zeros except the actual sender country. The next 20 dimensions represent the receiver country in a similar way. The last five dimensions represent the amount (interval): those five dimensions will be all zero except for the dimension corresponding with the actual amount of that transaction. This vector representation of a transaction will be used in the algorithm to compute the norm and to update the model. The algorithm is implemented as it was described in the methodology section but with one exception that the model won’t be updated depending on the alarm but in fact, there is another function that updates the model when transactions get labeled in layer 3. For now and for the sake of computing the KPI’s, there is a function that gives a probability of 0.1% of transactions to be labeled as frauds and in another case, if the transaction country is ’IT’ it gives it 1% to be labeled as a fraud. Also if there is an alarm but the transaction is not labeled as ’fraud’, it updates the model. Furthermore, after processing each transaction, layer 0 updates the counter and the alarms on layer 0 popup window plus that the same window displays three graphs which are described in (the visualization subsection). Also not forgetting the slider that exists above layer 0 that control the number of generated and processed transactions and below the slider there exists a frequently updated transactions/seconds counter.
Methodology 6
L1
Layer 1 works as a cloud-based system that implements deep learning to filter trans-actions coming from layer 0. All the flagged transtrans-actions as possible fraud from layer 0 get displayed in layer 1. In this thesis, the cloud-based system is still not used and Layer 1 for this thesis has a popup window with a configurations system that has all the transaction’s features which the user or the expert can use to control layer 1 output to layer 2. For example, the user can set the sender country to only a specific country so only transactions with the same sender country can pass to layer 2.
L2
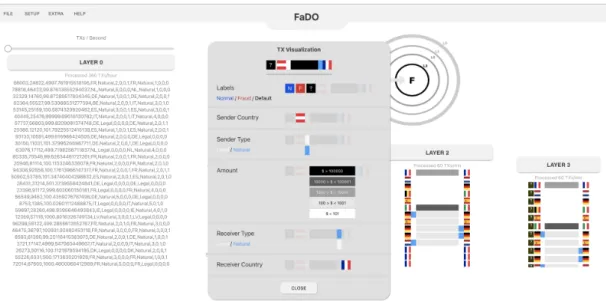
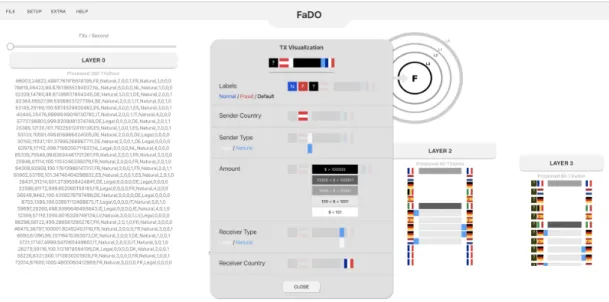
Layer 1’s transactions first go throw a function that checks if the user set some configu-rations or not and if so it outputs to layer 2 only the transactions with the same features that were set in layer 1 expert system. Layer 2 then displays transactions in a different way than layer 0 and layer 1. It displays the colors and pictures representations of only some of the features of the transaction. It shows sender country flag, sender type color, amount color, receiver type color, and receiver country flag respectively as it is shown in figure[4.1] with better details. Moreover, layer 2 also has an expert system in its popup window that works the same way as the one for layer 1 for this thesis but in the future, it will use an external system to filter the transactions.
L3
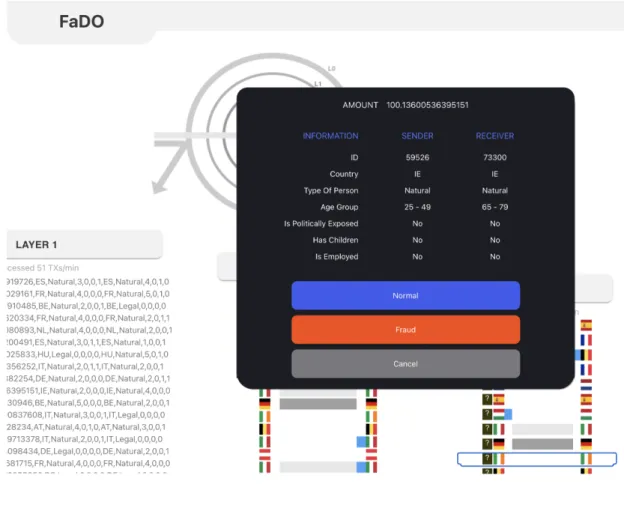
The same things go for layer 3 and only transactions with the same features that were set in layer 1 and layer 2 will pass to layer 3. Also, layer 3 has the same transactions visualization as layer 2 except that layer 3 has a black box at the beginning of each transaction that has ’?’ inside it and that is the label which by default is empty. The user or the expert can click on it and it will display a popup window that has all the transaction information with three buttons to label the transaction. One button to label it as normal, another one to label it as fraud, and the last one is to cancel and leave it
Methodology 7
without a label. When a transaction gets labeled then there is a call back function that sends it a transaction vector to update the model.
Methodology 8
2.2 Implementation
2.2.1 React
React is an open-source JavaScript library that is being used for building interactive user interfaces. React was chosen since it has a better performance as compared to other frameworks, but also since it’s actively maintained. Actually, this project was initially implemented using Vue.js, and around 70% of the project was done using Vue.js before we decide to re-implement everything using React. React gave us more freedom to split the components and to make it easier for others to understand the code.
2.2.2 Design
The main purpose of the website is to showcase the generated data flow and to give the user the ability to see the whole picture, control the configurations, and to have some inputs to update (FaDO) the semi-supervised algorithm we implemented. For that purpose, we had to have everything on one page that doesn’t need any scrolling to show the whole content so the user can see everything at once. The website has four layers that display the data flow to give more freedom to the user to have different configurations in some of the layers to control the data output. Moreover, each layer has a popup window that also can fit part of the page and that is actually needed since we
Methodology 9
have counters, configurations, graphs shown in the pop-ups which are needed to be shown together to serve the functionality.
Figure 2.2: The detailed final Design
2.2.3 Visualisation choices and Functionalities
On the website, we tried to give the user a clear picture of what is going on. An image in the top-right corner shows the mechanism of the detection algorithm through the layers that take up most of the page.
Layers
The tool displays 4 layers. Layer 0 is the input of all transactions which shows all the streamed transactions. layer 1 only shows the flagged transactions as possible frauds passed from Layer 0. Layer 2 and layer 3 show respectively the outputs of layer 1 and layer 2. Each layer contains three parts, a button that can be clicked to show a window that has a different visualization for each layer, a speed counter that shows how many (transactions/time) are processed in every layer, and the actual transactions flowing
Methodology 10
and the whole flagged transactions respectively, so they both display each transaction with all features. On the other hand, layer 2 and layer 3 display the transactions with a meaningful representation for only some selected features which are mostly needed to see by experts when filtering and labeling the transactions. User or expert can see the transaction visualization in detail by clicking EXTRA from the bar menu which will open a window as is shown in figure 2.1.
Figure 2.3: Layer 2 & Layer 3 Transactions Visualization
Labeling
In the beginning, Layer 0 processes only one transaction per second with the ability offered by a slider to speed up the transactions flow up to 1000 TXs/sec. The idea behind that is to give the user the ability at any time to control multiple tools and to have a better user experience when trying to open the pop-up windows. The reason why that might be a problem when processing a high number of transactions is the fact that JavaScript is a single-threaded language. When there is a function that generates hundreds or thousands of transactions per second, other functions that serve visualizations and interaction will not work flawlessly since JavaScript only does one thing per time.
Furthermore, one of the main uses of the slider is to give more control when labeling transactions in layer 3. The process of labeling the transactions in layer 3 can be done by clicking on any transaction in layer 3 which would show a window as it is shown in figure 2.2. The popup window displays all features in the selected transaction so the
Methodology 11
user or the expert gets a full insight to label it as a fraud or normal or even leave it as default.
Figure 2.4: The final Design
Configurations
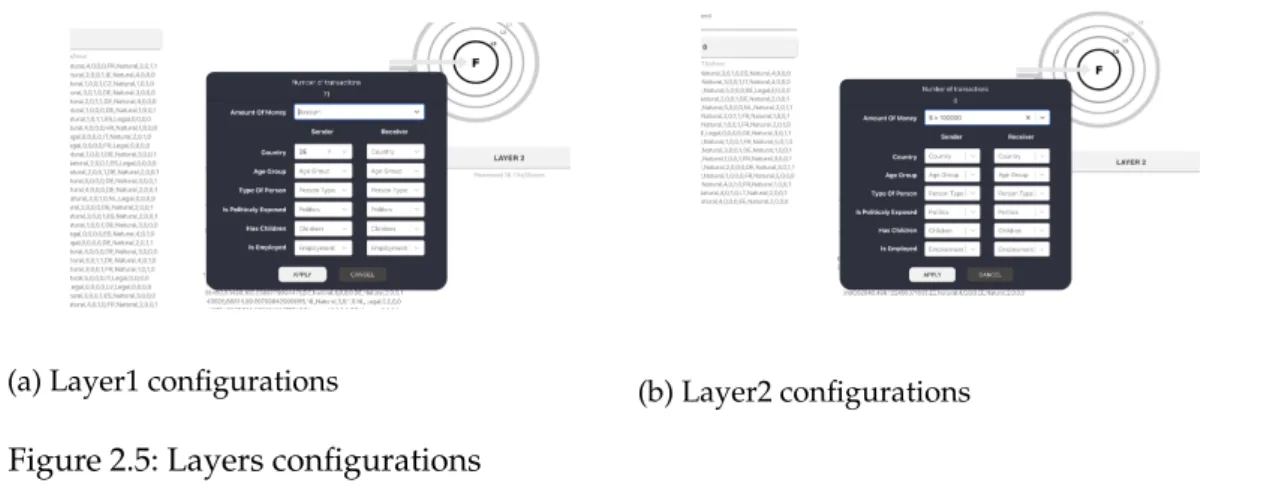
Layer 1 and layer 2 offer features’ configuration for their output to the next layer as is shown in figure 2.3. These windows will display if layer 1 or layer 2 gets clicked. Actually, they are both identical but one serves the output from layer 1 to layer 2, and the other serves output from layer 2 to layer 3. All the selected features that exist in transactions that are processed in layer 2 and layer 3 can be seen in the window. The user or expert can filter these features and control which transactions with specific features can pass to the next layer. Such a tool will simplify the process and will give the user more control and speed to label the transactions.
Methodology 12
(a) Layer1 configurations (b) Layer2 configurations
Figure 2.5: Layers configurations
Graphs
If layer 0 is clicked, the window in figure 2.4 will be displayed. It contains three graphs that will automatically be updated as transactions get labeled in layer 3. The first graph is a historical graph that shows the norm’s value of the last 100 transactions. There is a dashed line that indicates the radius (ε) around the model which in our case was set equal to 1.65. The second graph is a line graph that shows the model values. The model initializes first as a vector that contains 45 bins of zeros which in our case are senders’ countries (20 bins), receivers’ countries (20 bins), and amount of money (4 bins). When the labeling process starts, the model gets updated accordingly. The last graph is a bar graph that shows the average value of all the encoded vectors of the transactions that have been processed until that moment.
Methodology 13
2.3 Key performance measures
2.3.1 False positives and False Negatives
A False Positive (FP) is when either a financial institution or merchant rejects a legiti-mate transaction due to the suspicion of fraudulent activity. On the other hand, a False Negative (FN) is when a fraudulent transaction is miss-classified as a normal transaction. According to chargeback, a company providing a software solution for chargebacks in the e-commerce, the e-commerce in the US lost 6.7 billion dollars on fraud in 2016 [9]. Chargeback also said that in 2014 the amount of money lost due to false positives (normal transactions falsely blocked) was 118 billion dollars [10]. False positives and false negatives are challenging problems in the world of fraud detection and even though companies are losing way more money than they are gaining from such a solution they have to do this out of fear of losing their image of being a trusted partner.
The False Positive rate (FPr) is computed as FPr= FPFP+TN
And the False Negative rate (FNr) is computed as FNr= FNFN+TP
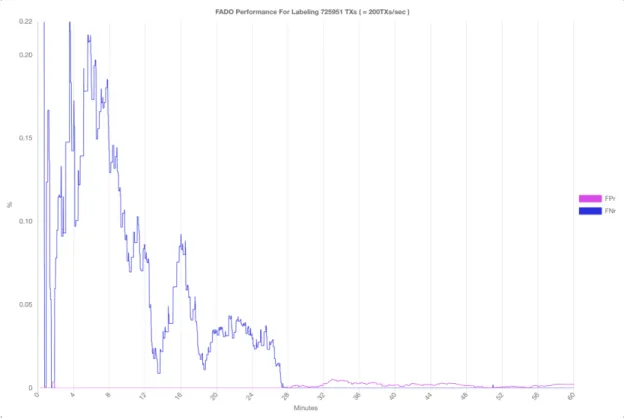
In our case, FaDO is based on a semi-supervised learning system that can work in parallel with an existing system. So in order to compute the false positive rate and the false-negative rate generated by FaDO, we ran a stream of 200 transactions/sec for one hour and created artificial labeling that would give every transaction a random label. After processing 3000 transactions in 15 seconds, we got a false positive rate (FPr) of ’0%’ and a false negative rate (FNr) of ’0.6598%’. After around 27 minutes the FNr dropped
Methodology 14
to zero while the FPr kept being around zero. The test ends after one-hour Processing 726161 TXs with FPr equal 0.00214% and FNr equal 0% as shown in figure [2.2].
Figure 2.7: False Positive and Negative Rates
2.3.2 Precision and recall
Recall or (TPr) defines how many of the actual frauds are flagged as positive. recall= TPTP+FN
Precision defines how many of the flagged transactions were actually positive (fraudu-lent).
Methodology 15
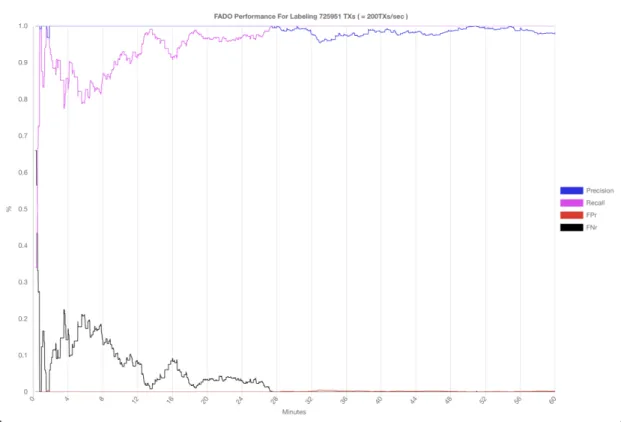
In the same test which was mentioned above, recall and precision were computed as well as in figure [2.6].
Figure 2.8: KPI’s (recall, precision, false positive rate, false negative rate)
2.3.3 ROC curve and AUC
The Receiver Operating Characteristics (ROC) curve plots the TPr (or recall) as a function of the precision. Area Under the ROC Curve (AUC) is a metric that is used to mark algorithms on unbalanced problems. It measures how well the solution differentiates between the two cases (maximal 1, minimal 0.5), and is visualised as the area covered under The ROC curve.
FPr= FPFP+TN
The maximum score is 1 and the minimum is 0. A completely random classifier would score an AUROC of 0.5 so everything higher than that is an improvement.
2.3.4 Label efficiency
This measure quantifies how many TXs were labeled. For unsupervised learning, this is 0% since unsupervised learning doesn’t require any labels and the way it works is by better learning the general structure of the data over time so it doesn’t depend on
Methodology 16
for the supervised model to work it needs to be trained on a fully labeled dataset. For example, in our case, a model should be trained in a dataset with all transactions are labeled as normal or fraud and then tested on a small portion of the same but unlabeled dataset before using such a model on new transactions to decide if they are normal or fraud. For semi-supervised learning, it’s in-between. Semi-supervised learning learns some features from only a small portion of labeled data and also find a way to learn from the larger portion of unlabeled data by learning the general structure.
2.3.5 Computational efficiency
Computational efficiency is the maximum number of TXs processed per second. Pro-cessing real-time transactions need an algorithm that has high computational efficiency. FaDO works in a streaming way since its capability to handle high dimensional data and its time complexity of deciding if a transaction is fraudulent is onlyO(1)which makes it able to process tens of thousands of transactions per second. In this case, FaDO serves as a web-based tool with multiple visualizations so its computational efficiency depends actually on other factors. The website is build using JavaScript which is a single-threaded language, and with having some visualizations in the website and many displayed outputs that are being updated frequently, a performance’s trade-off needs to happen to keep a nice user experience along with quite well computational efficiency. FaDO in this case still able to process up to 2000 transactions per second.
Results 17
3 Results
3.1 Case study: description of quasi-real data
The data which has been use in this project has been created in order to provide a close approximation to real-time data. This dataset has 100.000 customers and each customer has 6 features.
"Country":"DE","TypeOfPerson":"Natural","AgeGroup":"4","PEP":"0","Children":"0","Employed":"0" This is the format that each customer has in the dataset and the table below gives a better
understanding about the different features that customers could have
Table 3.1: Customers features.
Country Type Of Person Age Group Is Politically Exposed Has Children Is Employed DE Natural 0 ( < 15) 0 (No) 0 (No) 0 (No) BE Legal 1 (15 - 24) 1 (Yes) 1 (Yes) 1 (Yes) AT 2 (25 - 49) FR 3 (50 - 64) EE 4 (65 - 79) ES 5 ( > 80) IT LT NL CZ BG EL HR CY DK IE HU LV LU
Results 18
3.1.1 Transactions Generation
The script starts by a weighted selection between two options. One has 98% probability to be selected and the other has 2% probability.
The 98% probability
in this case, the SENDER will be randomly chosen from the whole dataset and the same thing goes for the RECEIVER but excluding the case when they are the same customer.
The 2% probability
In this case it would be a bit complicated because there will be another weighted selection for the customer country. One option would be if the country is ’LV’ and it has 50% probability to be selected. The second option would be if the country is ’BE’ and it has 40% probability to be selected. The last option would be any other country and it has only 10% probability to be selected.
In case of ’LV’, the SENDER will be chosen randomly from customers they share the same country. The RECEIVER will be chosen randomly from customers they have ’DE’ as a country.
In case of ’BE’, the SENDER will be chosen randomly from customers they share the same country. The RECEIVER will be chosen randomly from customers they have ’IT’ as a country.
In the last case, the SENDER will be chosen randomly from customers they don’t have ’LV’ or ’BE’ as a country. The RECEIVER will be chosen randomly from customers
Results 19
After the sender and receiver are chosen
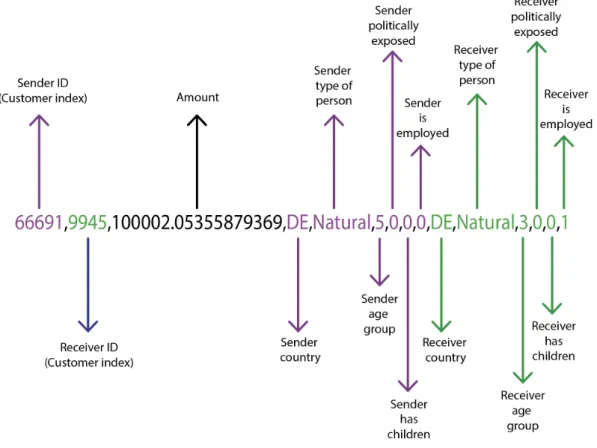
Later on, different amounts of money will also have different weighted selection and the chosen one will have other few multiplications before it is a signed for the transaction.
Figure 3.1: Transaction Information
3.1.2 Artificial labeling
’In order to compute the KPI’s, we need access to the reference labels. In this feasibility study, they were generated artificially using a quasi random pattern as explained in subsection 2.1.2 (A layered approach).
3.2 Test run
To have a test run, we started the app and initially it started processing 1 transaction per second which nice to give the user the time to set filters before processing many transactions. It was asked to label transactions that have AMOUNt > 100.000 as normal transactions. One way to make that easier is by opening the configurations window on layer 2 and sitting transactions amount as greater than 100.000 for the the transactions
Results 20
transactions as possible frauds that have AMOUNT > 100.0000 which will make it easier to test and to label.
Before configurations were set, three random transactions were already passed to layer 3 and then after the filter was set and for the first 30 seconds of the test 3 transactions with amount > 100.000 passed to layer 3 and got labeled as NORMAL as shown in figure [3.2] and the three transactions are shown in details in figure [3.3] .
Figure 3.2: transactions labeling
Figure 3.3: The three labeled transactions
After running the test for 10 minutes and processing more than 117.000 transactions, FaDO, after labeling 3 transactions with amount > 100.000 as normal didn’t flag anymore transactions with amount > 100.000 as a possible fraud as shown in figure [3.4]. So in this case, false positives equal zero. We can approximately counts how many transactions with amount > 100.000 FaDO did not flagged them by subtracting (number of flagged transactions from number of transactions).
117208 - 116744 + 3(the three transactions which passed to layer3 and were labeled) = 461 transactions
Results 21
Discussion & Analysis 22
4 Discussion & Analysis
4.1 Analysis
4.1.1 Comparing the KPIs Of FADO to a fixed Rule
Fixed Rule
We consider the fixed rule amount > 1000
and the true label is almost random but with associating a country which is in this case ’Italy’ with increase fraud rates and run the script for 1.000.000 transactions.
It takes 4.122 seconds to execute which means it processes 242585.6 transactions per second.
This run results in :
The rule alarms on 100021 out of 1000000 times with 2566 fraudulent TXs The rule detected a total value of $ 10870007 out of $ 12291771 fraud And the KPI’s in table[4.1].
FADO
In FADO we implemented the KPI’s test but only with using artificial labels since FaDO still needs around 3 months of work to be ready for the production phase and this is out of the scope of this thesis. In the current case, we still did not use the cloud based system and the expert system for layer 1 and layer 2 to filter transactions.
The true label is set to be almost random but with associating a country which is in this case ’Italy’ with increase fraud rates. We let FaDO ran for 10 minutes with computational
Discussion & Analysis 23
efficiency equals to 420 TXs/Sec and processing more than 280 thousands transactions as shown in figure [4.1].
Figure 4.1: FaDO KPI’s test
FaDO alarms on 274376 out of 289953 times with 741 fraudulent TXs The rule detected a total value of $ 3939238 out of $ 3945030 fraud And the KPI’s in table [4.1].
Table 4.1: KPI’s.
TPs FPs TNs FNs Recall Precision Simple Rule 243 99778 897656 2323 9.469% 0.24%
FADO 722 273654 15558 19 97.44% 0.26%
Table 4.2: KPI’s.
computational efficiency label efficiency Simple Rule 242585.6 txs/sec 10%
Discussion & Analysis 24
4.2 Discussion
By looking at the KPI’s and also taking into consideration that this is a raw implemen-tation of FaDO, FaDO performance is better with a recall greater than 97% while the sample rule score only 9.469%.
For the precision, both score very low but this is not the real score for FaDO since the false-positive rates will be handled by the layers when an existing cloud based filter and another expert system are used. So this result is only for this raw implementation and it will get much better when everything is done and external filters are used.
There is a huge difference in the computational efficiency and that is the result of FaDO being used as a web-based tool to visualize its features and capabilities but in real tasks, FaDO will be used in a multi-threaded language which will increase its computational efficiency. On the other hand, the fixed rule was used in a ready-made dataset and it did not need to wait for real-time transactions to be generated.
Conclusion and future work 25
5 Conclusion and future work
5.1 Conclusion of the work
The need for an efficient real-time fraud detection algorithm is raising together with modern payment systems. On the other hand, detecting frauds while rising many false alarms is costly and it rather costs more money than it saves so the focus needs to be on detecting as many as possible frauds without raising many false alarms. FaDO looks promising and in this task, it implements a semi-supervised algorithm that only needs a small portion of the data to be labeled. In this task, FaDO was implemented to work as a web-based tool with multiple visualizations and filters that give a clear vision and better control for the experts to use. React framework was used and it gives a good efficiency when processing and updating the data plus it has a good structure with multiple components to separate the work and keep it clean. Moreover. native JavaScript was great for the dynamic functions that were used in multiple areas in the project. On the other hand, VUE framework which we used for around 70% of the project before re-implementing the whole thing using REACT was also a good and simple tool but maybe with less efficiency than React and also with less popularity which may affect the project in the future.
5.2 Future work
Implementing FaDO using JavaScript is a great way to give a nice prototype of FaDO with a good visualization for the user and easy control over all the tools but JavaScript in a single-threaded language which visualizations and related functions that need to run in parallel with transactions processing could affect the number of processed transactions per second. So for that reason, I think implementing FaDO in a multi-threaded language would be more efficient and I think that what will happen when FaDO gets used in real work. Furthermore, Fado is promising and it needs to be tested in a real dataset by the hand of experts to test its performance in the real data.
Bibliography 26
Bibliography
[1] R. J. Bolton and D. J. Hand, “Statistical fraud detection: A review,” Statistical science, pp. 235–249, 2002.
[2] K. J. Leonard, “Detecting credit card fraud using expert systems,” Computers & industrial engineering, vol. 25, no. 1-4, pp. 103–106, 1993.
[3] V. Chandola, A. Banerjee, and V. Kumar, “Survey of anomaly detection,” ACM Computing Survey, vol. 41, no. 3, pp. 1–72, 2009.
[4] E. Sherman, “Fighting web fraud.,” Newsweek, vol. 139, no. 23, 32B–32B, 2002. [5] M. Goldstein and S. Uchida, “A comparative evaluation of unsupervised anomaly
detection algorithms for multivariate data,” PloS one, vol. 11, no. 4, e0152173, 2016. [6] E. Brunet, “Swish, the secret swedish fintech payment company created by nordic
banks and used by 50% of swedes. . .,” Medium. url: https://medium. com/@ etiennebr/swish-the-secret-swedish-fintechpayment-company-created-by-nordic-banks-and-used-by-50-ofswedes-cfcf06f59d6f (visited on 04/17/2018),
2017.
[7] K. Pelckmans, “Fado: A deterministic detection/learning algorithm,” arXiv preprint arXiv:1711.02361, 2017.
[8] M. Verkerken, “Monitoring financial transactions,” Fadolife.files.wordpress.com, 2018.
[9] S. Stone, “E-commerce can expect nearly $7 billion in chargebacks in 2016,” Chargeback. com, 2016.
[10] E. Vuitton, “E-commerce payment fraud outlook 2017-2020.,” Chargeback. com, 2014.
Appendices 27
Appendices
.1 The Design OF React Implementation
This project has multiple components and it was based on functional programming. Besides that the dynamic parts of it were implemented in JavaScript native to give it more freedom to be used in different parts of the website and to make it easier to read through.
.1.1 Header
One component is holding the header and the navbar and even inside this component, multiple branches serve every menu item. All the menu items except EXTRA still do not have real functionality yet but EXTRA works to show the transactions visualizations window and KPI’s window.
.1.2 Layers
Another component which called layers holds the biggest part of the code and has multiple files and branches inside such as all layers, functions, popup windows, and Charts.
Layer
There is one component for each layer that holds the whole structure of the layer and receives data from the functions and it is also the parent of other components like charts and popup windows.
functions
It is the fundamental folder that has multiple files with different functions that serve to generate transactions and implement FaDO and do most of the functions in the website.
Popup Windows
Multiple components that serve each layer with a popup window with unique functions and visualizations depend on the need of each layer.
Appendices 28
Charts
![Figure 1.1: Different anomaly detection modes depending on the availability of labels in the dataset [5]](https://thumb-eu.123doks.com/thumbv2/5dokorg/5530052.144285/9.892.187.711.382.769/figure-different-anomaly-detection-depending-availability-labels-dataset.webp)