Camera-based sleepiness detection
Final report of the project SleepEYE
ViP publication 2011-6
Authors
Carina Fors, VTI Christer Ahlström, VTI Per Sörner, Smart Eye Jordanka Kovaceva, Volvo Cars Emanuel Hasselberg, Smart Eye
Martin Krantz, Smart Eye John-Fredrik Grönvall, Volvo Cars
Katja Kircher, VTI Anna Anund, VTI
Preface
SleepEYE is a collaborative project between Smart Eye, Volvo Cars and VTI (the
Swedish National Road and Transport Research Institute) within the competence centre
Virtual Prototyping and Assessment by Simulation (ViP). The main objectives of the
project were:
Development and evaluation of a low cost eye tracker unit. Determination of indicator thresholds for sleepiness detection.
The project started in the end of 2009 and ended in 2011. It was financed by the compe-tence centre Virtual Prototyping and Assessment by Simulation (ViP).
Participants from Smart Eye were Martin Krantz, Per Sörner and Emanuel Hasselberg. Participants from Volvo Cars were John-Fredrik Grönvall, Jordanka Kovaceva and Håkan Gustafsson.
Participants from VTI were Anna Anund, Carina Fors, Christer Ahlström, Katja Kircher, Beatrice Söderström, Håkan Wilhelmsson, Mikael Bladlund, Fredrik Gustafsson, Anders Andersson and Sara Nygårdhs.
Kenneth Holmqvist (Lund University), Torbjörn Åkerstedt (Stockholm University) and Lena Nilsson (ViP Director) have reviewed the report and provided valuable feedback. Thanks to all of you who have contributed to this project.
Linköping, September 2011
Quality review
External peer review was performed on 26 June 2011 by Kenneth Holmqvist, Lund University and on 9 July 2011 by Torbjörn Åkerstedt, Stockholm University. Carina Fors has made alterations to the final manuscript of the report. The ViP Director Lena Nilsson examined and approved the report for publication on 16 November 2011.
Table of contents
Executive summary ... 5
1 Introduction ... 7
1.1 Aims and limitations ... 8
1.2 Related publications ... 8
2 Driver sleepiness ... 9
2.1 Indicators ... 10
2.2 Algorithms and fusion of indicators ... 11
2.3 Conclusions and recommendations for SleepEYE ... 12
3 Development of the Smart Eye embedded camera system ... 14
3.1 Cost optimisation ... 14
3.2 Implementation of driver impairment indicators ... 16
4 Experiments ... 17
4.1 Design and procedure ... 17
4.2 Field experiment ... 19
4.3 Simulator experiment ... 21
4.4 Database ... 22
5 Evaluation of the Smart Eye embedded camera system ... 24
5.1 Method ... 24
5.2 Results ... 25
6 Determination of sleepiness thresholds ... 37
6.1 Method ... 37
6.2 Results and analysis ... 45
7 Discussion and conclusions ... 56
7.1 The Smart Eye embedded camera system ... 56
7.2 Sleepiness thresholds and classifier ... 57
7.3 Contribution to ViP ... 58
7.4 Conclusions ... 59
References ... 60
Appendices
Appendix A Eye movement based driver distraction detection algorithms
Appendix B Karolinska sleepiness scale
Camera-based sleepiness detection
by Carina Fors1, Christer Ahlström1, Per Sörner2, Jordanka Kovaceva3, Emanuel
Hasselberg2, Martin Krantz2, John-Fredrik Grönvall3, Katja Kircher1 and Anna Anund1
1Swedish National Road and Transport Research Institute, VTI
2Smart Eye
3Volvo Cars
Executive summary
The aims of the study were, in brief: 1) to develop and evaluate a low cost 1-camera unit for detection of driver impairment and 2) to identify indicators of driver sleepiness and to create a sleepiness classifier for driving simulators.
Two literature reviews were conducted in order to identify indicators of driver sleepi-ness and distraction. Three sleepisleepi-ness indicators – blink duration, blink frequency and PERCLOS – were implemented in the camera system.
The project included two experiments. The first was a field test where 18 participants conducted one alert and one sleepy driving session on a motorway. 16 of the 18 parti-cipants also participated in the second experiment which was a simulator study similar to the field test.
The field test data was used for evaluation of the 1-camera system, with respect to the sleepiness indicators. Blink parameters from the 1-camera system was compared to blink parameters obtained from a reference 3-camera system and from the EOG. It was found that the 1-camera system missed many blinks and that the blink duration was not in agreement with the blink duration obtained from the EOG and from the reference 3-camera system. However, the results also indicated that it should be possible to improve the blink detection algorithm since the raw data looked well in many cases where the algorithm failed to identify blinks.
The sleepiness classifier was created using data from the simulator experiment. In the first step, the indicators identified in the literature review were implemented and evaluated. The indicators also included driving and context related parameters in addition to the blink related ones. The most promising indicators were then used as inputs to the classifier.
The final set of indicators were an estimated KSS value that was based on the value the
driver reported before the driving session (KSSestSR), standard deviation of lateral
position (SDLP) and fraction of blinks > 0.15 s (fracBlinks, for EOG based and 1-camera-based). An optimal threshold for discriminating between KSS above and below 8 was determined for each indicator. The performances were in the range of 0.68–0.76. Two decision trees based on the selected indicators were created: one using the
fracBlinksEOG and one using fracBlinks1CAM. The performances of the two trees were
0.82 and 0.83 respectively (on the training dataset), i.e., the overall performance of the EOG based and the 1-camera-based classifier were similar, although individual
differences could be seen. The performance decreased to 0.66 when using a validation dataset from another study, which illustrates the difficulties in creating a generalized sleepiness classifier.
1 Introduction
Driver impairment caused by for example sleepiness, stress, visual inattention,
workload etc. needs to be predicted or detected in order to avoid critical situations and crashes. From a scientific point of view there is a need to find suitable indicators for detection or prediction of these driver states. Such indicators are also needed for evaluation of the effectiveness and usefulness of warning strategies and/or interfaces when such driver states have been identified.
In the long run and from an applied point of view, driver state indicators should be measured with the help of unobtrusive sensors. A camera-based system is an example of an unobtrusive sensor that can provide relevant information and also is suitable for driver applications. From an advanced camera-based system it is possible to obtain information on for example head and gaze direction, eye lid opening and facial
expressions. In order for a vehicle mounted camera system to fulfil its purpose, it must meet automotive requirements in terms of reliability and crashworthiness and it must also be able to adapt to various light conditions and to a wide range of facial features and anthropometric measures. Advanced camera systems for head and gaze tracking are quite expensive and therefore not possible to use for consumer applications. Nor are they suitable to use in low-budget studies or non-controlled experiments where no test leader is present (e.g. naturalistic driving studies) since they often require manual adjustments and monitoring.
The increasing interest in measuring driver state raises the need for a cost efficient camera-based system that can be mass-produced and used in safety systems or for research purposes such as large-scale field operational tests or in low-end simulators. A low cost camera-based system can be installed and used in most kinds of driver behaviour studies. This will not only increase the knowledge on driver behaviour but also facilitate comparisons of results from e.g. different driving simulators.
In order to use a camera-based system for detection or prediction of driver impairment, indicators of different driver states must be defined and implemented. Measuring driver state is a complex task since indicators often are influenced by many factors. For example, partly closed eyes may be related to sleepiness, but it could also be caused by heavy sunlight or a blowing fan directed to the face. Identifying robust indicators is thus essential. A way of increasing the reliability is to fuse information from several
indicators into a detector or classifier. Such a classifier can be used in simulator studies that e.g. aim to evaluate the effectiveness of different warning interfaces or to study driving behaviour under the influence of some impairment. By using a classifier, driver state can be determined in an objective and identical way. Furthermore, the use of a well-defined classifier allows for comparisons of results from different studies. A reliable classifier is thus a valuable research tool, particularly for simulator studies, since a driving simulator provides a safe environment for studying driver impairment. In the present study, the main focus was on driver sleepiness. Driver distraction was considered to some extent.
1.1
Aims and limitations
The main aims of the project were to:
Develop a low cost data acquisition unit for head and eye tracking based data. Identify feasible indicators (camera-based and other) of driver sleepiness and
distraction.
Implement and validate camera-based indicators of driver sleepiness in a field setting using an instrumented car.
Investigate the performance of the indicators as sleepiness detectors.
Develop a sleepiness classifier for driving simulators (that can be used in future studies that aim to evaluate e.g. sleepiness warning interfaces).
A secondary aim was to create a database with driver impairment data (sleepiness and distraction) from both field and simulator tests. The database is intended to be used for further analyses in future projects.
The project included a literature review on indicators both for driver sleepiness and distraction. The subsequent work was then limited to include implementation and evaluation of sleepiness indicators only, since the project would be too extensive
otherwise. In order to evaluate the identified and implemented sleepiness indicators, two experiments were conducted: one on a real road using an instrumented car and one in a driving simulator. Both experiments followed the same procedure. They were
principally designed as sleepiness experiments with one alert condition (daytime) and one sleepy condition (at night), but in the end of the driving session a distraction event occurred, which can be used in future analyses on driver distraction. The experimental design was also well suited for simulator validation, since the same subjects participated in both experiments. Although simulator validation was not a part of the present study, some events and a questionnaire were added to the experiment in order to provide a useful dataset for future simulator validation.
1.2 Related
publications
In addition to the present report the project has resulted in the following publications: Ahlstrom C, Kircher K: Review of real-time visual driver distraction detection
algorithms, 7th International Conference on Measuring Behaviour, Eindhoven,
Netherlands, 2010.
Ahlstrom C, Kircher K, Sörner P: A field test of eye tracking systems with one
and three cameras, 2nd International Conference on Driver Distraction and
Inattention, Gothenburg, Sweden, 2011.
The first publication is based on the literature review on distraction indicators that was done within the project. The complete review can be found in Appendix A. In the second publication, the 1-camera system is compared with the 3-camera system with respect to gaze parameters. Analysing gaze parameters was beyond the scope of the project but nevertheless very interesting and relevant when it comes to identification of driver impairment.
2 Driver
sleepiness
During the last decade there has been an increased focus on driver fatigue and the risk of driving under fatigue or sleepiness.
Driver fatigue and sleepiness (or drowsiness) are often used interchangeably (Dinges, 1995). Fatigue refers to an inability or disinclination to continue an activity, generally because the activity has, in some way, been going on for “too long” (Brown, 1994). Fatigue is often considered to be a generic term, and sleepiness is one of the major sub-components. Most often they should be considered separate, even though they are related to the same concept.
Fatigue is defined as a global reduction in physical or mental arousal that results in a performance deficit and a reduced capacity of performing a task (Williamson, Feyer et al., 1996). Sleepiness on the other hand is defined as the physiological drive to sleep (Dement and Carskadon, 1982). The reason for sleepiness is more or less related to time being awake, time of the day and hours slept last 24 hours. The reasons for fatigue could be several, from physical, perceptual, boredom to apathy (Desmond, Matthews et al. 1997). A person can be fatigued without being sleepy, but a person cannot be sleepy without being fatigued. The countermeasure for sleepiness is only sleep. The counter-measure for fatigue could be other. This is why they need to be separated.
There are lots of studies focusing on selection of the most promising indicators and algorithms to detect or predict driver sleepiness. Most of them are based on data from driving simulators, but recently also data from driving under real conditions are used. There are also several approaches used in order to classify indicators or fuse indicators in order to have a high degree of both sensitivity and specificity.
However, there are still problems to solve. Among the most critical ones are the individual differences between drivers, both in alert and especially when driving in a sleep deprived condition. Another critical issue is the lack of a reference method (ground truth) that is possible to use also in an environment with a high risk for
artefacts. The car industry has an interest in designing driver support systems addressed to sleepy drivers and from their perspective the indicators used need to be captured with help of unobtrusive, reliable and cost efficient sensors. In this area the development is going fast, but still the sensors are not mature enough.
A literature review on sleepiness indicators and classifiers was carried out in order to obtain a basis for the selection of indicators and to get ideas on how to combine the indicators into a classifier. The literature search was done by VTI Library and Information Centre. Search words were:
sleepiness/fatigue/drowsiness driver/driving
indicators/algorithms/measurements/blinking/eye-based/EOG/driving behaviour/lateral position/steering wheel reversal rate/thresholds.
Five databases were searched: PubMed, TRAX, ITRD, TRIS and Scopus. Only references from 2005 or later were included in the literature search.
2.1 Indicators
Several different measures and indicators of sleepiness are described in the literature. Physiological measures such as EEG and EOG are often used in research, but they are not feasible for commercial use because they are too obtrusive or impractical. Camera-based systems can provide several measures of sleepiness, for example blink behaviour and nodding, and they are frequently reported in literature. Camera-based detection systems are suitable for driving and there are a number of commercially available devices (Wright, Stone et al., 2007).
Another type of indicators is driving behaviour measures, including e.g. lateral position, steering wheel movements and speed. Context information, such as time of the day and trip duration, have also been suggested as indicators of sleepiness (Boverie, Giralt et al., 2008). Table 1 summarizes indicators used for sleepiness detection.
Table 1 Indicators used for sleepiness detection. Type of indicator Measures
Eye activity (camera) Blinking frequency, blink duration, PERCLOS, fixation duration, eyelid distance, saccadic peak velocity
Head/face activity Nodding frequency, face position, yawn frequency, facial actions Physiology EEG-based measures, EOG (blink frequency, blink duration,
PERCLOS, closing duration, opening duration, fixation duration, blink amplitude, delay of lid re-opening, lid closure speed, blink amplitude/peak closing velocity, saccadic peak velocity), heart rate based measures, head motion, force applied to steering wheel Driving behaviour Steering wheel angle (reversal rate, std, energy in 0-0.4 Hz band),
lateral position (mean, std), speed variability, time to line crossing, lanex
Contextual information Trip duration, time of the day, hours of sleep/sleep deprivation
What indicators to use depend on the application. Physiological indicators and driving behaviour measures are feasible in controlled studies, while camera-based indicators might be the best choice for commercial systems. In a review on vehicle measures for prediction of sleepiness, standard deviation of lane position and steering wheel move-ments are stated as the most important (vehicle) measures (Liu, Hosking et al., 2009). A limitation of these measures is that they are also related to vehicle type, driver experi-ence, geometric characteristics, condition of the road etc. (Bergasa, Nuevo et al., 2006). Sandberg has investigated the use of several different driving behaviour signals (varia-bility indicators based on lateral position, yaw, steering wheel angle and derived measures such as standard deviation of lateral position, time to line crossing etc.) and concluded that these indicators basically contain the same information (Sandberg, 2008). Schleicher et al. have investigated several oculomotor/EOG indicators of sleepiness and concluded that blink duration, delay of lid re-opening, blink interval (frequency), and lid closure speed are the best indicators (Schleicher, Galley et al., 2008). It was also found that the pattern of fixations changed with increased sleepiness, so that the proportions of very short (< 150 ms) and overlong (> 900 ms) fixations increased. Bergasa et al. have investigated camera-based indicators and found that the
most important measures are fixed gaze, PERCLOS and blink duration (Bergasa, Nuevo et al., 2006). Åkerstedt and colleagues have studied the responsiveness of several
sleepiness indicators to sleep loss, time of day and time on task in a simulator study (Åkerstedt, Ingre et al., 2009). Clear main effects of time of day and time on task were found. The most sensitive indicators were subjective sleepiness, standard deviation of lateral position and EOG measures of eye closure (duration, speed and amplitude). EEG measures and line crossings were less responsive. The authors have also studied
individual differences and found that they exceed the fixed effects of the physiological indicators, but not those of the standard deviation of lateral position and subjective sleepiness. Individual variations in eye activity are discussed by Yang et al., who elucidate the fact that some drivers might look awake, although their driving perfor-mance is severely deteriorated (Yang, Mao et al., 2009). Eye activity may thus be less sensitive as a sleepiness indicator. Individual variations imply the need of combining several indicators.
2.2
Algorithms and fusion of indicators
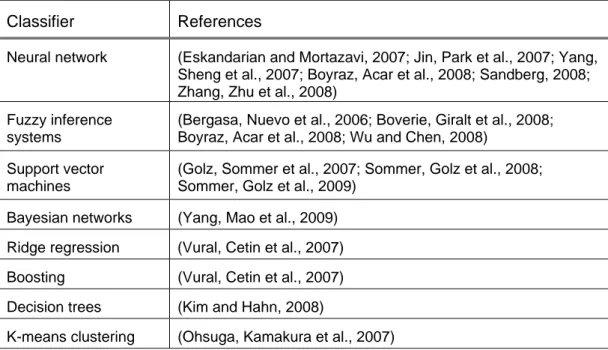
A majority of the recent literature on sleepiness monitoring and detection focus on how to combine and fuse several sleepiness related indicators into one single output that corresponds to driver state. Table 2 summarizes the classifiers that have been used in different studies.
Table 2 Classifiers used for sleepiness detection. Classifier References
Neural network (Eskandarian and Mortazavi, 2007; Jin, Park et al., 2007; Yang, Sheng et al., 2007; Boyraz, Acar et al., 2008; Sandberg, 2008; Zhang, Zhu et al., 2008)
Fuzzy inference systems
(Bergasa, Nuevo et al., 2006; Boverie, Giralt et al., 2008; Boyraz, Acar et al., 2008; Wu and Chen, 2008)
Support vector machines
(Golz, Sommer et al., 2007; Sommer, Golz et al., 2008; Sommer, Golz et al., 2009)
Bayesian networks (Yang, Mao et al., 2009) Ridge regression (Vural, Cetin et al., 2007)
Boosting (Vural, Cetin et al., 2007)
Decision trees (Kim and Hahn, 2008)
K-means clustering (Ohsuga, Kamakura et al., 2007)
There is no evidence that a certain classifier performs better than another in sleepiness applications. Boyraz and colleagues (Boyraz, Acar et al., 2008) have compared a neural network approach with a fuzzy inference system and it was concluded that there was no significant difference between the two classifiers.
Most authors report that their classifiers correctly identify more than 80% of the occur-rences of sleepiness. The rate of correct identifications depends heavily on the amount
of data, the selection of training and evaluation data sets and the reference method used. The reported performance should thus be interpreted cautiously.
Several different kinds of reference data for training and validation of a classifier are reported in literature: Karolinska sleepiness scale (KSS) (Berglund, 2007; Shuyan and Gangtie, 2009; Sommer, Golz et al., 2009), subjective/video rating (Eskandarian and Mortazavi, 2007; Ohsuga, Kamakura et al., 2007; Boyraz, Acar et al., 2008; Schleicher, Galley et al., 2008; Sommer, Golz et al., 2008; Zhang, Zhu et al., 2008), physiological data (EEG and/or EOG) (Boverie, Giralt et al., 2008; Shuyan and Gangtie, 2009), simulated drowsiness behaviour (Bergasa, Nuevo et al., 2006) and estimated sleepiness level based on trip duration and falling asleep events (Vural, Cetin et al., 2007).
Interesting and detailed papers on classifiers for sleepiness detection are for example Bergasa et al.’s article on a fuzzy inference system using camera-based measures such as PERCLOS and blink duration (Bergasa, Nuevo et al., 2006) and Boyraz et al.’s article where camera-based measures are combined with driving behaviour measures and fed into two different classifiers (Boyraz, Acar et al., 2008). Vadeby and colleagues have used Cox proportional hazard models in order to study the relationship between different indicators of sleepiness and lane departure events in a driving simulator (Vadeby, Forsman et al., 2010). A combination of the ratio of blink amplitude and peak closing velocity of the eyelid, standard deviation of lateral position and lateral
acceleration relative to the road was found to be the most sensitive predictor. Worth mentioning, although not camera-related, is a study by Sandberg, where model based information (time of day etc.) was used in combination with an optimized variability indicator of driving behaviour (based on yaw angle) (Sandberg, 2008). It was found that the accuracy of sleepiness detection was greatly improved when the two indicators were combined using a neural network, compared to using only one of the indicators.
2.3
Conclusions and recommendations for SleepEYE
Almost all recent literature on sleepiness detection emphasizes the fact that a combina-tion of several different indicators are needed in order to be able to classify the level of sleepiness, because of the complex nature of signs of sleepiness and the great variation among individuals.
Several kinds of sleepiness indicators, of which some seem more promising than other, have been suggested in the literature. Given the conditions and requirements in
SleepEYE, where data from the 1-camera system and from the vehicle will be available, the following parameters were suggested to be looked at:
Blink duration PERCLOS Blink frequency
Lateral position variation Trip duration
Time of day.
Moreover, other interesting indicators are lid closure speed and fixation duration. However, given the technical limitations of the camera system, these indicators are probably not possible to obtain.
In order to combine the indicators, a classifier based on if-then rules or similar (e.g. a decision tree or fuzzy logic) is suggested. Such a classifier is transparent, in contrast to the black box approach of many other classifiers, i.e. the logic statements describing the classification are traceable and comprehensive. This will allow for a fairly simple description of the algorithm as well as for the re-use and re-implementation of the algorithm in other ViP projects, which is one of the goals in this project.
3
Development of the Smart Eye embedded camera system
3.1 Cost
optimisation
In order to minimize cost per unit, a self-contained, easy-to-install and automotive compliant embedded 1-camera system was designed that can run either as a stand-alone tracker or function as a camera to a PC-based system.
The development of the 1-camera system began before the present project started. Therefore, some parts of the design and implementation described in Section 3.1 have been done within other projects.
3.1.1 Requirements
In addition to being cost efficient the camera system also had to fulfil certain criteria in order to function in a driving situation. The following list of requirements was drawn up
for the camera system1:
Track head, eye and eyelid in real time.
Day and night time operation, sunlight suppression. Capable of eyeglass reflex reduction.
Fully automatic stand-alone operation.
Deliver sampled-down real time video of face and eye clips. Mounting and cabling designed for quick and simple installation Unobtrusive to driver.
Accommodate both car and truck geometry, distance to face max 1m. CAN interface for low bandwidth control and tracking results.
Ethernet interface for high bandwidth control and tracking results. Use power directly from an unfiltered 12 or 24 VDC vehicle system. Max power consumption of 6 W.
Automotive EMC compliant. IR safety compliant.
Withstand vehicle vibrations and mechanical shocks. No dangerous fault modes.
Automotive temperature range. No out-gassing materials. Rational production.
All requirements were fulfilled. The hardware and software are further described below. 3.1.2 Hardware
The embedded system was built around an existing prototype camera and signal
processing board supplied by Visteon (Visteon Inc., the US). This board had previously been used by Smart Eye in earlier projects, and was proven to be a feasible platform. In order to meet the project deadlines and reduce risk, it was decided that no changes should be made to this component although the system as a whole would be larger than
1
necessary and include some redundant circuitry. The mechanical outline of the board thus determined much of the final package size.
Two companion circuit boards were designed: one interface / power supply board and one dual IR illuminator board. These were sandwiched with the camera and processing board. A minimal-envelope matte black moulded plastic box consisting of two sym-metrical halves and one rectangular IR-transparent window was designed. The box mounts to the vehicle with two bolts mounted through the top of the package.
In order to adapt to the different nominal distance between camera and driver’s face in cars and trucks, two different focal length lenses were used. When the lenses were installed, they were focused to the respective nominal face distance and then fixed permanently in place. The corresponding lens and camera parameters are configured via software. IR filtering was integrated in the optical path.
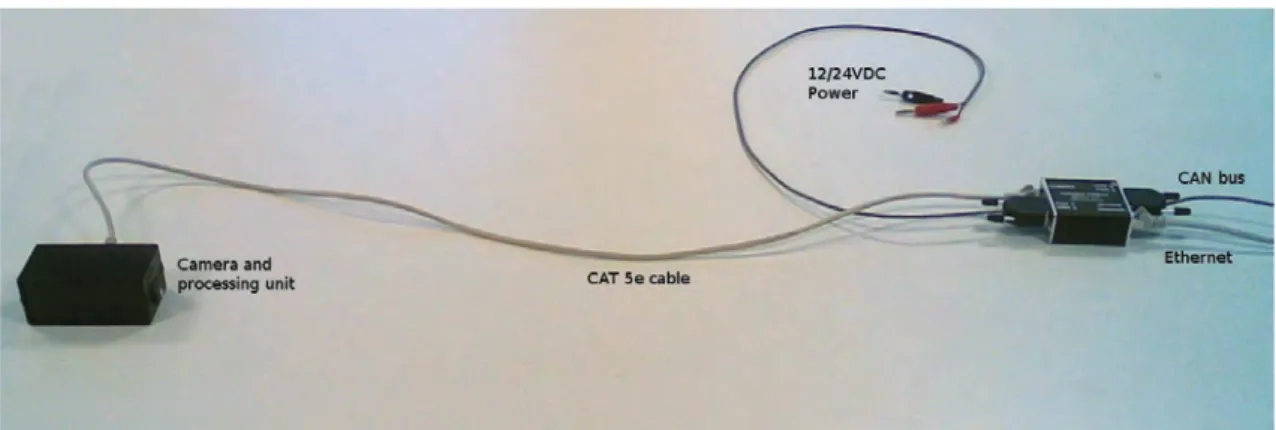
Power, CAN and Ethernet connections are made via a single RJ45 connector on the back side of the package. This in turn connects via a standard shielded TP-cable to a remote splitter box, where separate power, CAN and Ethernet connectors are available, Figure 1.
Testing was done at Volvo’s EMC lab to verify that electromagnetic emission levels were in compliance with the relevant norms.
Figure 1 The Smart Eye embedded camera system. The camera unit is approximately 10 cm wide.
3.1.3 Software
Apart from porting and optimizing Smart Eye’s gaze tracking software to the embedded platform, several other software tools also had to be developed, for example support for remote firmware update, logging and diagnostics, full resolution video logging and off-line tracking as well as production tools such as fixed pattern noise calibration.
Since the experiments were designed to capture full resolution video and tracking was done later off-line, frame loss due to real-time processing bottlenecks had to be modelled artificially.
The sampling frequency of the camera system is 60 Hz. The software version that was used in SleepEYE was maud_20110303_0_01_v1021.
3.2
Implementation of driver impairment indicators
The eye blink based sleepiness indicators identified in the literature review and listed in Section 2.3 were implemented for the embedded 1-camera system. The focus was primarily on blink duration, but PERCLOS and blink frequency output signals were also implemented.
3.2.1 Definition of blink duration
The absolute eyelid opening distance is dependent on a number of factors, such as e.g. head pose, vertical gaze direction, light conditions and interior climate. A complication is also that some individuals do not close their eyes completely when blinking. It is thus not easy to define a generally valid eyelid distance threshold.
The target definition that was settled on for the 1-camera system was to define the blink duration as the time during which the upper eyelid covers the centre of the pupil. This takes both eyelid and eye structures into account. For blink duration the priority was to properly detect the length of the eye blinks at the cost of potentially dropping hard-to-detect blink events.
3.2.2 Implementation
Initially, an effort was spent on improving the signals from the underlying low-level detectors. This involved improving head tracking and eye clip positioning as well as optimizing the low-level detectors for basic structures such as eyelids, iris and corneal reflections.
Subsequently, the per-frame low-level signals were fed into an adaptive state machine for detection of blink events in the time domain.
4 Experiments
Two experiments that aimed at collecting data for the camera evaluation and for the development of a sleepiness classifier were conducted: one on a real road and one in a driving simulator.
4.1
Design and procedure
4.1.1 Experimental design
The experimental design is shown in Table 3. The participants conducted four driving sessions: real road alert, real road sleep deprived, simulator alert and simulator sleep deprived. The order of the driving sessions was the same for all participants, for practical reasons. The alert conditions were carried out in the late afternoon, while the sleep deprived conditions took place after midnight on the same (or actually the next) day. In the real road experiment, it was always daylight during the alert session and always dark during the sleep deprived session. In the simulator it was daylight in both sessions, since there was no darkness scenario implemented at the time of the
experiment.
Table 3 Experimental design. Driving
session Condition Time of day Light condition
1 Real road, alert 3:30–7:30 p.m. Daylight
2 Real road, sleep deprived 0:30–4:30 a.m. Dark
3 Simulator, alert 3:30–7:30 p.m. Daylight
4 Simulator, sleep deprived 0:30–4:30 a.m. Daylight
The study was ethically approved by the regional ethical committee in Linköping, registration number 2010/153-31. Permission to conduct driving sessions with sleep deprived drivers on public roads between midnight and 5:00 a.m. was given by the government, registration number N2007/5326/TR.
4.1.2 Participants
Twenty participants were recruited to the study. Half of them were women. The participants were recruited from the Swedish register of vehicle owners. The main inclusion criteria were:
Between 30 and 60 years old No glasses
Healthy
Normal weight No shift workers
The reason for excluding drivers with glasses was that a homogeneous group with regard to the eye tracking systems was desired.
Unfortunately, some subjects cancelled their participation at short notice and it was not possible to replace all of them by new participants. In total, eighteen subjects partici-pated in the field study and sixteen of them participartici-pated in the simulator study. Eight of the participants were women. One participant was younger than 30 years and one had glasses. The subjects were compensated 3,000 SEK for their participation.
4.1.3 Procedure
One to two weeks before the experiment the participants were mailed information and sleepiness and wakefulness forms to be filled in the three nights and two days
immediately prior to the experimental day. The participants were instructed to sleep at least seven hours per night the three nights prior to the test.
Two subjects participated each experimental day. The first participant arrived at 2 p.m. and the second at 4 p.m. When the participants arrived they were given written and oral information about the test and were then asked to fill in an informed consent form and a responsibility form. They also had to show their driving license and to do a breath alcohol test. The test leader then applied electrodes for physiological measurements. Each participant accomplished two driving sessions on each test occasion: the first was the alert condition and the second was the sleep deprived condition, Table 4.
Table 4 Start and end times for the driving sessions. Driving session Start End
Participant A alert 3:30 p.m. 5:15 p.m. Participant B alert 5:45 p.m. 7:30 p.m. Participant A sleep deprived 0:15 a.m. 2:00 a.m. Participant B sleep deprived 2:45 a.m. 4:30 a.m.
Each driving session lasted for about 90 min. The time between the sessions was spent at VTI, where the participants could e.g. read or watch TV. The participants were served dinner after the first driving session and fruits and sandwiches during the night. They were not allowed to drink any caffeine containing beverages from 1 p.m. on the experiment day.
The participants were instructed to drive as they would do in “real life”. While driving they were not allowed to speak, listen to the radio or do anything else that would counteract their sleepiness. During each driving session the participants rated their sleepiness level on the 9-grade Karolinska Sleepiness Scale (KSS) every five minutes (Åkerstedt and Gillberg, 1990), see Appendix B.
After the sleep deprived session, the electrodes were removed and the participants were sent home by taxi.
4.1.4 Tasks while driving
The participants were instructed to do three tasks during each driving session: Drink water from a bottle.
Drive close to the right line marking.
Drive at a constant speed of 100 km/h without looking at the speedometer. Before the first driving session, the participants were given a written instruction on how to do the tasks. The tasks were done in the end of each driving session, both in the field test and in the simulator. In the field test, the test leader told the participant when to do the tasks. In the simulator, a text was shown on the simulator screen when it was time to do the tasks.
The aim of the water drinking task was to distract the driver and to get “disturbed” camera data. The aim of the two other tasks was to collect data for simulator validation (not to be analysed in this project).
4.1.5 Data acquisition
Two Smart Eye camera systems were installed in the car and the simulator: the 1-came-ra embedded system that was to be evaluated and a 3-came1-came-ra Smart Eye Pro (sampling frequency 60 Hz) which was used as a reference system providing video-based ground truth. The 1-camera system was mounted as low as possible behind the steering wheel, in the car on top of the cover of the (adjustable) steering column (Figure 2, lower left), and in the simulator at the lower edge of the main instrument. The 3-camera system was mounted on top of the dashboard along with two IR-flashes (Figure 2, lower photos) and synchronized to the 1-camera exposure pulse so that by slightly shifting its own time of illumination and exposure, the respective illumination subsystems would not interfere with each other. The positions of the cameras relative to the car were calibre-ted. Both camera systems were set up to simultaneously record time-stamped raw video to hard disk drives, using lossless compression. The recordings from the test drives were collected and subsequently processed off-line.
Vehicle data, such as speed and lateral position, was logged with 10 Hz from the car as well as from the simulator. In the field experiment, video films of the vehicle frontal and rear views, the driver's face and feet were recorded.
Physiological data – EEG, EOG and ECG – was recorded by a Vitaport 3 (TEMEC Instrument B.V., The Netherlands) with 256 (EEG and ECG) or 512 Hz (EOG). All data acquisition systems were connected to each other in order to facilitate synchronization of data.
4.2 Field
experiment
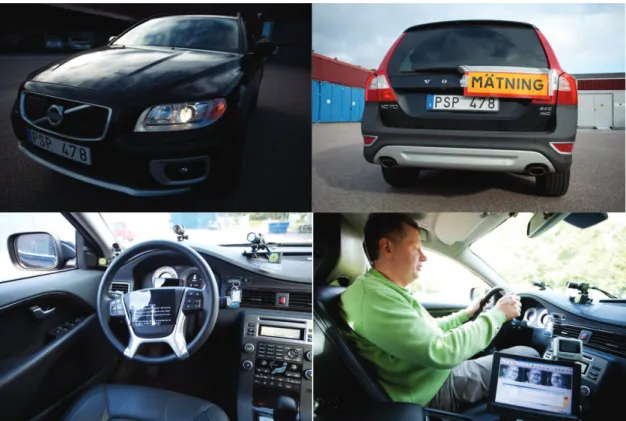
The car used in the experiment was a Volvo XC70 with an automatic gearbox, Figure 2. During the tests, there was a sign on the rear of the car with the text “Mätning”.
The test route in the field test was the E4 motorway from Linköping (exit 111) to Gammelsta (exit 128) and back, Figure 3. The length of test route was approximately 2 x 79 km and it took about 90 min to drive. The posted speed limit was 110 km/h
during the whole route, except for a road section of 750 m in Norrköping, where the posted speed limit was 90 km/h.
Figure 2 Upper left: The instrumented car. Upper right: The car had a sign “Mätning” on the rear. Lower left: Driver’s seat with the three cameras on the dashboard, the em-bedded camera on the steering column and the KSS scale on the steering wheel. Lower right: The screen that shows the driver’s face to the test leader. Photos: Katja Kircher.
Figure 3 The test was conducted at the motorway E4. The test route started at exit 111 in Linköping and the turning point was at exit 128 in Gammelsta.
Turning at exit 128 (Gammelsta) Start and end at
exit 111
A test leader was sitting in the front passenger seat. The car had dual command and there was a small screen in front of the test leader showing the driver’s face, so that the test leader could see if the participant closed his/her eyes. The test leader was
responsible for the safety and was prepared to take control of the vehicle if the driver became too sleepy. However, the intention was not to let the driver fall asleep, but to stop the driving session before the driver fell asleep. The test leader was also supposed to stop the driving session if the driver drove in an unsafe way, either because of sleepiness or of other reasons (e.g. exceeded posted speed limit). The participants were explicitly told to not exceed speed limits for safety reasons. They were also told that they were allowed to stop for a break if they felt it was necessary for their safety. If the driver chose to take a break, it was prescribed that the test leader would stop the driver from continuing to drive.
The KSS ratings that were reported by the driver every five minutes were written down by the test leader in a paper form.
4.3 Simulator
experiment
The simulator that was used in this study is VTI driving simulator III, Figure 4. The simulator is a moving base simulator with a 120 degrees forward field of view (VTI, 2011). The cabin is a Saab 9-3. In this experiment, the simulator had an automatic gearbox.
Figure 4 VTI driving simulator III.
In the simulator, a motorway similar to that between Linköping and Norrköping was used as a test route. Each driving session consisted of four laps on the same motorway section. The total length of the simulator test route was about 150 km and it took about 75–80 min to drive.
In the simulator scenario there were a few events in the beginning and in the end of the session. In the beginning there were three overtaking events where the test driver was supposed to overtake slow vehicles. There were two similar events in the end of the driving session. These events were intended to be used for (later) simulator validation. The main part of the driving session was intended to be used for analysis of sleepiness indicators and thus, interaction with other traffic was kept to a minimum. On average, every 7 minutes during the whole driving session, a car overtook the test driver. Half-way of the test route, the posted speed limit was changed to 90 km/h for 1 km, since there was a similar change of speed in the field test (there were actually two such
changes in the field test but only one in the simulator scenario in order to minimize influence from alertness-enhancing factors).
A test leader sat outside the simulator and monitored the driver via video and
loudspeakers/microphone. The test leader did not stop the driving session even if the driver fell asleep. The participants were informed that they could stop driving at any time if they, for example, felt sick.
4.4 Database
A database was created in order to provide an easily accessible dataset for the present project, but also to facilitate further analyses in future projects on e.g. simulator validation or driver impairments.
Driving data and physiological data were synchronized and merged into Matlab struct files. Some additional parameters were inserted in the dataset: KSS, flags indicating start, stop, lowering of speed limit and turning (field test), and blink duration calculated from the EOG (see also Chapters 5 and 6).
Smart Eye data were post processed and blink parameters, i.e. blink duration, blink frequency and PERCLOS, were computed according to Section 3.2. Smart Eye data from all simulator sessions and from the night sessions in the field were processed in bright pupil mode, while the field data from the daylight sessions were processed in dark pupil mode. Smart Eye data was stored in separate Matlab files, because of their large size. A common time stamp signal allowed for synchronization with the struct files containing driving and physiological data.
Unfortunately, there were some technical problems with the driving simulator resulting in sudden stops or absence of sound in nine driving sessions. A quality parameter was added to all simulator data files after the experiment was finished, in order to allow for quick removal of segments with simulator problems.
The parameters relevant for the present project are listed in Table 5. In total, the data-base contains approximately 30 parameters from the experimental vehicle, 20 para-meters from the simulator, 50 parapara-meters from the two camera systems and 10 physio-logical parameters.
Table 5 The database parameters relevant for the present project Parameter Description
Experimental vehicle
Odometer Distance driven
Driving simulator
Lateral position Distance to the centre of the road
Data quality Flag indicating data quality
1-camera system
Blink duration Blink duration
Blink frequency Blink frequency
PERCLOS PERCLOS
Availability Percentage of time when the system provides
eye tracking data. 3-camera system
Blink duration Blink duration
Blink frequency Blink frequency
Availability Percentage of time when the system provides
eye tracking data. Physiological
Blink duration Blink duration obtained from the EOG Ratings
5
Evaluation of the Smart Eye embedded camera system
The evaluation of the 1-camera system was done using data from the field test only, since the system is intended to be used commercially in ordinary vehicles. A real driving situation is expected to generate much more disturbances (varying light
conditions, head movements etc.) than a driving simulator, and therefore simulator data is inconvenient to use for this purpose.
5.1 Method
Evaluation of blink parameters is time consuming and difficult. Time consuming because the only ground truth is video recordings of the eye and difficult because the onset and end point of a blink is hard to define in an objective manner. In this study, two complementary approaches were chosen in order to gain some insight in the performance of the two camera systems:
1. Manual comparison of a one-minute video segment with data from the two camera systems and with data from EOG. This step mainly investigates the systems’ ability to detect blinks.
2. Comparison of blink parameters obtained via EOG and via the two camera systems. This step investigates how the blink frequency and the blink durations differ between the systems.
The data used in the manual comparison was picked out about 20 km from the starting point of the sleepiness test route. The one-minute segment with the highest eyelid quality in the 1-camera system in a five-minute time window was selected for analysis. The reason for selecting only a single minute per session for analysis is that video analysis is very time consuming. For each one-minute segment a video of the driver’s face was annotated manually and all blinks were noted. These blink occurrences were then compared with the blink detections from the two camera systems and the EOG (results in Section 5.2.2).
Blink frequency and blink durations from the entire sleepiness experiment were also compared (results in Sections 5.2.3 and 5.2.4). In this case, no ground truth was
available why the EOG and the two camera systems could only be compared with each other. In these analyses, the data were sliced in three different ways:
1. Distance: The blink parameters were calculated as aggregated values based on data from two-kilometre segments. This means that it is possible to investigate how the different parameters evolve with the distance driven.
2. KSS: The blink parameters were calculated as aggregated values based on KSS. This means that it is possible to investigate how the different parameters evolve with sleepiness.
3. Alert vs. sleep deprived: The blink parameters were calculated as aggregated values based on if the driver is sleep deprived. This means that it is possible to investigate how the different parameters change with sleep deprivation but it also reflects for example lighting conditions.
For the 1-camera system, blinks and blink duration were identified according to the definitions in Section 3.2. The blink complex detector in the 3-camera system defines blink duration as the time between 50% closing amplitude and 50% opening amplitude.
The observation window for the whole blink event is constrained in time, so very long eye closures may be missed.
Blink detection and blink durations extracted from the EOG were estimated with the LAAS algorithm (Jammes, Sharabaty et al., 2008). The algorithm low pass filters the EOG data, calculates the derivative and searches for occurrences where the derived signal exceeds a threshold and falls below another threshold within a short time period. If the amplitude of the (original, low-pass filtered) EOG signal in such a sequence exceeds a subject specific threshold, the sequence is assumed to be a blink. Blink duration is calculated at half the amplitude of the upswing and the downswing of each blink and defined as the time elapsed between the two.
Data from seventeen out of the eighteen participants were analysed. One participant was excluded because she wore glasses.
5.2 Results
A prerequisite for sleepiness estimation based on blink parameters is accurate detection of the blink complex. Results on blink detection performance are presented in section 5.2.2. The most promising sleepiness indicator is the blink duration and such results are reported in section 5.2.4.
5.2.1 System availability
The availabilities, i.e. the percentage of time when the system provides eye tracking data, of the 1-camera system and the 3-camera system are illustrated for daytime and night-time in Figure 5 and Figure 6, respectively. In general, the 3-camera system has higher availability than the 1-camera system. It is also apparent that head tracking has higher availability compared to gaze tracking and eyelid tracking.
Gaze tracking availability is somewhat higher during night time whereas head and eyelid tracking deteriorates a little. Interestingly, availability increases after the
turnaround during night time, which coincides with some participants aborting the test. This may indicate that the systems have more difficulties tracking sleepy drivers.
Figure 5 Quartiles across participants of the availability of tracking data for gaze (left), head (middle) and eyelid (right) during daytime in the field test. The grey box indicates the turnaround, blue indicates the 1-camera system and red indicates the 3-camera system. When the areas overlap, the colours are blended.
Figure 6 Quartiles across participants of the availability of tracking data for gaze (left), head (middle) and eyelid (right) during night-time in the field test. The grey box indicates the turnaround, blue indicates the 1-camera system and red indicates the 3-camera system.
5.2.2 Blink detection
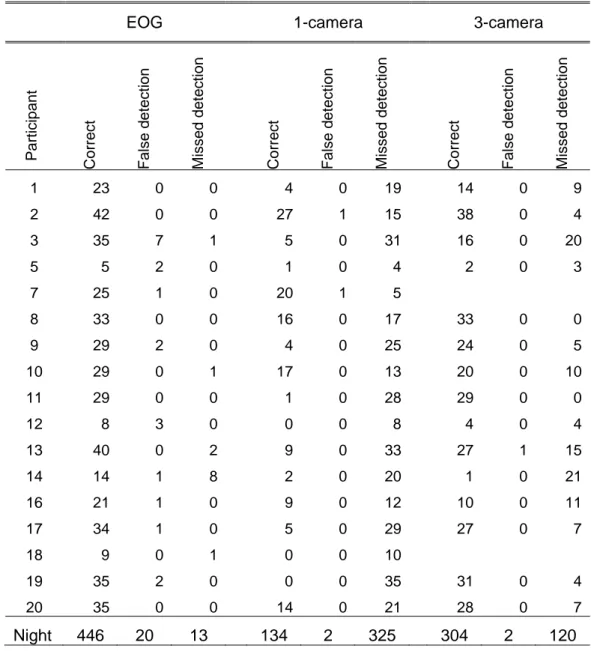
One-minute segments were extracted from each trip and the blink detections from the EOG, the 1-camera system and the 3-camera system were compared with manually annotated video. The results are summarized in Table 6 and Table 7 for daytime and night-time, respectively. During daytime, the percentages of correctly detected blinks were 99.2% for the EOG, 42.5% for the 1-camera system and 62.0% for the 3-camera system. During night-time, the corresponding percentages were 97.2%, 29.2% and 71.7%, respectively. Note that none of the systems delivered a high number of false detections. Also note that since data from the 3-camera system is missing for some participants, the sum of correct and missed detections is not identical across systems.
Table 6 Number of correct, false and missed blink detections during daytime session of the field test based on EOG, 1-camera and 3-camera, respectively. (Reference: video recordings.)
EOG 1-camera 3-camera
Participant Cor re c t False d etecti on Missed dete c tion Cor re c t False d etecti on Missed dete c tion Cor re c t False d etecti on Missed dete c tion 1 37 0 0 32 2 5 13 0 24 2 52 1 0 9 0 43 48 0 4 3 12 3 0 0 0 12 11 0 1 5 18 0 0 16 0 2 9 0 9 7 37 0 0 37 0 0 36 0 1 8 25 1 0 12 0 13 23 0 2 9 18 3 0 14 0 4 16 0 2 10 58 0 0 31 2 27 4 0 54 11 26 1 1 10 1 17 18 0 9 12 8 1 0 0 0 8 3 0 5 13 48 0 0 6 0 42 35 0 13 14 9 0 0 8 0 1 0 0 9 16 13 2 0 1 0 12 12 0 1 17 36 0 0 11 0 25 18 22 0 3 1 0 24 4 0 21 19 29 5 0 2 0 27 21 0 8 20 37 0 0 18 0 19 28 0 9 Day 485 17 4 208 5 281 281 0 172
Table 7 Number of correct, false and missed blink detections during night-time session of field test based on EOG, 1-camera and 3-camera, respectively. (Reference: video recordings.)
EOG 1-camera 3-camera
Participant Cor re c t False d etecti on Missed dete c tion Cor re c t False d etecti on Missed dete c tion Cor re c t False d etecti on Missed dete c tion 1 23 0 0 4 0 19 14 0 9 2 42 0 0 27 1 15 38 0 4 3 35 7 1 5 0 31 16 0 20 5 5 2 0 1 0 4 2 0 3 7 25 1 0 20 1 5 8 33 0 0 16 0 17 33 0 0 9 29 2 0 4 0 25 24 0 5 10 29 0 1 17 0 13 20 0 10 11 29 0 0 1 0 28 29 0 0 12 8 3 0 0 0 8 4 0 4 13 40 0 2 9 0 33 27 1 15 14 14 1 8 2 0 20 1 0 21 16 21 1 0 9 0 12 10 0 11 17 34 1 0 5 0 29 27 0 7 18 9 0 1 0 0 10 19 35 2 0 0 0 35 31 0 4 20 35 0 0 14 0 21 28 0 7 Night 446 20 13 134 2 325 304 2 120
Three excerpts from these one-minute segments are shown in Figure 7 to Figure 9Figure 9. Figure 7 illustrates the occurrence of long duration blinks. In this case, the EOG detects both long blinks while the 3-camera system detects the first long blink while the 1-camera system detects the second long blink. In Figure 8 all blinks are detected by the 1-camera system while no blinks are detected by the 3-camera system, but then again, in Figure 9 the 3-camera system performs better.
Figure 7 Example of a segment from one participant comparing blink detections from the EOG (red), 1-camera system (green) and 3-camera system (blue). The black lines represent the occurrence of true blinks based on video annotations. The grey signals in the background are the vertical EOG lead and the eyelid opening, respectively.
Figure 8 Example of a segment from one participant comparing blink detections from the EOG (red), 1-camera system (green) and 3-camera system (blue). The black lines represent the occurrence of true blinks based on video annotations. The grey signals in the background are the vertical EOG lead and the eyelid opening, respectively.
31995 32095 32195 32295 32395 32495 32595 32695 32795 0 1 2 3 4 5 6 7 Frame number E O G / E y e l id open ing ( a u) 36750 36850 36950 37050 37150 37250 37350 37450 37550 37650 37750 0 0.5 1 1.5 2 2.5 3 3.5 4 4.5 5 Frame number E O G / E y e l id op eni ng ( au )
Figure 9 Example of a segment from one participant comparing blink detections from the EOG (red), 1-camera system (green) and 3-camera system (blue). The black lines represent the occurrence of true blinks based on video annotations. The grey signals in the background are the vertical EOG lead and the eyelid opening, respectively.
5.2.3 Blink frequency
Blink frequency is not only related to sleepiness but also to the allocation of attention resources, the transition points in information processing and possibly processing mode and is consequently not a very useful measure of sleepiness (Stern, Walrath et al., 1984). However, since it reflects the influence of poor blink detections performance it is an interesting performance indicator of the different systems. Figure 10 shows how the median value and the quartiles of the estimated blink frequency vary over time. It can be seen that for all systems, the blink frequency is rather constant throughout the entire trip during daytime while it tends to increase with distance driven during night-time. There is, however, a large difference between the systems. The average blink frequency across all data and all participants are 32 blinks per minute for the EOG, 13 blinks per minute for the 1-camera system and 20 blinks per minute for the 3-camera system, Figure 11. Plotting the difference in average blink frequency, between blinks associated with KSS < 7 versus KSS ≥ 7 for each participant, shows that for about half of the participants the blink frequency increases when they are sleepy whereas the other half shows a decrease in blink frequency, see Figure 12. The participants have been sorted in ascending order according to the EOG. Preferably there should have been a similar increasing trend in all three systems but there is no relation between the blink detections of the systems.
45298 45398 45498 45598 45698 45798 45898 45998 46098 46198 46298 0 1 2 3 4 5 6 7 Frame number E O G / E y e l id open ing ( a u)
Figure 10 Median values (solid line) and quartiles (shaded region) across participants of the blink frequency (measured in blinks per minute, bpm) as a function of distance driven in the field test. The dark grey box indicates the turnaround, blue indicates alert and red indicates sleep deprived.
Figure 11 Mean values of blink frequency across participants (measured in blinks per minute, bpm) as a function of distance driven in the field test. The grey box indicates the turnaround. Note that the shaded areas do not have an intrinsic value and are only used to group the two conditions alert and sleep deprived within the same system.
Figure 12 The mean difference between blink frequencies (measured in blinks per minute, bpm) with KSS<7 and blink frequencies with KSS≥7 for each participant in the field test. The participants have been sorted in ascending blink frequency difference order according to the EOG.
5.2.4 Blink duration
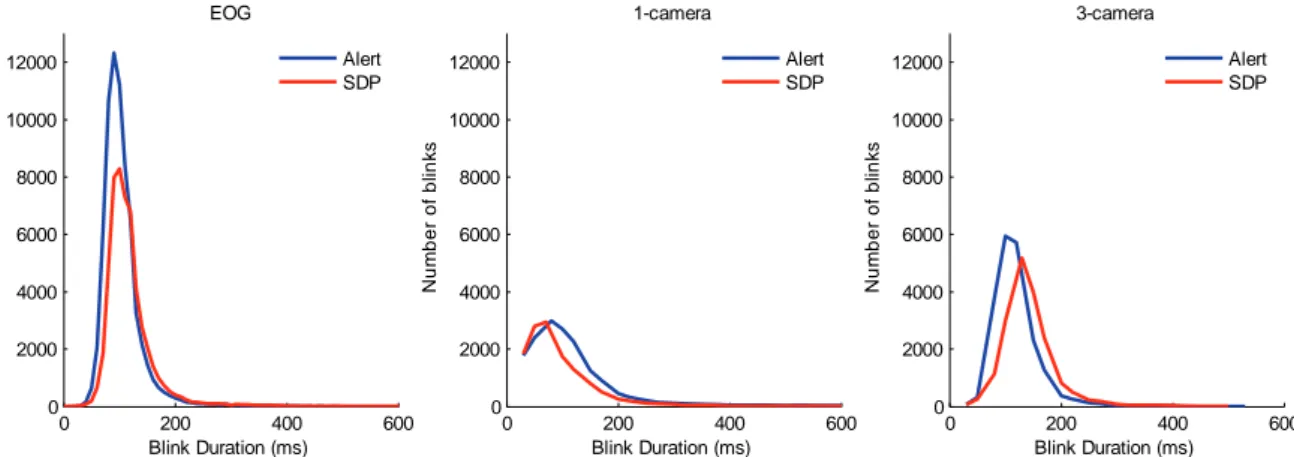
The histogram of blink durations as determined by the three systems is shown in Figure 13. As noted in the previous section, the EOG detects the largest amount of correct blinks. For the EOG and the 3-camera system, there is a slight shift towards longer blink durations when the participants are sleep deprived while for the 1-camera system the blink durations decrease for sleep deprived drivers. Note that the blink durations are somewhat longer for the 3-camera system as compared to the EOG.
Figure 13 Histograms of blink duration measured with the three systems in the field test. Blue indicates alert and red indicates sleep deprived.
Scatter plots showing the mean blink duration across all participants are illustrated in Figure 14. The correspondence between the systems is poor with correlation coefficients of 0.28 for EOG vs. 1-camera, 0.16 for EOG vs. 3-camera and 0.39 for 1-camera vs.
0 2 4 6 8 10 12 14 16 -20 -15 -10 -5 0 5 10 15 20 25 30 35 Participant # B link f requ en c y di ff er en c e ( bp m ) EOG 1-camera 3-camera 0 200 400 600 0 2000 4000 6000 8000 10000 12000 N um b er of bl ink s Blink Duration (ms) EOG 0 200 400 600 0 2000 4000 6000 8000 10000 12000 N um b er of bl ink s Blink Duration (ms) 1-camera 0 200 400 600 0 2000 4000 6000 8000 10000 12000 N um b er of bl ink s Blink Duration (ms) 3-camera Alert SDP Alert SDP Alert SDP
3-camera in the alert condition. Corresponding coefficients in the sleep deprived condition are 0.38, 0.33 and 0.37, respectively. All correlations are significant at the 95% level.
Figure 14 Scatter plots of blink durations from the three systems plotted against each other. Left: EOG (x-axis) and 1-cam (y-axis), middle: EOG (x-axis) and 3-cam (y-axis), right: 1-cam (x-axis) and 3-cam (y-axis). Blue indicates alert and red indicates sleep deprived.
Figure 15 shows how the median value and the quartiles across participants of the blink duration vary over distance driven for alert and sleep deprived drivers. For the EOG and the 3-camera system there is a small gap between the two conditions but such a differ-ence is not visible for the 1-camera system. The same plot, but with really long blinks
represented by the 95th percentile of the distribution instead, is shown in Figure 16. In
this case the only difference between the groups can be seen in the 3-camera system.
Figure 15 Median values (solid line) and quartiles (shaded region) across participants of the mean blink duration as a function of distance driven in the field test. The dark grey box indicates the turnaround, blue indicates alert and red indicates sleep deprived. Top: EOG, middle: 1-camera system, bottom: 3-camera system.
Figure 16 Median values (solid line) and quartiles (shaded region) across participants of the 95th percentile of blink duration as a function of distance driven in the field test. The dark grey box indicates the turnaround, blue indicates alert and red indicates sleep deprived. Top: EOG, middle: 1-camera system, bottom: 3-camera system.
Plots where the blink duration data is represented as a function of KSS instead of a function of distance are shown in Figure 17 and Figure 18. For the EOG and the 3-camera system there is an increase in average blink duration when the driver is very sleepy (KSS = 9). It can also be seen that the blink duration is longer when the drivers are sleep deprived even though they report the same KSS values as during the alert condition. For the 1-camera system the situation is different. Even though the blink duration increases with increasing KSS values, the blink durations are shorter for sleep
deprived drivers as compared to alert drivers. Similar findings can be found in the 95th
Figure 17 Boxplot showing the average blink duration across participants as a function of KSS. On each box, the central mark is the median, the edges of the box are the 25th and 75th percentiles and the whiskers extend to the most extreme data-points not
considered to be outliers. Left: EOG, middle: 1-camera system, right: 3-camera system. Blue indicates alert and red indicates sleep deprived.
Figure 18 Boxplot showing the 95th percentile of blink duration across participants as a function of KSS. On each box, the central mark is the median, the edges of the box are the 25th and 75th percentiles and the whiskers extend to the most extreme data-points not considered to be outliers. Left: EOG, middle: 1-camera system, right: 3-camera system. Blue indicates alert and red indicates sleep deprived.
Investigating the blink duration per participant, it can be seen that the EOG consistently provides longer blink durations for blinks associated with KSS ≥ 7 as compared to KSS < 7, see Figure 19 and Figure 20. However, the difference between alert and sleepy is lower than 20ms in all but three drivers. For the 3-camera system blink durations are longer for sleepy drivers in all cases but one, but also here the difference is less than 20 ms in a majority of the drivers. For the 1-camera system the results are ambiguous and more difficult to interpret. Comparing the three systems with each other, there are no systematic similarities across different drivers.
0 50 100 150 200 250 300 2 3 4 5 6 7 8 9 B lin k D u rat ion (m s ) EOG Alert SDP 0 50 100 150 200 250 300 2 3 4 5 6 7 8 9 B lin k D u rat ion (m s ) 1-camera Alert SDP 0 50 100 150 200 250 300 2 3 4 5 6 7 8 9 B lin k D u rat ion (m s ) 3-camera Alert SDP 0 100 200 300 400 500 600 700 2 3 4 5 6 7 8 9 95 B link D u rat ion ( m s ) EOG Alert SDP 0 100 200 300 400 500 600 700 2 3 4 5 6 7 8 9 95 B link D u rat ion ( m s ) 1-camera Alert SDP 0 100 200 300 400 500 600 700 2 3 4 5 6 7 8 9 95 B link D u rat ion ( m s ) 3-camera Alert SDP
Figure 19 Blink duration per participant when alert (KSS < 7) and sleepy (KSS ≥ 7). Left: EOG, middle: 1-camera system, right: 3-camera system. The participants have been sorted in ascending order based on the sleepy drivers as measured with EOG.
Figure 20 The mean difference between blink durations with KSS≥7 and blink durations with KSS<7 for each participant. The participants have been sorted in ascending blink duration difference order according to the EOG.
0 5 10 15 40 60 80 100 120 140 160 180 200 220 240 Participant # B link dur at ion ( m s ) EOG KSS >= 7 KSS < 7 0 5 10 15 40 60 80 100 120 140 160 180 200 220 240 Participant # B link dur at ion ( m s ) 1-camera KSS >= 7 KSS < 7 0 5 10 15 40 60 80 100 120 140 160 180 200 220 240 Participant # B link dur at ion ( m s ) 3-camera KSS >= 7 KSS < 7 0 2 4 6 8 10 12 14 16 -50 0 50 100 Participant # B link durat ion di ff er enc e (m s ) EOG 1-camera 3-camera
6
Determination of sleepiness thresholds
The aim of determining thresholds for sleepiness indicators was to develop a sleepiness detector for simulator applications. The determination of sleepiness thresholds was therefore done using data from the simulator experiment only.
As a first step, the most promising – from the literature review and by studying the data – sleepiness indicators were selected and the optimal threshold for each single indicator was determined. The indicators were then combined into a feasible detector/classifier. In the last step, the performance of the classifier was evaluated on unseen data from another project.
In an ideal world, a sleepiness threshold/detector should be able to discriminate across a range of sleepiness levels, so that a warning system could be triggered on an arbitrary level. In reality, this is very hard to achieve because of the complex nature of sleepiness and sleepiness indicators.
In this project, it was decided that the sleepiness level the thresholds/detector should be able to identify was KSS=8 or higher. This corresponds to “sleepy, some effort to stay awake”. On this level, there is no doubt the driver is sleepy and triggering a warning on this level is seen as well motivated and will hopefully also reach a high acceptance by the driver.
6.1 Method
6.1.1 Preparation of dataset
A dataset that included the indicators suggested in Section 2.3 was prepared. Since the indicators can be represented in different ways, for example as a mean or a median, a number of variants of each indicator was computed (see below). For each variant, the optimal threshold for discrimination between alert and sleepy drivers was determined, by finding the indicator value that resulted in the highest performance. Performance is defined as the average of sensitivity and specificity. In this application, sensitivity is the proportion of correctly classified sleepy drivers while the specificity is the proportion of correctly classified alert drivers.
2
nsleepyCorrect denotes the number of sleepy drivers correctly classified as sleepy, while
nsleepyIncorrect denotes the number of sleepy drivers incorrectly classified as alert (and vice
The optimal threshold was determined simply by stepping through the range of indicator values and in each step calculating sensitivity, specificity and performance. The procedure is illustrated in Figure 21. Data points where (the average) KSS was >7.5 were regarded as “sleepy” while the rest were regarded as “alert”.
Figure 21 Determination of optimal threshold for a single indicator. The performance is at a maximum when the indicator has a value of approximately 3.5.
All indicators were calculated in a sliding window of 5 min with 1 min resolution. It has been shown that time windows of at least 60 s in general give better results than shorter intervals when calculating sleepiness indicators, and that windows longer than 60 s are beneficial for blink duration (Sandberg, 2011). A window length of 5 min was therefore considered to be a reasonable choice. The time resolution of 1 min was chosen partly in order to make the best use of the acquired data, but also with the future application in mind where the sleepiness detector should be able to warn a driver before he/she
actually falls asleep and drives off the road but where a smaller time resolution probably won’t be of any use.
The overtaking events in the beginning and the end of the driving session, and the three tasks in the end of the driving session (see Section 0) were excluded from the dataset. Sections with simulator failure were also excluded (see Section 4.4). Smart Eye data was missing for participants 1-alert, 9-alert and 16-alert, either because of technical problems with the system itself or because of synchronization problems with the simulator data.
6.1.2 Selection of sleepiness indicators
From the literature review (Chapter 2) it was concluded that blink duration, PERCLOS, blink frequency, lateral position variation, trip duration and time of day were the most feasible indicators. The selection of indicators was somewhat modified when the results from the camera evaluation were available.
1 2 3 4 5 6 7 8 0 0.1 0.2 0.3 0.4 0.5 0.6 0.7 0.8 0.9 1 Indicator (a.u.) S e n s , sp e c , p e rf Sensitivity Specificity Performance
Blink based indicators
In the evaluation of the 1-camera system, it was found that blink frequency was not a reliable measure since the camera system misses a lot of blinks. Furthermore, it was demonstrated that the blink frequency obtained from the EOG – which is a fairly reliable measure – was not a feasible sleepiness indicator, since the blink frequency increased with sleepiness for some participants and decreased for some other (Section 5.2.2). This could perhaps be explained by the fact that blink frequency also is related to e.g. attention and cognitive functions (Stern, Walrath et al., 1984). Therefore, blink frequency was excluded from the threshold analysis.
PERCLOS was also excluded from the analysis, since it can be assumed that this measure is not very reliable when a lot of blinks are missing.
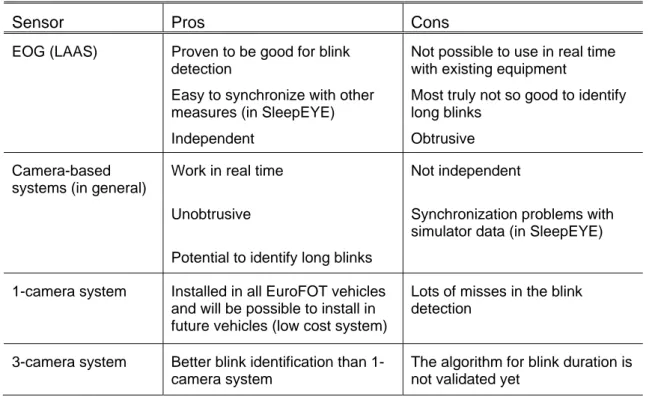
The only blink based indicator included was thus blink duration. In the evaluation of the camera system it was concluded that there was a substantial difference in the blink duration identified from the EOG and from the camera systems, but it is still a bit unclear which system gives the best results since there are no true answers available. The camera-based systems have a limitation in their time resolution, while the EOG algorithm sometimes has problem to identify the beginning and the end of a blink. The pros and cons of the three systems are listed in Table 8. The camera-based systems have a great advantage in terms of their unobtrusiveness and they also work in real time. EOG based blink detection, on the other hand, is much more robust than the camera-based counterparts and it is not dependent on any commercial hardware or software. The original plan was to use camera-based blink measures from the 1-camera system only (in combination with other kinds of indicators) when developing the sleepiness detector. However, since the blink duration obtained from the 1-camera system was not in agreement neither with the EOG based blink duration nor with 3-camera blink duration, it was decided that two separate sleepiness detectors should be developed and compared: one using blink durations from the EOG (calculated with the LAAS