Abstract— Driver fatigue is a contributing factor in about 20% of all fatal road crashes worldwide. Countermeasures are urgently needed and one of the most promising and currently available approaches for that are in-vehicle systems for driver fatigue detection. The main objective of this paper is to present a video-based driver sleepiness detection system set up as a two-stage model with (1) a generic deep feature extraction module combined with (2) a personalised sleepiness detection module. The approach was designed and evaluated using data from 13 drivers, collected during naturalistic driving conditions on a motorway in Sweden. Each driver performed one 90-minute driving session during daytime (low sleepiness condition) and one session during night-time (high sleepiness condition). The sleepiness detection model outputs a continuous output representing the Karolinska Sleepiness Scale (KSS) scale from 1–9 or a binary decision as alert (defined as KSS 1–6) or sleepy (defined as KSS 7–9). Continuous output modelling resulted in a mean absolute error (MAE) of 0.54 KSS units. Binary classification of alert or sleepy showed an accuracy of 92% (sensitivity = 91.7%, specificity = 92.3%, F1 score = 90.4%). Without personalisation, the corresponding accuracy was 72%, while a standard fatigue detection PERCLOS-based baseline method reached an accuracy of 68% on the same dataset. The developed real-time sleepiness detection model can be used in the management of sleepiness/fatigue by detecting precursors of severe fatigue, and ultimately reduce sleepiness-related road crashes by alerting drivers before high levels of fatigue are reached.
Index Terms—Fatigue detection, Video-based, Deep learning, Field trial
I. INTRODUCTION
ATIGUE, including sleepiness, is a contributing factor in 5–50 % of all crashes [1], with median values usually falling between 15–25 % [2], and elevated crash risks of 1.29–1.34 times compared to driving without fatigue [3]. These fatigue related crashes typically occur during night-time or in the early morning hours, after too many uninterrupted hours
The work was funded by Shell’s Road Safety group.
B. Bakker is with Cygnify B.V., 2333 CW Leiden, the Netherlands. B. Zabłocki was with Cygnify B.V., 2333 CW Leiden, the Netherlands, and is now with bol.com, 3528 BJ Utrecht, the Netherlands.
A. Baker, V. Riethmeister and B. Marx are with Shell International, 2596HR The Hague, the Netherlands.
G. Iyer is with Shell Trading and Supply, 20 York Road, London SE1 7NA, United Kingdom.
behind the wheel, or after extended periods of high or low workload [4]. In this paper, fatigue is defined as the biological drive for recuperative rest, with sleepiness as a special case referring to accumulated sleep debt, prolonged wakefulness, or troughs in the circadian rhythms.
Evidence suggests that the introduction of assisted or partially automated driving leads to higher levels of fatigue, probably related to underload effects [5-8]. On the positive side, more advanced automation may eventually also provide an effective countermeasure to driver fatigue since the vehicle may then initiate a safe stopping manoeuvre or take over the driving task completely. However, that technology is still evolving and relatively far away. Driver fatigue monitoring systems are thus needed in both conventional vehicles as well as in partially or conditionally automated vehicles, either to convince fatigued drivers to pull over for a rest or nap, or to detect when the driver is unfit to take back control from the automated vehicle.
Current fatigue detection systems are typically based on (i) vehicle-based information such as lane keeping performance, (ii) behavioural information such as yawning and eye movements, and/or (iii) driver physiological data such as electrocardiography (ECG), electroencephalography (EEG), or electrooculography (EOG) [9-13]. However, the advanced driver assistance and automated driving systems available today and in the near future are changing the playing field for fatigue detection systems. When appropriate longitudinal and lateral positioning is secured by the vehicle, vehicle-based data can no longer be used as fatigue indicators, and solutions based on physiological sensors are often obtrusive and/or sensitive to motion artifacts [14]. Video-based systems are the most practical and user-friendly approach to driver fatigue detection, and very promising in terms of potential accuracy. Application to future automated vehicles, however, may need adaptations in terms of camera placement, the number of cameras, as well as to the sleepiness detection algorithms, since the driver may be out of position or involved in tasks that block the cameras’ view
A. Anund is with the Swedish National Road and Transport Research Institute (VTI), S-58195 Linköping, Sweden, Rehabilitation Medicine, Linköping University, Linköping, Sweden, and with the Department of Psychology, Stress Research Institute, Stockholm University, Stockholm, Sweden.
C. Ahlström is with the Swedish National Road and Transport Research Institute (VTI) and with the Department of Biomedical Engineering, Linköping University, S-58195 Linköping, Sweden (e-mail: christer.ahlstrom@vti.se).
A Multi-Stage, Multi-Feature Machine Learning
Approach to Detect Driver Sleepiness in
Naturalistic Road Driving Conditions
Bram Bakker, Bartosz Zabłocki, Angela Baker, Vanessa Riethmeister, Bernd Marx, Girish Iyer, Anna
Anund, Christer Ahlström, Senior member, IEEE
of the driver’s face.
For video-based fatigue detection, the ocular parameter that has traditionally been considered to be most reliable and valid is the degree of eyelid closure, commonly known as Percentage of Eyelid Closure over Time, PERCLOS [9]. However, despite being a strong indicator of driver fatigue for highly averaged data, performance deteriorates at finer temporal resolutions as well as on an inter-individual level [11]. In addition, there are also issues when drivers are squinting against the sun and if there are changing light conditions. Longer blink durations have also been found to be related to increasing levels of driver sleepiness, are consistently found in many studies, but the effect size is small and there are large individual differences [e.g. 15, 16-19]. Other metrics/features, or combinations of metrics/features, are therefore recommended [11].
Video-based fatigue detection is implemented using computer vision and machine learning techniques. These algorithms are commonly set up as multi-stage models. The early stages extract manually defined fatigue indicators based on domain knowledge (such as blink duration or PERCLOS) or so-called deep features (i.e., a consistent response of one or more nodes in a hidden layer within a deep neural network-based hierarchical model that is relevant for sleepiness detection). The later stages are intended to model the relation between the (deep) features and driver sleepiness. Previous research has, for example, used commercial eye trackers [20] or convolutional neural networks (CNN) [e.g. 21, 22, 23] to obtain features for the later stages. The later stages use various machine learning methods such as fuzzy K-nearest neighbours [20], decision trees [24], hidden Markov models [25], various types of CNNs [22, 23, 26-28] and long short-term memory networks [21, 29].
A limitation with some of the suggested systems is that they only detect facial features indicative of fatigue, such as yawning and eyelid closure. It is then assumed that yawning and a high percentage of eyelid closure time (i.e. PERCLOS) equates to fatigue. As already outlined above, this is not always the case,
and these methods are consequently only addressing half the problem. Detecting eyelid closures with high accuracy is important, but it is only the first step when classifying actual sleepiness levels. Another limitation is that many of the studies are based on data from driving simulators or driving-based video games, and sometimes with drivers who are asked to act sleepy by voluntary long blinking, yawning, etc. [21, 23-27, 29]. How such systems generalise to a real-world setting and real-world fatigue is not known.
The objective of this paper is to present a video-based driver sleepiness detection system, which is also feasible for real-time application, and to evaluate its performance on a real-road dataset obtained with sleepy drivers in a naturalistic driving situation on a motorway.
II. METHODOLOGY
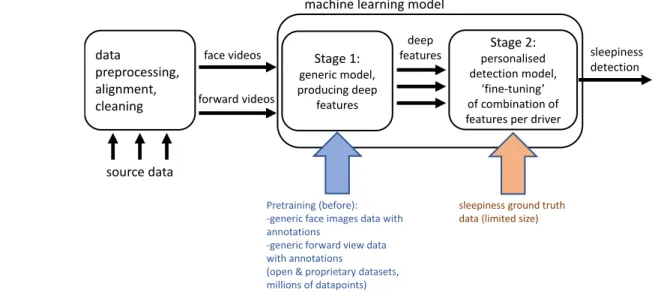
The framework of the suggested sleepiness detection approach is summarized in Fig. 1. In the first stage, features are extracted from both driver face and forward-looking driving context videos. These features represent eye opening and closing information, gaze direction, head pose, facial expressiveness extracted from the face video, and lane positions, lane departures, and lane changes (extracted from the forward-facing camera). To a large extent, this first stage makes use of pre-trained models, which is necessary given the limited sleepiness-specific dataset at hand. The extracted features are fed to the second stage, which models the relation between the features and the sleepiness level. The sleepiness classification model either outputs a binary decision (alert or sleepy) or a continuous regression-like output of the sleepiness level based on data from the past 5 minutes.
This approach mirrors what is by now a standard approach in deep learning, where many computer vision-related tasks use early-stage subcomponents pretrained on large, open datasets such as the Imagenet dataset [30], and only final layers are trained to “finetune” the overall system to a specific specialized task.
Fig. 1. The overall machine learning-based framework for assessing (classification or non-linear regression of) sleepiness, based on two main stages of processing, which takes as input pre-processed driver face video and forward-looking video of the road ahead.
machine learning model
deep features sleepiness detection face videos forward videos data preprocessing, alignment, cleaning source data Pretraining (before): -generic face images data with annotations
-generic forward view data with annotations
(open & proprietary datasets, millions of datapoints)
sleepiness ground truth data (limited size) data preprocessing, alignment, cleaning Stage 1: generic model, producing deep features Stage 2: personalised detection model, ‘fine-tuning’ of combination of features per driver
The first and second stage employ a combination of Python and C++ (for time critical computations), divided into multiple modular subcomponents (detailed below), which in turn employ a combination of deep learning frameworks (Tensorflow 1.7 and PyTorch 1.5), and a combination of multi-threaded CPU computation and GPU computation. The resulting system can process data at about 25 frames per second on a single multicore i7 CPU laptop with a NVIDIA GTX 1080 graphics card. Real-time application has been a goal throughout this work, and the relatively high throughout was achieved after algorithm/software tuning, and by exploiting the multicore CPU to run the different subcomponents in parallel.
A. Sleepiness Database
The dataset used for algorithm design and validation consists of recordings from 20 participants (10 men and 10 women). Their mean age was 42.6 ± 8.8 years, they had had their driving license for 23.1 ± 9.3 years, they drove on average 18172 ± 10240 km/year and had mild to normal excessive daytime sleep propensity (Epworth sleepiness scale score of 6.9 ± 4.5).
Inclusion criteria required that the drivers should be between 30 and 60 years old, have good self-reported health, normal weight (body mass index < 30), and that they were not shift workers or professional drivers. Two drivers were excluded during the data collection phase for failing to follow the study protocol. Five additional drivers were later excluded due to incomplete and/or low-quality data. The final sample size consisted of 13 drivers.
Permission to run experiments with sleep deprived drivers on public roads was given by the Swedish government (N2007/5326/TR). The study was approved by the regional ethics committee in Linköping (dnr 2010/153–3). Each driver signed an informed consent form.
The participants were asked to fill in a sleep diary and to sleep for at least 7 hours during each of the three nights prior to the experiment day. On the experimental day, they were instructed to get up no later than 7:00 a.m. The participants were also requested to avoid alcohol for 72 h and to abstain from nicotine and caffeine for 3 h before the first driving session until the end of the experimental day. Each driver performed one driving session during daytime and one session during night-time after being awake since early morning. The experimental set-up allowed for two participants taking part in the experiment on each experimental day. The first participant of the day started to drive at 15:30 (alert condition) and at 00:15 (sleep deprived condition), while the second participant of the day started to drive at 17:45 and 02:45, respectively. The alert condition was thus performed when the circadian drive was high while the homeostatic sleep pressure was still low, whereas the sleep deprived condition was performed when the circadian drive was at its lowest and when the homeostatic sleep pressure was high. The driving session lasted for about 90 min and was conducted on an intercity motorway on the public road E4 outside the city of Linköping, Sweden. The posted speed limit was 110 km/h and the average daily traffic for this road is 9000–14,000 vehicles. The participants had the sun in their eyes at an altitude of between 20–30° during the first half of the
daytime trip (thus leading to the possibility of the type of realistic eye squinting issues described above), before turning back towards Linköping.
The car used in the experiment was a Volvo XC70 with an automatic gearbox. Facial videos were recorded with a 3-camera Smart Eye Pro system using infrared 3-cameras with accompanying infrared lighting (Smart Eye AB, Gothenburg, Sweden). The infrared camera setup allows for clear imagery also in dark conditions. It also has the added benefit of making the images from day and night look virtually identical, thus helping to reduce unhelpful differences between day and night imagery. Vehicle data, such as speed and lateral position, and videos of the vehicle forward and rear views were also recorded. Only the video of the forward view and of the face, as obtained from the centre Smart Eye camera located just above the steering wheel, were used in this study.
The participants were always accompanied by a safety driver ready to intervene if the drivers were too sleepy to continue or if they showed signs of inappropriate or dangerous driving. The safety driver did not talk to the driver during the data acquisition. The car was equipped with dual control to allow the safety driver to intervene if needed. Five of the drives were cut short in this way since the drivers became too sleepy to drive safely.
The participants were asked to verbally rate their sleepiness level using the subjective Karolinska Sleepiness Scale (KSS) [31]. KSS use nine anchored levels: 1 (extremely alert); 2 (very alert); 3 (alert); 4 (rather alert); 5 (neither alert nor sleepy); 6 (some signs of sleepiness); 7 (sleepy, but no effort to keep alert); 8 (Sleepy, some effort to keep alert); 9 (very sleepy, great effort to keep alert, fighting sleep). The sleepiness level was rated as an average value every 5th minute during the driving sessions. These KSS ratings are used as target values when training the stage 2 model.
B. Sleepiness detection stage 1: Feature extraction
Stage 1 consists of multiple subcomponents (see Fig. 2.), each of which is responsible for a different subtask. Many of these subcomponents use state of the art, but by now relatively widely used algorithms in computer vision and classification, powered by deep learning.
Face videos: In the face videos, the first subcomponent is an
efficient implementation of the (pretrained) Multi-task Cascaded Convolutional Neural Network (MTCNN) architecture [32] which is responsible for face detection in the image and identifying five key areas in the face: left and right eye, the nose, and two corners of the mouth. This method was (pre)trained using the open WIDER FACE [33] and CelebA [34] datasets.
Based on the bounding box around the detected face and the five key areas, a second (also pretrained) subcomponent, the Convolutional Experts Constrained Local Model (CE-CLM) [35], estimates fine-grained facial landmarks, mapping the 2D positions of the landmarks in the image space to the 3D positions in estimated real-world space. CE-CLM was (pre)trained using the publicly available 300-W [36], 300-VW [37], IJB-FL [38], and Menpo Challenge [39] datasets.
Next, based on those estimated 2D and 3D positions of the facial landmarks, a third subcomponent estimates the head pose orientation (pitch, roll, and yaw) with respect to the camera, using geometric transformations, in particular a direct linear transform (DLT) followed by Levenberg-Marquard optimization (LM) to minimize reprojection error [40].
In parallel, using the fine-grained facial landmarks from the second subcomponent and the head pose estimate from the third subcomponent, a fourth subcomponent extracts eye closure and eye gaze patterns. Using the facial landmarks for the eyes, image patches are extracted from the image and fed into yet another convolutional network, based on the well-known VGG-16 image classification architecture [41], which extracts relevant image features. These image features are, in several added final layers, combined with the head pose estimate to estimate eye gaze angles [42]. In addition, the image features are combined with the fine-grained facial landmarks for the eyes to estimate eye closure. This subcomponent was pre-trained using the MPII Gaze [43] and the UT Multi-view [44]
datasets. This subcomponent outputs not only the final eye gaze angles and eye closure estimates, but also some of the underlying feature data, related to the speeds and magnitudes of eye gaze and eye opening/closing changes and underlying eye landmark and eye feature data.
Also in parallel, using the fine-grained facial landmarks and head pose orientation from the second and third subcomponents, a fifth subcomponent estimates facial Action Unit (AUs) values, representing facial expressions, based on Ekman et al.’s Facial Action Coding System [45]. This subcomponent uses the method outlined in Jeni, et al. [46] and the CK+ [47] and Binghamton [48] datasets. First, the facial landmarks and head pose orientation estimate are used to “warp” the face image (by rotation, translation and scaling) to a uniform, common reference frame, such that the subsequent processing becomes independent of the particular head position and orientation and head distance to the camera. Second, the fine-grained facial landmarks are used to delineate the face area from everything outside it, such that hair, hat, ears, neck, and
Fig. 2. The complete architecture consisting of Stage 1 (feature extraction) and Stage 2 (sleepiness detection), each with multiple subcomponents.
all other “background” are removed from subsequent processing by masking. This leaves only the data relevant for facial expression per se, normalized to correct for irrelevant variations due to the head position and pose. Next, both geometric features based on the relative distances between the warped facial landmarks, and appearance features (mostly based on histograms of oriented gradients) derived from local image patches around the facial landmarks are extracted. These are, finally, processed by a layer consisting of support vector regressors, to calculate the AU intensities. Like the eye closure and eye gaze subcomponent, this facial AU subcomponent outputs not only AU intensities, but also change and speed of change data, thresholded binary data derived from the continuous AU intensities, and underlying facial landmark and other feature data used for the AU estimates.
The outputs of the third, fourth, and fifth subcomponent, each of which consist of individual vectors produced for each frame in the face video or a small number of consecutive frames, are concatenated into one large vector, and subsequently integrated and processed, for the multiple frames, by a sixth subcomponent. This facial data integration subcomponent produces summary statistics of these pre-processed sequential data in terms of normalized counts, mean and median values, variance, and extreme values. It also calculates some additional, derived behavioural measures that requires integrating over data of many frames, related to frequency and duration of blinks, head nodding, and yawns, and provides normalized count and duration information for those. In this way, the facial data integration subcomponent produces, from the possibly variable-length received sequence of large data vectors, a relatively compact, fixed size (length 550) vector representation, suitable for the final layers (stage 2) of classification or nonlinear regression. This feature vector represents the statistical and sequential pattern, change, and anomaly data inherent in the head pose and eye movements, the eye openings and closings, the facial AU intensity and derived values, and derived behavioural measures extracted from a face video clip (or “episode”, 5 minutes long in our case).
Forward videos: Lane deviation and lane change data were
the main features of interest from the forward videos. The first subcomponent for lane detection and intra-lane position is based on the algorithm by Zou, et al. [49]. It was pretrained using the TuSimple open lanes dataset [50], and uses efficient and fast (during inference) layers of convolutional network encoding, convolutional LSTM, and finally convolutional network decoding.
A second subcomponent makes use of the raw lane data from the first lane detection subcomponent to detect lane changes and estimate deviations from the lane centre over time. Lane change and lane deviation data are summarized in a feature vector of fixed size (length 24). In this process, lane deviations due to lane changes are filtered out (as they would otherwise confound the lane deviation data).
Integration: The final output of the first and second stage
models are concatenated, resulting in a fixed size (550 + 24 = 574) feature vector representation.
C. Sleepiness detection stage 2: Sleepiness classification and non-linear regression
The second stage model was trained and evaluated based on data from the VTI sleepiness database. The compact feature vector (length 574) from stage 1, representing relevant and characteristic features from a 5-minute episode of both face video data and forward video data, constitute the model inputs.
The complete sleepiness detection system, including both stage 1 and stage 2, represents a very deep multi-component architecture where the stage 2 algorithms constitute the last layers. Since the VTI sleepiness database used here is relatively small, in terms of modern machine learning, a relatively lightweight classifier was used for this last processing stage. Several methods were explored, including kNN, random forest, XGBoost and support vector variations [51]. Many of these algorithms showed high performance, which suggests that most of the hard work was already done by the earlier layers in the first stage. The results presented in the paper are based on (weighted) kNN models. Euclidean distance functions were used for these models, and the hyperparameter k was set to 5. These settings were found based on limited trial and error using a simplified cross-validation approach with random allotment of some train episodes as validation episodes for defining the hyperparameters and to validate model performance before the final evaluation.
As an additional pre-processing step, simple variance threshold feature selection with a fixed threshold [52] was used to remove low-variance features from the normalised feature vectors. In the subsequent training process, overall data from the train set from all drivers was used, with sample weighting favouring the training data from one specific driver, similar to what is done for handling class imbalance [53], leading to individual, personalised models per driver. Specifically, weights were computed as a factor based on the calculated ratio of the specific driver datapoints to the overall (all drivers) datapoints, and then used in a kNN using the weighted distances. This personalisation, which gives higher weight to data from a specific driver, in combination with the distinct and personal (for individual drivers and episodes) feature value combinations from the stage 1 output feature vector, is an important ingredient in our sleepiness detection pipeline.
As mentioned, all modelling was based on 5-minute episodes of data which correspond to one single KSS rating, which yields clear targets for training. The episodes were randomly categorized into “train” or “test”, with 77% used as training data and the remaining 23% as test data (in line with commonly used ratios for relatively small datasets as we have here). The test dataset thus consists of unused video footage for the same drivers as in the train dataset, but these test data episodes were only used for evaluation purposes.
The second stage model was used both in classification-mode, to classify alert vs. sleepy (where alert was defined as KSS ≤ 6 and sleepy as KSS ≥ 7), and in nonlinear regression-mode, to estimate the reported KSS score (levels 1–9). Model optimisation was done for each mode individually.
III. RESULTS
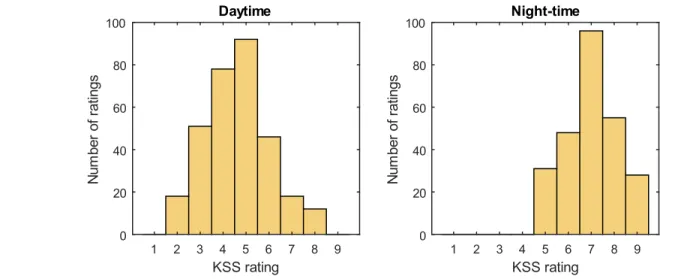
The results are based on data from 13 drivers, corresponding to about 35 hours of day- and night-time driving. All reported results are based on the test set consisting of 88 (23%) randomly selected and distributed 5-minute out-of-sample episodes. The test episodes include episodes from day- and night-time driving as well as from a wide range of KSS levels (Fig. 3).
A. Classification
Binary classification with the full personalised model showed an accuracy of 92.0%, see Tables I and II. The KSS values of the 4 alert episodes that were incorrectly classified as sleepy were at KSS 5, 6, 6 and 6, and the KSS values of the 3 episodes that were incorrectly classified as alert were at KSS 7. This means that incorrect classifications only occurred for borderline threshold cases.
To investigate the added value of personalised models, binary classification results were also derived with a generic non-personalised model. The non-personalised kNN classifier (with otherwise similar k=5 and Euclidean distance settings, and the same stage 1 feature vector representation) resulted in an overall accuracy of 71.6%. Similarly, to investigate the added value of multi-dimensional deep features compared to the widely used and previously advocated PERCLOS metric, binary classification results were derived using the personalised modelling approach from Stage 2, but now with PERCLOS as the only input variable. The overall accuracy obtained in this setup was 68.2%. These results suggest that both personalisation and multi-dimensional features are important for high-level performance.
B. Regression
Regression based modelling with the personalised model, i.e. the direct estimation of the driver-reported discrete-valued KSS scores as opposed to binary sleepy/alert classification, resulted in a mean absolute error (MAE) of 0.54, see Fig. 4. This means that on average, on the KSS scale from 1 to 9, the prediction is only 0.54 KSS units away from the reported KSS level. Looking at Fig. 4, there is a clear relationship between estimated and actual KSS ratings. However, the estimated sleepiness levels also show a large overlap. For example, there are cases where the participants rated themselves as KSS = 9 while the estimated sleepiness level was as low as 6. This must be considered a large deviation.
IV. DISCUSSION
A two-stage, multi-feature deep learning algorithm has been developed to detect sleepy drivers based on unobtrusive video streams of the drivers face and of the forward roadway. Evaluated on a high-validity naturalistic dataset, the personalised sleepiness detection system achieved an accuracy
Fig. 3. Distribution of KSS ratings in the combined train and test datasets from the 13 drivers.
TABLEII
RESULTS FROM BINARY CLASSIFICATION OF SLEEPY DRIVERS WHEN USING THE SUGGESTED PERSONALISED ALGORITHM, AS COMPARED TO A NON-PERSONALISED MODEL, AND WHEN USING A PERSONALISED MODEL WITH ONLY PERCLOS AS INPUT.
Personalised full model Non-personalised model Personalised PERCLOS model
Actual state Actual state Actual state
Estimated state
Sleepy Alert Sleepy Alert Sleepy Alert
Sleepy 91.7%, N=33 7.7%, N=4 52.8%, N=19 15.4%, N=8 44.4%, N=16 15.4%, N=8 Alert 8.3%, N=3 92.3%, N=48 47.2%, N=17 84.6%, N=44 55.6%, N=20 84.6%, N=44 TABLEI
BINARY CLASSIFICATION PERFORMANCE.
Accuracy Sensitivity Specificity F1 Personalised full model 92.0% 91.7% 92.3% 90.4% Non-personalised model 71.6% 52.8% 84.6% 60.3% Personalised PERCLOS model 68.2% 44.4% 84.6% 53.3%
of 92.0% and an F1 score of 90.4% for binary classification of alert versus sleepy drivers. Misclassifications occurred only for borderline threshold cases with KSS ratings 5, 6, or 7. This result is very promising, especially since the evaluation was carried out on a high-validity real-world dataset, as opposed to data from driver simulators with stereotypical, simulated, or unclear fatigue levels, as is sometimes used [e.g. 21, 23, 24, 25-27, 29].
The obtained results can be compared to 71.6% for an identical but non-personalised generic classifier, and to 68.2% for a single-feature (PERCLOS) classifier. This suggests that both personalisation and multi-dimensional features are important for high-level performance.
The personalisation step alone increases the sensitivity with about 40 percentage points. This considerable improvement is important as it means that many fewer sleepy drivers will be misclassified as alert. The added value of personalised algorithms has been showed before [54-56]. In our experience, some sort of personalisation is crucial since different people have different expressions of sleepiness. However, the increased detection performance comes at the cost of reduced usability and acceptance. An alternative approach to individualized algorithms would be to use data driven methods to develop prototype groups that individuals can be assigned to. When data from a new individual is encountered, it is first compared to the different prototypes and the sleep scoring results are then adapted according to the characteristics of the best matching prototype. Such an approach has previously been applied to EEG-based sleep scoring [57]. This is future work that will be explored by the authors at a later stage.
PERCLOS has essentially been the accepted standard for alertness measurement since it was highlighted as the most reliable and valid fatigue metric in a report by Dinges and Grace [58]. However, as noted by Golz, et al. [11], PERCLOS has difficulties with interindividual differences and timely detections. Since eye movements and eye blinks contain substantially more fatigue information than the PERCLOS
measure alone can account for [59], data fusion is a viable way forward. Here we build on and extend this notion by including much more, and more varied data, not only related to the eyes, but to the whole face and head, and including underlying deep neural network-extracted internal features which do not always have a clear semantic interpretation. By doing so, the classification accuracy improved from 68.2% for PERCLOS to 92.0% for the full feature vector.
The results obtained with the proposed driver sleepiness detection algorithm are comparable to what has been reported in other studies [20-22, 24-26, 28, 29, 54, 60, 61]. Compared to many other driver fatigue detection algorithms, however, the present work has been based on and validated against data from sleepy drivers in a naturalistic driving environment with solid and fine-grained ground truth sleepiness assessments, which increases the external validity of the approach. Further benchmarking is needed, but an extensive comparison with existing methods based on the present dataset is out of scope of this project.
Due to the experimental design with sleepy drivers during night-time and alert drivers during daytime, it is possible that the trained sleepiness classifiers have picked up on unwanted features embedded in the videos that are correlated with sleepiness but not actually indicative of sleepiness. One such example is that sleepiness typically occurs during night-time when it is dark outside [62]. To check whether this was the case, the dataset was split into daytime driving and night-time driving and separate models were developed for these two cases. The results from these separate models are comparable to the performance of the combined day/night model (MAE was 0.47 for the day model, 0.51 for the night model, compared to 0.54 for the combined model). This indicates that the developed model picks up information that is related to actual sleepiness rather than just exploiting light conditions.
The lack of an objective ground truth of driver fatigue in general is a problem when designing detection algorithms. If the target values contain noise there is an upper limit for how well the system can perform, especially when constrained by a rather small dataset as is the case here. There are alternative measures that could have been used as target values instead of the subjective KSS ratings. These include EEG measurements [63, 64], blink duration [18], eye aperture [65], reaction time tests [22] and expert ratings based on observations [66, 67]. However, reaction time tests are difficult to administer in real-road driving settings and video-based expert ratings have been found to be unreliable since sleepiness is often confused with boredom [68]. EEG-based measures suffer from noise in naturalistic settings, large inter-individual variability, and the fact that some individuals do not respond despite being clearly sleepy [9, 69, 70]. Increased blink durations are consistently found in many studies, but the effect size is small [e.g. 15, 16-19]. Eye aperture is also sensitive to sleep deprivation [65] as well as driving performance degradation [71], but it suffers from interindividual differences [11] and does not predict drifting off the road very well [72]. The main drawbacks of KSS are that the subjective feeling does not always reflect the actual sleepiness level [73], repeated reporting can have a small
Fig. 4. Regression results for the full personalized model. Colours represent data from individual drivers.
alerting effect [74], and participants may interpret the levels of KSS differently. However, KSS does correlate with lane departures in simulators and with line crossings in real-world driving, and has been found to be the measure of driver sleepiness least affected by inter-individual variations [31]. In addition, a system based on self-ratings might be a system with higher acceptance since it detects sleepiness in a way that match the drivers’ expectations. Taken together, subjective ratings are considered to be the best option in many studies, which is why the KSS scores were used as the ground truth of sleepiness in this evaluation.
There are a few limitations to this research. First, the present dataset has been used both for developing (parts of) the sleepiness detection algorithm as well as for evaluation of the results. This has been addressed by separating the dataset into a training set and a test set, where the training set is used to design and train the models while the test set is used for evaluation purposes only. Ideally, a completely independent dataset should be used for doing additional evaluations. Second, the separation of the dataset into a training set and a test set was done by randomly setting aside 88 (23%) 5-minute data episodes for testing. However, since neighbouring data points are correlated in a time series, random partitioning may result in poor generalisability and an overestimation of the model’s performance. To investigate the impact of correlated data points, the features (between stage 1 and stage 2 in Fig. 1) for neighbouring episodes were compared to episodes that were further apart. It was found that neighbouring episodes were indeed very similar in many cases. Interestingly, there were occasionally quite large dissimilarities between neighbouring episodes, and vice versa, relatively similar episodes farther apart in time, also between day- and night-time driving. In general, it was found that similar deep features had the same KSS score rather than just having close proximity. This is very promising as it indicates that the deep features pick up the actual information in the video recordings that is relevant for fatigue scoring. To investigate this further, it is essential to test how the personalised model performs on data from the same person but on another day. To our knowledge, such datasets are currently very rare or not publicly available. Lastly, this work was based on a data set focusing on sleepiness due to circadian low and homeostasis. Critical situations may also arise in situations where fatigue is caused by task-related underload or overload. Further investigations are needed to investigate the performance of the system under such circumstances.
It should be noted that a system capable of preventing fatigue related crashes is not only dependent on detection/prediction of driver fatigue, but also on the effectiveness of the countermeasure that is then used to convince the driver to act in order to prevent an incident. The type of countermeasure that is needed depends on the type of fatigue that the driver is experiencing. The scientific literature suggests that fatigue due to underload can be countered by doing something else for a while, fatigue due to overload can be remedied by a short break, and fatigue that arise when the driver has been awake for too long or during night-time can only be countered by actual sleep [75].
V. CONCLUSIONS
A personalised multi-stage, multi-feature machine learning approach has been developed. The results are promising, especially considering that the evaluations were carried out on a high-validity dataset obtained with sleepy drivers in a naturalistic driving situation.
Data from more drivers (also with a large variety of facial features/geometries, with multiple recordings per driver, in alert and sleepy conditions, and under task-related fatigue conditions) is essential for an even more extensive evaluation and further development of the presented algorithm.
REFERENCES
[1] D. Dawson, A. c. Reynolds, H. P. A. Van Dongen, and M. J. W. Thomas, "Determining the likelihood that fatigue was present in a road accident: A theoretical review and suggested accident taxonomy," Sleep Medicine Reviews, vol. 42, pp. 202-210, 2018/12/01/ 2018.
[2] T. Åkerstedt, "Consensus statement: fatigue and accidents in transport operations," Journal of sleep research, vol. 9, no. 4, pp. 395-395, 2000.
[3] A. Moradi, S. S. H. Nazari, and K. Rahmani, "Sleepiness and the risk of road traffic accidents: A systematic review and meta-analysis of previous studies," Transportation research part F: traffic
psychology and behaviour, vol. 65, pp. 620-629, 2019.
[4] A. Williamson, D. A. Lombardi, S. Folkard, J. Stutts, T. K. Courtney, and J. Connor, "The link between fatigue and safety,"
Accident Analysis & Prevention, vol. 43, no. 2, pp. 498-515,
2011/03/01/ 2011.
[5] O. Jarosch, S. Paradies, D. Feiner, and K. Bengler, "Effects of non-driving related tasks in prolonged conditional automated non-driving–A Wizard of Oz on-road approach in real traffic environment,"
Transportation research part F: traffic psychology and behaviour,
vol. 65, pp. 292-305, 2019.
[6] M. Körber, A. Cingel, M. Zimmermann, and K. Bengler, "Vigilance decrement and passive fatigue caused by monotony in automated driving," Procedia Manufacturing, vol. 3, pp. 2403-2409, 2015. [7] N. Schömig, V. Hargutt, A. Neukum, I. Petermann-Stock, and I.
Othersen, "The interaction between highly automated driving and the development of drowsiness," Procedia Manufacturing, vol. 3, pp. 6652-6659, 2015.
[8] T. Vogelpohl, M. Kühn, T. Hummel, and M. Vollrath, "Asleep at the automated wheel—Sleepiness and fatigue during highly automated driving," Accident Analysis & Prevention, vol. 126, pp. 70-84, 2019/05/01/ 2019.
[9] A. R. Sparrow, C. M. LaJambe, and H. P. A. Van Dongen, "Drowsiness measures for commercial motor vehicle operations,"
Accident Analysis & Prevention, vol. 126, pp. 146-159, 2018.
[10] M. I. Chacon-Murguia and C. Prieto-Resendiz, "Detecting Driver Drowsiness: A survey of system designs and technology," IEEE
Consumer Electronics Magazine, vol. 4, no. 4, pp. 107-119, 2015.
[11] M. Golz, D. Sommer, U. Trutschel, B. Sirois, and D. Edward, "Evaluation of fatigue monitoring technologies," Somnologie, Article vol. 14, no. 3, pp. 187-199, 2010.
[12] G. Sikander and S. Anwar, "Driver fatigue detection systems: A review," IEEE Transactions on Intelligent Transportation Systems, 2018.
[13] M. Ramzan, H. U. Khan, S. M. Awan, A. Ismail, M. Ilyas, and A. Mahmood, "A Survey on State-of-the-Art Drowsiness Detection Techniques," IEEE Access, vol. 7, pp. 61904-61919, 2019. [14] J. Heikenfeld et al., "Wearable sensors: modalities, challenges, and
prospects," Lab on a Chip, vol. 18, no. 2, pp. 217-248, 2018. [15] P. P. Caffier, U. Erdmann, and P. Ullsperger, "Experimental
evaluation of eye-blink parameters as a drowsiness measure," (in eng), Eur J Appl Physiol, vol. 89, no. 3-4, pp. 319-25, May 2003. [16] A. Campagne, T. Pebayle, and A. Muzet, "Oculomotor changes due
to road events during prolonged monotonous simulated driving," (in eng), Biol Psychol, vol. 68, no. 3, pp. 353-68, Mar 2005.
[17] M. Ingre, T. Åkerstedt, B. Peters, A. Anund, and G. Kecklund, "Subjective sleepiness, simulated driving performance and blink
duration: examining individual differences," Journal of Sleep
Research, vol. 15, no. 1, pp. 47-53, 2006.
[18] R. Schleicher, N. Galley, S. Briest, and L. Galley, "Blinks and saccades as indicators of fatigue in sleepiness warnings: looking tired?," Ergonomics, vol. 51, no. 7, pp. 982-1010, 2008.
[19] C. Papadelis et al., "Monitoring sleepiness with on-board electrophysiological recordings for preventing sleep-deprived traffic accidents," Clinical Neurophysiology, vol. 118, no. 9, pp. 1906-1922, 2007.
[20] J. Xu, J. Min, and J. Hu, "Real-time eye tracking for the assessment of driver fatigue," Healthcare technology letters, vol. 5, no. 2, pp. 54-58, 2018.
[21] J.-M. Guo and H. Markoni, "Driver drowsiness detection using hybrid convolutional neural network and long short-term memory,"
Multimedia Tools and Applications, pp. 1-29, 2018.
[22] Q. Massoz, J. Verly, and M. Van Droogenbroeck, "Multi-Timescale Drowsiness Characterization Based on a Video of a Driver’s Face,"
Sensors, vol. 18, no. 9, 2018.
[23] W. Liu, J. Qian, Z. Yao, X. Jiao, and J. Pan, "Convolutional Two-Stream Network Using Multi-Facial Feature Fusion for Driver Fatigue Detection," Future Internet, vol. 11, no. 5, p. 115, 2019. [24] Y. Du, Y. Wang, X. Huang, and Q. Hu, "Driver State Analysis
Based on Imperfect Multi-view Evidence Support," Neural
Processing Letters, vol. 48, no. 1, pp. 195-217, 2018.
[25] C.-H. Weng, Y.-H. Lai, and S.-H. Lai, "Driver drowsiness detection via a hierarchical temporal deep belief network," in Asian
Conference on Computer Vision, 2016, pp. 117-133: Springer.
[26] X.-P. Huynh, S.-M. Park, and Y.-G. Kim, "Detection of driver drowsiness using 3D deep neural network and semi-supervised gradient boosting machine," in Asian Conference on Computer
Vision, 2016, pp. 134-145: Springer.
[27] Y. Wang, R. S. Huang, and L. Guo, "Eye gaze pattern analysis for fatigue detection based on GP-BCNN with ESM," Pattern
Recognition Letters, 2019.
[28] J. Yu, S. Park, S. Lee, and M. Jeon, "Driver Drowsiness Detection Using Condition-Adaptive Representation Learning Framework,"
IEEE Transactions on Intelligent Transportation Systems, 2018.
[29] T.-H. Shih and C.-T. Hsu, "MSTN: Multistage spatial-temporal network for driver drowsiness detection," in Asian Conference on
Computer Vision, 2016, pp. 146-153: Springer.
[30] J. Deng, W. Dong, R. Socher, L.-J. Li, K. Li, and L. Fei-Fei, "Imagenet: A large-scale hierarchical image database," in 2009
IEEE conference on computer vision and pattern recognition, 2009,
pp. 248-255: Ieee.
[31] T. Åkerstedt, A. Anund, J. Axelsson, and G. Kecklund, "Subjective sleepiness is a sensitive indicator of insufficient sleep and impaired waking function," Journal of Sleep Research, vol. 23, no. 3, pp. 240-252, 2014.
[32] K. Zhang, Z. Zhang, Z. Li, and Y. Qiao, "Joint face detection and alignment using multitask cascaded convolutional networks," IEEE
Signal Processing Letters, vol. 23, no. 10, pp. 1499-1503, 2016.
[33] S. Yang, P. Luo, C. C. Loy, and X. Tang, "WIDER FACE: A Face Detection Benchmark," in 2016 IEEE Conference on Computer
Vision and Pattern Recognition (CVPR), 2016, pp. 5525-5533.
[34] Z. Liu, P. Luo, X. Wang, and X. Tang, "Deep Learning Face Attributes in the Wild," in 2015 IEEE International Conference on
Computer Vision (ICCV), 2015, pp. 3730-3738.
[35] A. Zadeh, Y. Chong Lim, T. Baltrusaitis, and L.-P. Morency, "Convolutional experts constrained local model for 3d facial landmark detection," in Proceedings of the IEEE International
Conference on Computer Vision Workshops, 2017, pp. 2519-2528.
[36] C. Sagonas, G. Tzimiropoulos, S. Zafeiriou, and M. Pantic, "300 Faces in-the-Wild Challenge: The First Facial Landmark Localization Challenge," in 2013 IEEE International Conference on
Computer Vision Workshops, 2013, pp. 397-403.
[37] J. Shen, S. Zafeiriou, G. G. Chrysos, J. Kossaifi, G. Tzimiropoulos, and M. Pantic, "The First Facial Landmark Tracking in-the-Wild Challenge: Benchmark and Results," in 2015 IEEE International
Conference on Computer Vision Workshop (ICCVW), 2015, pp.
1003-1011.
[38] K. Kim, T. Baltrusaitis, A. Zadeh, L.-P. Morency, and G. Medioni, "Holistically constrained local model: Going beyond frontal poses for facial landmark detection," in British Machine Vision
Conference, York, U.K., 2016, pp. 95.1-95.12: BMVA Press.
[39] S. Zafeiriou, G. Trigeorgis, G. Chrysos, J. Deng, and J. Shen, "The Menpo Facial Landmark Localisation Challenge: A Step Towards the Solution," in 2017 IEEE Conference on Computer Vision and
Pattern Recognition Workshops (CVPRW), Honolulu, HI, USA,
2017, pp. 2116-2125.
[40] E. Marchand, H. Uchiyama, and F. Spindler, "Pose estimation for augmented reality: a hands-on survey," IEEE transactions on
visualization and computer graphics, vol. 22, no. 12, pp. 2633-2651,
2015.
[41] K. Simonyan and A. Zisserman, "Very Deep Convolutional Networks for Large-Scale Image Recognition," in 3rd International
Conference on Learning Representations, San Diego, CA, USA,
2015.
[42] T. Fischer, H. Jin Chang, and Y. Demiris, "Rt-gene: Real-time eye gaze estimation in natural environments," in Proceedings of the
European Conference on Computer Vision (ECCV), Munich,
Germany, 2018, pp. 339-357: Springer.
[43] X. Zhang, Y. Sugano, M. Fritz, and A. Bulling, "Appearance-based gaze estimation in the wild," in Proceedings of the IEEE conference
on computer vision and pattern recognition, Boston, MA, USA,
2015, pp. 4511-4520.
[44] Y. Sugano, Y. Matsushita, and Y. Sato, "Learning-by-Synthesis for Appearance-Based 3D Gaze Estimation," in 2014 IEEE Conference
on Computer Vision and Pattern Recognition, Columbus, OH, USA,
2014, pp. 1821-1828.
[45] P. Ekman and W. Friesen, Facial Action Coding System: A
Technique for the Measurement of Facial Movement. Consulting
Psychologists Press, 1978.
[46] L. A. Jeni, J. M. Girard, J. F. Cohn, and F. De La Torre, "Continuous au intensity estimation using localized, sparse facial feature space," in 10th IEEE international conference and workshops on automatic
face and gesture recognition (FG), Shanghai, 2013, pp. 1-7: IEEE.
[47] P. Lucey, J. F. Cohn, T. Kanade, J. Saragih, Z. Ambadar, and I. Matthews, "The Extended Cohn-Kanade Dataset (CK+): A complete dataset for action unit and emotion-specified expression," in 2010 IEEE Computer Society Conference on Computer Vision
and Pattern Recognition - Workshops, San Francisco, CA, USA,
2010, pp. 94-101.
[48] X. Zhang et al., "A high-resolution spontaneous 3D dynamic facial expression database," in 10th IEEE International Conference and
Workshops on Automatic Face and Gesture Recognition (FG),
Shanghai, China, 2013, pp. 1-6.
[49] Q. Zou, H. Jiang, Q. Dai, Y. Yue, L. Chen, and Q. Wang, "Robust lane detection from continuous driving scenes using deep neural networks," IEEE Transactions on vehicular technology, vol. 69, no. 1, pp. 41-54, 2019.
[50] TuSimple Lane Detection Challenge for CVPR2017. Available:
https://github.com/TuSimple/tusimple-benchmark
[51] D. R. Amancio et al., "A systematic comparison of supervised classifiers," PloS one, vol. 9, no. 4, p. e94137, 2014.
[52] B. Venkatesh and J. Anuradha, "A review of feature selection and its methods," Cybernetics and Information Technologies, vol. 19, no. 1, pp. 3-26, 2019.
[53] W. Liu and S. Chawla, "Class Confidence Weighted kNN Algorithms for Imbalanced Data Sets," Berlin, Heidelberg, 2011, pp. 345-356: Springer Berlin Heidelberg.
[54] C. S. Silveira, J. S. Cardoso, A. L. Lourenço, and C. Ahlström, "Importance of subject-dependent classification and imbalanced distributions in driver sleepiness detection in realistic conditions,"
IET Intelligent Transport Systems, vol. 13, no. 2, pp. 347-355, 2019.
[55] C. J. de Naurois, C. Bourdin, C. Bougard, and J. L. Vercher, "Adapting artificial neural networks to a specific driver enhances detection and prediction of drowsiness," Accident Analysis &
Prevention, vol. 121, pp. 118-128, 2018.
[56] J. Jo, S. J. Lee, K. R. Park, I.-J. Kim, and J. Kim, "Detecting driver drowsiness using feature-level fusion and user-specific classification," Expert Systems with Applications, vol. 41, no. 4, Part 1, pp. 1139-1152, 2014/03/01/ 2014.
[57] A. Stocks et al., "Dream lucidity is associated with positive waking mood," Consciousness and Cognition, vol. 83, p. 102971, 2020. [58] D. F. Dinges and R. Grace, "PERCLOS: A valid
psychophysiological measure of alertness as assessed by psychomotor vigilance," US Department of Transportation, Federal Highway Administration. FHWA-MCRT-98-006, 1998.
[59] U. Trutschel, B. Sirois, D. Sommer, M. Golz, and D. Edwards, "PERCLOS: An alertness measure of the past," 2011.
[60] D. Sandberg, T. Åkerstedt, A. Anund, G. Kecklund, and M. Wahde, "Detecting Driver Sleepiness Using Optimized Nonlinear Combinations of Sleepiness Indicators," (in English), IEEE
Transactions on Intelligent Transportation Systems, vol. 12, no. 1,
pp. 97-108, Mar 2011.
[61] H. Mårtensson, O. Keelan, and C. Ahlström, "Driver Sleepiness Classification Based on Physiological Data and Driving Performance From Real Road Driving," IEEE Transactions on
Intelligent Transportation Systems, vol. 20, no. 2, pp. 421-430,
2019.
[62] C. Ahlström, A. Anund, C. Fors, and T. Åkerstedt, "The effect of daylight versus darkness on driver sleepiness: a driving simulator study," Journal of sleep research, vol. 27, no. 3, p. e12642, 2018. [63] M. Gillberg, G. Kecklund, and T. Akerstedt, "Sleepiness and
performance of professional drivers in a truck simulator--comparisons between day and night driving," (in eng), J Sleep Res, vol. 5, no. 1, pp. 12-5, Mar 1996.
[64] A. Picot, S. Charbonnier, and A. Caplier, "On-line detection of drowsiness using brain and visual information," IEEE Transactions
on Systems, Man, and Cybernetics Part A:Systems and Humans,
Article vol. 42, no. 3, pp. 764-775, 2012, Art. no. 6029307. [65] K. Kozak, R. Curry, J. Greenberg, B. Artz, M. Blommer, and L.
Cathey, "Leading Indicators of Drowsiness in Simulated Driving,"
Human Factors and Ergonomics Society Annual Meeting Proceedings, vol. 49, no. 21, pp. 1917-1917, 2005.
[66] M. Awais, N. Badruddin, and M. Drieberg, "A non-invasive approach to detect drowsiness in a monotonous driving environment," Proceedings of the IEEE TENCON Region, vol. 10, 2014.
[67] N. Rodriguez-Ibañez, M. A. García-Gonzalez, M. A. F. de la Cruz, M. Fernández-Chimeno, and J. Ramos-Castro, "Changes in heart rate variability indexes due to drowsiness in professional drivers measured in a real environment," Computing in Cardiology, vol. 39, pp. 913-916, 2012.
[68] C. Ahlstrom, C. Fors, A. Anund, and D. Hallvig, "Video-based observer rated sleepiness versus self-reported subjective sleepiness in real road driving," European Transport Research Review, vol. 7, no. 4, p. 38, 2015// 2015.
[69] D. Sandberg et al., "The Characteristics of Sleepiness During Real Driving at Night-A Study of Driving Performance, Physiology and Subjective Experience," SLEEP, vol. 34, no. 10, pp. 1317-1325, 2011.
[70] T. Åkerstedt et al., "Reaction of sleepiness indicators to partial sleep deprivation, time of day and time on task in a driving simulator--the DROWSI project," Journal of sleep research, vol. 19, no. 2, pp. 298-309, 2010.
[71] W. W. Wierwille, S. E. Fayhey, R. J. Fairbanks, and C. L. Kirn, "Research on vehicle-based driver status/performance monitoring development: 7th Semi-annual Report.," National Highway Traffic Safety AdministrationDOT HS 808 299, 1995.
[72] W. W. Wierwille, M. G. Lewin, and R. J. Fairbanks III, "Research on vehicle-based driver status/performance monitoring, part III," 1996.
[73] H. P. A. Van Dongen, G. Maislin, J. M. Mullington, and D. F. Dinges, "The cumulative cost of additional wakefulness: dose-response effects on neurobehavioral functions and sleep physiology from chronic sleep restriction and total sleep deprivation," Sleep, vol. 26, no. 2, pp. 117-126, 2003.
[74] K. Kaida, T. Åkerstedt, G. Kecklund, J. P. Nilsson, and J. Axelsson, "The effects of asking for verbal ratings of sleepiness on sleepiness and its masking effects on performance," Clinical Neurophysiology, vol. 118, no. 6, pp. 1324-1331, 2007.
[75] J. F. May and C. L. Baldwin, "Driver fatigue: The importance of identifying causal factors of fatigue when considering detection and countermeasure technologies," Transportation Research Part F: