Triggers for displaced decays of long-lived neutral particles in the ATLAS detector
This article has been downloaded from IOPscience. Please scroll down to see the full text article. 2013 JINST 8 P07015
(http://iopscience.iop.org/1748-0221/8/07/P07015)
Download details:
IP Address: 130.238.171.100
The article was downloaded on 10/09/2013 at 08:57
Please note that terms and conditions apply.
View the table of contents for this issue, or go to the journal homepage for more
2013 JINST 8 P07015
PUBLISHED BYIOP PUBLISHING FORSISSAMEDIALAB
RECEIVED: May 10, 2013
ACCEPTED: July 5, 2013
PUBLISHED: July 29, 2013
Triggers for displaced decays of long-lived neutral
particles in the ATLAS detector
The ATLAS collaboration
E-mail:
atlas.publications@cern.ch
A
BSTRACT: A set of three dedicated triggers designed to detect long-lived neutral particles
de-caying throughout the ATLAS detector to a pair of hadronic jets is described. The efficiencies of
the triggers for selecting displaced decays as a function of the decay position are presented for
simulated events. The effect of pile-up interactions on the trigger efficiencies and the dependence
of the trigger rate on instantaneous luminosity during the 2012 data-taking period at the LHC are
discussed.
K
EYWORDS: Trigger concepts and systems (hardware and software); Online farms and online
filtering; Trigger algorithms
2013 JINST 8 P07015
Contents
1
Introduction
1
2
The ATLAS detector
2
3
Benchmark model and decay signature
3
4
Decays in the inner detector and electromagnetic calorimeter
5
5
Decays in the hadronic calorimeter
6
6
Decays in the muon spectrometer
9
7
Trigger efficiency on simulated events
13
8
Triggering on collision data
16
9
Conclusions
17
The ATLAS collaboration
20
1
Introduction
Many extensions to the Standard Model (SM) include the production of neutral, weakly-coupled
and long-lived particles that can decay to final states containing several hadronic jets. These
long-lived particles occur in many models such as Gauge Mediated Supersymmetry Breaking
(GSMB) [
1
], the Minimal Supersymmetric Standard Model (MSSM) with R-parity violation [
2
],
inelastic dark matter [
3
] and Hidden Valley (HV) scenarios [
4
–
6
]. Such neutral particles with a
potentially long decay path present a trigger and reconstruction challenge for the LHC detectors in
that they have no detector activity connecting them to the primary interaction point (IP).
Depend-ing on the kinematics of the production mechanism and the masses of the parent and long-lived
objects, these events may be displaced in time from the events selected by the standard triggers.
In this paper we discuss the signature-driven triggers developed by the ATLAS Collaboration to
select these events. To evaluate these triggers we use as a benchmark an HV scenario, in which the
SM is weakly coupled, by a heavy communicator particle, to a hidden sector that includes a neutral
pseudoscalar pion, π
v. The π
vcan have a long lifetime resulting in decays far from the IP. One
of these triggers was successfully used for the recently published search for a light Higgs boson
decaying to long-lived neutral particles [
7
].
Section 2 describes the ATLAS detector and trigger system, section 3 discusses the benchmark
model and the decay signatures, sections 4–6 describe the long-lived neutral particle triggers,
sec-tion 7 presents trigger performance on simulated events and secsec-tion 8 discusses trigger performance
in the 2012 data-taking period.
2013 JINST 8 P07015
2
The ATLAS detector
ATLAS is a multi-purpose detector [
8
] consisting of an inner tracking system (ID) embedded in a
superconducting solenoid, electromagnetic (ECal) and hadronic (HCal) calorimeters and a muon
spectrometer (MS) with three air-core toroidal magnetic fields. The ID consists of a silicon pixel
detector, a silicon strip detector (semiconductor tracker, SCT) and a straw tube tracker (transition
radiation tracker, TRT) and provides precision tracking of charged particles for | η | ≤ 2.5.
1The ID
extends from a radius, r, of 0.05 m to 1.1 m and in |z| to 3.5 m. The ECal and HCal systems cover
the region |η| ≤ 4.9 and have a thickness of 9.7 interaction lengths at η = 0. In the region |η| ≤ 3.2
electromagnetic calorimetry is provided by barrel and end-cap high-granularity lead/liquid-argon
(lead/LAr) electromagnetic calorimeters. An additional thin LAr presampler covering |η| ≤ 1.8 is
used to correct for energy loss in the material upstream of the calorimeters. Hadronic calorimetry
is provided by a steel/scintillator tile calorimeter that is segmented into three barrel structures for
|η| ≤ 1.7 and two copper/LAr hadronic end-cap calorimeters that extend the coverage to |η| ≤ 3.2.
The solid angle coverage is completed up to |η| ≤ 4.9 with forward calorimeter modules optimized
for both electromagnetic and hadronic measurements. The ECal extends from r of 1.5 m to 2.0 m in
the barrel and from |z| of 3.6 m to 4.25 m in the end-caps. The HCal covers the region r from 2.25 m
to 4.25 m in the barrel and |z| from 4.3 m to 6.05 m in the end-caps. The MS provides trigger and
momentum measurements for charged particles entering the spectrometer. It consists of one barrel
and two end-caps, each with 16 sectors, equipped with fast detectors for triggering and precision
tracking chambers, monitored drift tubes (MDT) and cathode strip chambers (CSC). In the MS
barrel region, tracks are measured in chambers arranged in three cylindrical layers around the beam
axis; in the transition and end-cap regions, the chambers are installed in planes perpendicular to the
beam, also in three layers. An air-core toroidal field allows accurate charged particle reconstruction
independent of the ID information. For triggering, three stations of resistive plate chambers (RPC)
and thin gap chambers (TGC) are used in the MS barrel and end-caps, respectively. The first two
RPC stations are located at a radius of 7 m (large sectors
2) and 8 m (small sectors) with a separation
of 0.5 m; the third station is at a radius of 9 m (large sectors) and 10 m (small sectors). In the
end-caps the first TGC station is located at |z| = 13 m and the other two at 14 m with a separation of
0.5 m.
The trigger system has three levels [
9
]. The first level (L1) is a hardware-based system using
information from the calorimeter and the muon detectors. The second (L2) and third (Event Filter,
EF) levels are software-based systems using information from all of the ATLAS detectors.
To-gether, L2 and EF are called the High Level Trigger (HLT). The L1 trigger uses information based
on relatively coarse data from the calorimeters and the muon trigger stations. The L1 thresholds
are applied to transverse energy (E
T) for calorimeter-based triggers and transverse momentum (p
T)
for muon triggers. The L1 trigger identifies Regions of Interest (RoIs), which are (η,φ ) regions
of the detector associated to a specific physics signature. RoIs are widely used in the subsequent
1The ATLAS reference system is a cartesian right-handed coordinate system, with the nominal collision point at
the origin. The anti-clockwise beam direction defines the positive z-axis, with the x-axis pointing to the centre of the LHC ring. The angle φ defines the direction in the plane (x, y) transverse to the beam. The pseudorapidity is given by η = − ln tan(θ /2), where the polar angle θ is taken with respect to the positive z direction.
2The barrel chamber system is subdivided into large (between the magnet coils) and small (inside the magnet coils)
2013 JINST 8 P07015
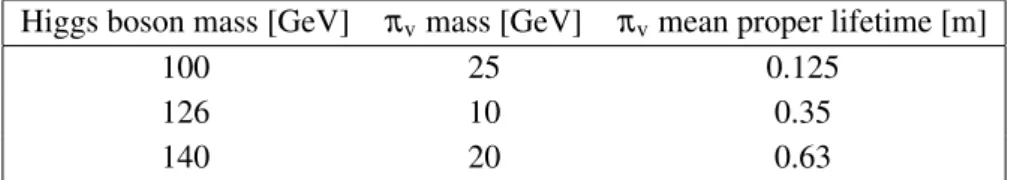
Table 1. Mass and mean proper lifetime parameters for the simulated benchmark models.
Higgs boson mass [GeV]
π
vmass [GeV]
π
vmean proper lifetime [m]
100
25
0.125
126
10
0.35
140
20
0.63
trigger levels to reduce the amount of data read from the detector readout buffers while accessing
the full information for the most important part of the event.
The L1 muon trigger logic is implemented in similar ways for both the RPC and TGC systems.
Each of the three planes of the RPC system and the two outermost planes of the TGC system consist
of a doublet of independent detector layers while the first TGC plane contains three detector layers.
A low-p
Tmuon RoI is generated by requiring a coincidence of hits in at least three of the four
layers of the two inner RPC planes for the barrel and of the two outer TGC planes for the end-caps.
A high-p
Tmuon RoI requires additional hits in at least one of the two layers of the outer RPC plane
for the barrel and in two of the three layers of the innermost TGC layer for the end-caps. The muon
RoIs have a spatial extent of 0.2 in ∆η and ∆φ in the MS barrel and 0.1 in the MS end-caps. Only
the two highest-p
TRoIs per MS sector are used by the HLT.
The L1 calorimeter trigger provides the capability to search for trigger objects such as
elec-trons, photons, τ leptons, jets and transverse energy based on information from the calorimeter
elements within projective regions, called trigger towers. The trigger towers have a size of
approx-imately 0.1 in ∆η and ∆φ in the central part of the calorimeter, | η | < 2.5, and are larger and less
uniform in the more forward region.
3
Benchmark model and decay signature
An HV model with a light Higgs mediator is used to evaluate the ATLAS detector response to
highly displaced decays to hadronic jets. Three different Monte Carlo (MC) simulation samples
are used for this study. In each sample, a Higgs boson is produced via gluon fusion and decays
to a pair of long-lived π
vparticles. Because the π
vis a pseudoscalar, it decays predominantly to
heavy fermions, bb, cc and τ
+τ
−in the ratio 85:5:8, as a result of the helicity suppression of the
low-mass fermion anti-fermion pairs.
3The parameters used to generate the samples are summarized in table
1
. The mean proper
lifetime values are chosen to maximize the number of simulated π
vdecays for all of the ATLAS
de-tectors. The masses are chosen to give a range of β (speed relative to the speed of light in vacuum)
distributions of the π
vparticles in order to study trigger timing and correct bunch crossing
iden-tification. The events are generated at a center-of-mass energy of 8 TeV using Pythia 8.165 [
10
].
The MSTW 2008 leading order parameterization [
11
] is used for the parton distribution functions
in the proton. The mean value of hµi used in the simulation is 22 and the distribution follows
the predicted conditions for the 2012
√
s
= 8 TeV data, which ranged in instantaneous luminosity
3Hidden sector scalars that couple to the SM via their mixings with the Higgs boson have Yukawa interactions with
fermions and anti-fermions and these couplings are proportional to the fermion masses; therefore, these scalars decay in a similar way to the pseudoscalar πvparticles.
2013 JINST 8 P07015
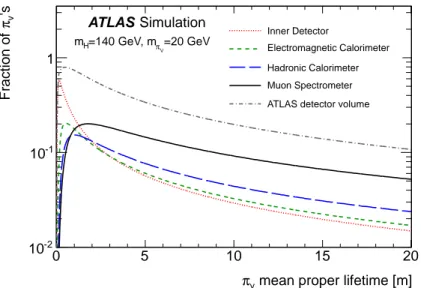
mean proper lifetime [m] v π 0 5 10 15 20 'sv π Fraction of -2 10 -1 10 1 ATLAS Simulation =20 GeV V π =140 GeV, m H m Inner Detector Electromagnetic Calorimeter Hadronic Calorimeter Muon Spectrometer ATLAS detector volume
Figure 1. The probability of a πvto decay in the ID (beyond the second layer of the pixel detector), ECal, HCal, MS and the whole ATLAS detector as a function of the πvmean proper lifetime (cτ) for | η | < 2.5. The sample with mH= 140 GeV and mπv= 20 GeV is used.
from approximately 2 to 7 × 10
33cm
−2s
−1. The quantity µ is a measure of the average number of
inelastic interactions per bunch crossing and hµi, the average value over all proton bunches, gives
the average number of expected proton-proton collisions per event.
Figure
1
shows the probability for a π
vto decay in the barrel and end-caps fiducial regions of
the ATLAS detector as a function of the π
vmean proper lifetime. There is a substantial probability
(greater than 10%) for decays to occur in the ATLAS detector volume for a wide range of mean
proper lifetimes. For example, with a mean proper lifetime of 2 m the total fraction of π
vdecays in
the ATLAS detector is 58%, of which 13% are in the ID, 12% are in the ECal, 13% are in the HCal
and 20% are in the MS.
With the exception of the novel triggers described in this paper, the ATLAS triggers were
designed to select physics objects originating at (or near) the IP. Events with long-lived particles
present many challenges for the trigger system: for example, muons from π
vdecays do not have
associated tracks in the ID, while jets from π
vdecays may have relatively low energy, not have the
usual pattern of energy deposition and arrive later than expected. Typical signatures of π
vdecays
to hadronic jets occurring in the ID, HCal and MS are shown in figures
2
(a) and
2
(b).
In order to improve the trigger efficiency, a set of signature-driven triggers were developed
to select events based on the detector signature of the displaced hadronic jets. Three regions of
the detector are considered: decays beyond the pixel layers to the ECal, decays in the HCal and
decays from the end of the HCal to the MS middle station. For each of these regions a unique decay
signature exists that can be exploited to select events with displaced decays in the region |η| < 2.5
for which tracking information is available.
2013 JINST 8 P07015
A
mean proper lifetime [m]
v π 0 5 10 15 20 decaysv π Fraction of -2 10 -1 10 1 ATLAS Simulation =20 GeV V π =140 GeV, m H m Inner detector Electromagnetic calorimeter Hadronic calorimeter Muon spectrometer (a)
C
B
mean proper lifetime [m]
v π 0 5 10 15 20
decays
vπ
Fraction of
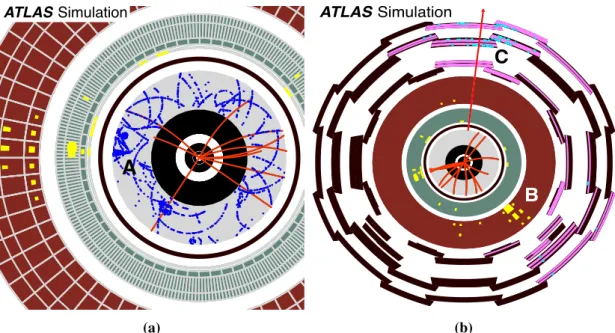
-2 10 -1 10 1 ATLAS Simulation =20 GeV V π =140 GeV, m H m Inner detector Electromagnetic calorimeter Hadronic calorimeter Muon spectrometer (b)Figure 2. Event displays of two simulated H → πvπvevents with different πvdecay signatures to hadronic jets. The sample with mH= 140 GeV and mπv = 20 GeV is used. The ATLAS detectors are depicted in
different colours: black for the pixel detector and the SCT, light gray for the TRT, green for the ECal, red for the HCal and again black for the MS. The solenoid and the pre-sampler calorimeter are shown as the black and green rings between the ID and the ECal. (a) Event display with one πvdecay in the ID (A). The display focuses on the innermost part of the ATLAS detector. TRT hits clearly indicate the presence of a displaced decay on the left side of the detector, matching well with the energy deposited in the ECal. (b) Event display with one πvdecay in the HCal (B) with the signature of little activity in the ID and a jet with all of the energy deposit in the HCal and a second decay in the MS (C). The RPC hits are displayed as sky-blue dots and the MDT hits as pink lines. The red arrow indicates the direction of the missing transverse momentum that correctly points towards the πvdecay in the MS.
4
Decays in the inner detector and electromagnetic calorimeter
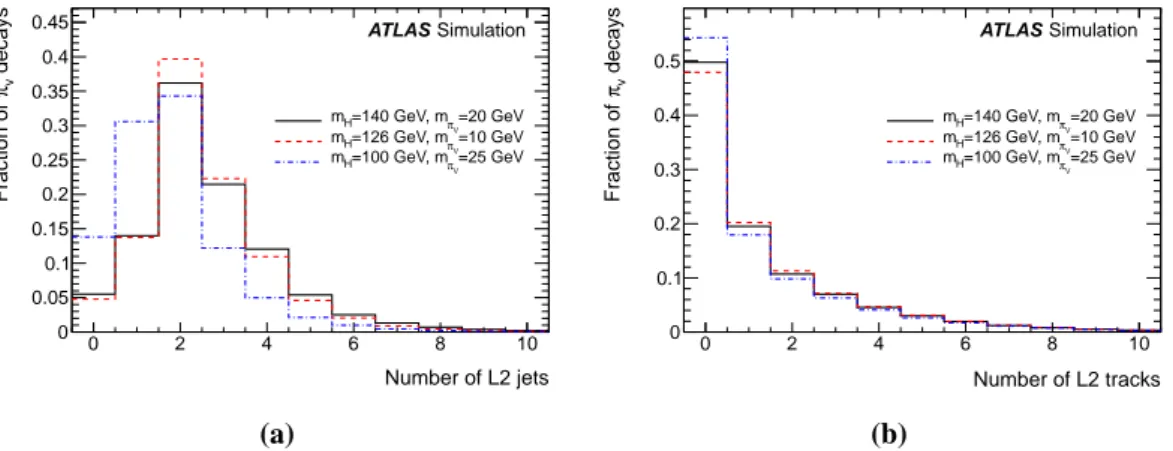
A decay topology with two jets characterizes most of the events where both π
vdecays are in
the ECal volume, as shown in figure
3
(a). Decays that occur beyond the pixel detector produce
jets that have no tracks reconstructed by the L2 track reconstruction algorithm. This results in
a characteristic signature of a jet isolated with respect to tracks in the ID. A large fraction of
jets originating from π
vdecays beyond the pixel detector have no reconstructed tracks with p
T>
0.8 GeV in a region of (0.2 × 0.2) in (∆η × ∆φ ) centred on the jet axis, as can be seen in figure
3
(b).
A jet fulfilling these requirements is defined as a “trackless jet”.
The trackless jet signature provides a powerful handle for identifying jets from displaced
de-cays. Because tracking is not available until the HLT, a different approach is necessary to get a
sustainable L1 output rate while not compromising the signal efficiency. In signal events there is
a ∼ 40% probability to produce a muon in the final state. Thus, the multi-jet background can be
2013 JINST 8 P07015
Number of L2 jets 0 2 4 6 8 10 decaysv π Fraction of 0 0.05 0.1 0.15 0.2 0.25 0.3 0.35 0.4 0.45 ATLAS Simulation =20 GeV V π =140 GeV, m H m =10 GeV V π =126 GeV, m H m =25 GeV V π =100 GeV, m H m (a) Number of L2 tracks 0 2 4 6 8 10 decaysv π Fraction of 0 0.1 0.2 0.3 0.4 0.5 ATLAS Simulation =20 GeV V π =140 GeV, m H m =10 GeV V π =126 GeV, m H m =25 GeV V π =100 GeV, m H m (b)Figure 3. (a) Number of reconstructed jets at L2 with ET> 25 GeV and | η | < 2.5 in events where both πvdecays are beyond the pixel detector and before the HCal volume. (b) Number of reconstructed tracks in the ID at L2 with pT> 0.8 GeV in a (0.2 × 0.2) region in (∆η × ∆φ ) around the jet axis of a L2 jet with ET> 25 GeV and | η | < 2.5 in events where both πvdecays are beyond the pixel detector and before the HCal volume.
significantly reduced by requiring the muon to be contained within the jet cone. In multi-jet events
produced via SM processes, the muon will typically be prompt and thus leave a track in the ID,
while in π
vevents the muon is produced close to the π
vdecay vertex and can be highly displaced
from the IP. Requiring both a jet trigger item and a muon trigger item at L1 is therefore a good
handle for limiting the L1 output rate. The two objects are required to be in the same detector
region at L2 and to be isolated with respect to tracks reconstructed in the ID.
The Trackless Jet trigger implementation requires a muon with p
T> 10 GeV and a jet with
E
T> 20 GeV at L1. The L2 jet and muon reconstruction algorithms are then employed in the
corresponding RoIs to confirm and refine the physics objects identified at L1. Because the particles
from displaced decays do not have reconstructable tracks in the ID, the L2 muon reconstruction
algorithm is restricted to run only in the MS. The criteria at L2 are p
T> 10 GeV for the muon and
E
T> 25 GeV for the jet, where the calorimeter response is calibrated at the electromagnetic (EM)
scale, which is tuned to correctly measure the energy of EM showers. A combinatorial algorithm
performs a geometrical matching in a ∆R ≡
p(∆η)
2+ (∆φ )
2= 0.4 region between the muon and
jet objects. The final criterion of no tracks in the ID with p
T> 0.8 GeV in a (0.2 × 0.2) region
in (∆η × ∆φ ) around the jet direction is made at L2. No further selection is applied at the EF. A
schematic diagram of the sequence of algorithms employed in the Trackless Jet trigger is depicted
in figure
4
(a).
5
Decays in the hadronic calorimeter
Decays of neutral particles in the outer layers of the ECal or in the HCal result in little or no energy
deposited in the ECal (figure
2
) and consequently in an anomalously large value of the hadronic
to electromagnetic energy ratio, E
HAD/E
EM, of the jet. Since the neutral π
vhas travelled through
the tracking volume without interacting before decaying in the calorimeter, no reconstructed tracks
connecting the jet to the primary IP are expected. Another feature of this topology is that the pair
2013 JINST 8 P07015
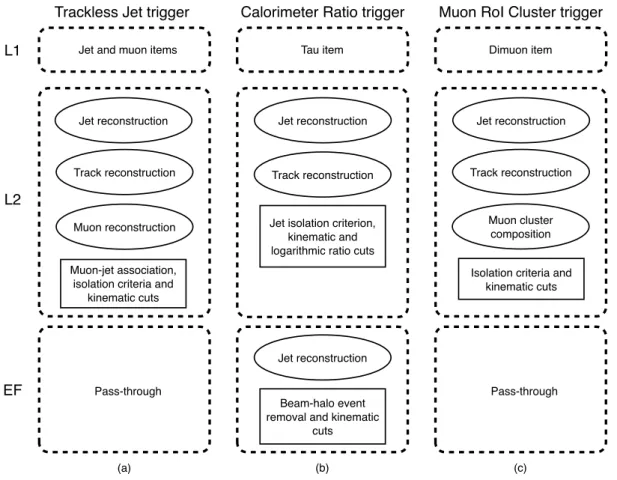
Jet and muon itemsL1 L2 Muon reconstruction Track reconstruction Jet reconstruction Muon-jet association, isolation criteria and
kinematic cuts Pass-through EF Tau item Track reconstruction Jet reconstruction
Jet isolation criterion, kinematic and logarithmic ratio cuts
Jet reconstruction
Beam-halo event removal and kinematic
cuts Dimuon item Track reconstruction Jet reconstruction Muon cluster composition
Isolation criteria and kinematic cuts
Pass-through
Trackless Jet trigger Calorimeter Ratio trigger Muon RoI Cluster trigger
(a) (b) (c)
Figure 4. Schematic diagrams of the sequence of trigger algorithms used to select long-lived neutral particles decaying throughout the ATLAS detector volume: Trackless Jet trigger (a), Calorimeter Ratio trigger (b) and Muon RoI Cluster trigger (c). The ovals represent trigger algorithms to reconstruct features while rectangles represent trigger algorithms that apply cuts using the reconstructed features.
of hadronic jets doesn’t have time to spatially separate before depositing its energy in the HCal
and this results in a very narrow single jet being reconstructed. The “Calorimeter Ratio trigger” is
designed to select this signature.
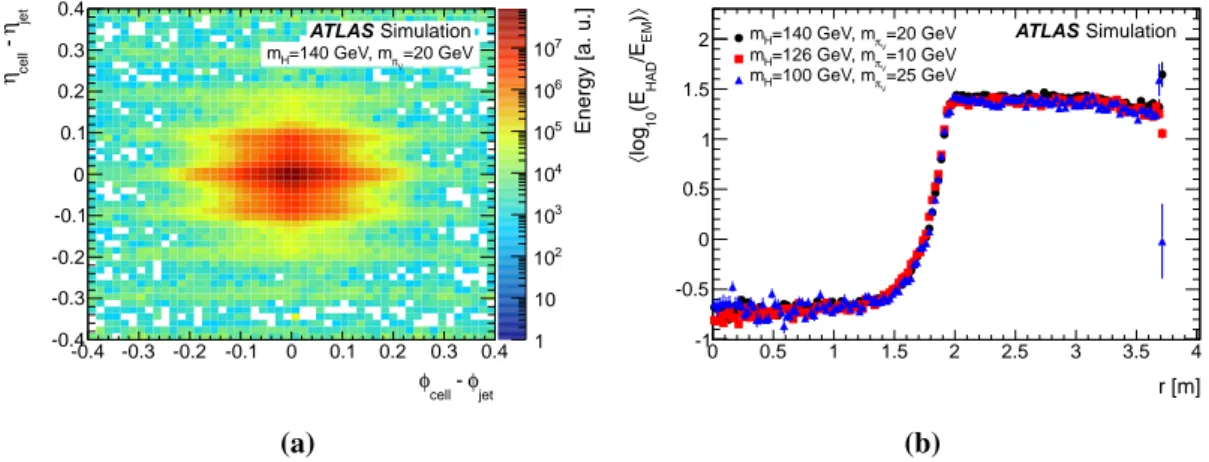
As can been seen in figure
5
(a), almost all of the energy from jets originating from π
vdecays
in the HCal is contained within a cone of ∆R = 0.1 around the jet axis. For this reason, a L1
τ -lepton trigger is preferable to a L1 jet trigger because the latter selects events in a (∆η × ∆φ )
region of (0.4×0.4) while the former selects, by design, jets with energy contained in a region of
(0.2×0.2), which better matches the narrow jets produced when a π
vdecays in the HCal. The
τ-lepton triggers also have a lower energy threshold than the jet triggers, resulting in an increase of
the signal efficiency relative to the multi-jet background acceptance. Figure
5
(b) shows the mean
value of the log
10(E
HAD/E
EM) distribution for all L2 jets from π
vdecays in the barrel calorimeter
as a function of the π
vradial decay distance. As the π
vdecays close to the end of the ECal, the
logarithmic ratio changes from a characteristic negative value to a positive value. The average value
of log
10(E
HAD/E
EM) plateaus at ∼ 1.5 for radii between ∼ 1.9 m and ∼ 3.6 m, at which point the π
v2013 JINST 8 P07015
Energy [a. u.]
1 10 2 10 3 10 4 10 5 10 6 10 7 10 jet φ - cell φ -0.4 -0.3 -0.2 -0.1 0 0.1 0.2 0.3 0.4 jet η - cell η -0.4 -0.3 -0.2 -0.1 0 0.1 0.2 0.3 0.4 ATLAS Simulation =20 GeV V π =140 GeV, m H m (a) r [m] 0 0.5 1 1.5 2 2.5 3 3.5 4 〉 ) EM /E HAD (E 10 log 〈 -1 -0.5 0 0.5 1 1.5
2 πV=20 GeV ATLAS Simulation
=140 GeV, m H m =10 GeV V π =126 GeV, m H m =25 GeV V π =100 GeV, m H m (b)
Figure 5. (a) Energy deposition in the calorimeter cells around the jet axis (0,0) for πvdecays in the HCal. (b) Mean value of log10(EHAD/EEM) for all L2 jets in the barrel calorimeter coming from πvdecays as a function of the πvradial decay distance, r.
the log
10(E
HAD/E
EM) distribution beyond 2 m is 0.35. Because jets with log
10(E
HAD/E
EM) > 1.2
are produced by π
vdecays in the calorimeter, the ID should not contain any tracks pointing to
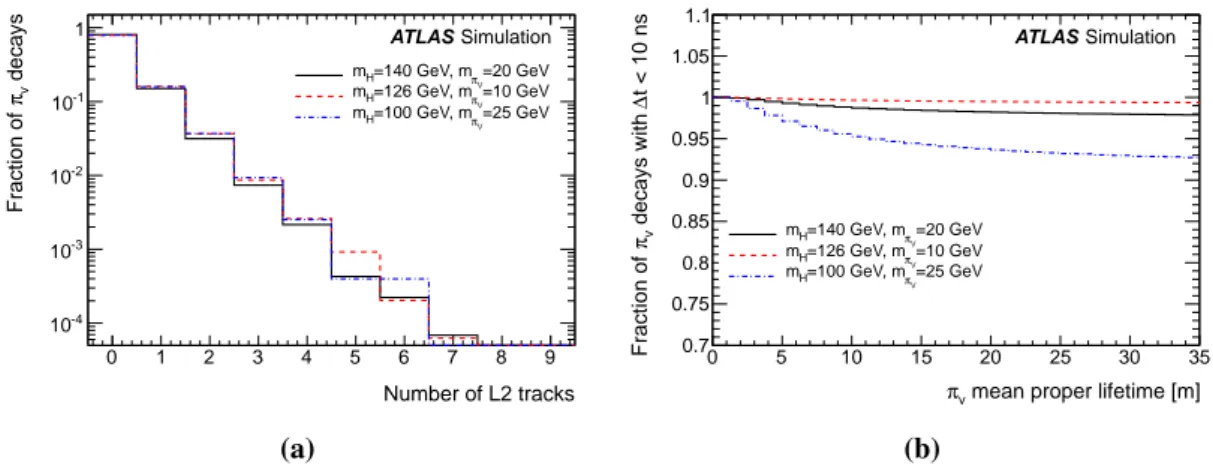
a signal jet. The result of applying the L2 tracking algorithm is that about 80% of the jets with
log
10(E
HAD/E
EM) > 1.2 have no tracks with p
T> 1 GeV reconstructed in a region of (0.2×0.2) in
(∆η × ∆φ ) around the jet axis, as shown in figure
6
(a).
The π
vparticles from Higgs decay have β < 1 and arrive in the calorimeter later than a β = 1
particle. The signal peak amplitude is thus shifted later in time, and this affects the raw energy
measurement. The online Optimal Filtering Algorithm [
12
] determines this time shift and provides
a corrected energy at L2 that is within 1% of the true energy for time shifts of up to 12 ns [
13
].
Figure
6
(b) from the ATLAS simulation of the calorimeter trigger, which incorporates the Optimal
Filtering Algorithm and energy correction algorithms, shows that for the m
Hand m
πvcombinations
considered, more than 93% of the π
vdecays in the HCal have a time shift of less than 10 ns for a
broad range of mean proper lifetimes.
Beam-halo muons that undergo bremsstrahlung as they traverse the HCal are a potential source
of background for the Calorimeter Ratio trigger. If an energetic bremsstrahlung radiation is emitted
by the muon in the HCal, the L1 trigger logic interprets this energy deposit as a jet and the event
is passed to L2; no energy is found in the ECal and therefore the event is accepted at L2. In order
to discard these events, an additional algorithm, exploiting the non-collision-like timing signature
in the HCal, is implemented in the EF of the Calorimeter Ratio trigger. If at least three HCal cells
with E > 240 MeV are found with a difference in timing of 5 ns with respect to a particle travelling
at β = 1, the event is rejected. Only cells within |∆φ | < 0.2 and ∆R > 0.3 from the leading jet axis
are considered. The removal of beam-halo muons reduces the Calorimeter Ratio trigger rate by
almost 50% without compromising the signal acceptance.
The Calorimeter Ratio trigger is built by requiring a τ-lepton object with E
T> 40 GeV at L1.
The threshold at 40 GeV corresponds to the lowest unprescaled L1 τ-lepton item used during data
taking in 2012. The L2 jet and track reconstruction algorithms are then employed using the L1
τ-lepton RoI as input. The L2 reconstructed jet is required to have E
T> 30 GeV, with the calorimeter
2013 JINST 8 P07015
Number of L2 tracks 0 1 2 3 4 5 6 7 8 9 decaysv π Fraction of -4 10 -3 10 -2 10 -1 10 1 ATLAS Simulation =20 GeV V π =140 GeV, m H m =10 GeV V π =126 GeV, m H m =25 GeV V π =100 GeV, m H m (a)mean proper lifetime [m]
v π 0 5 10 15 20 25 30 35 t < 10 ns ∆ decays with v π Fraction of 0.7 0.75 0.8 0.85 0.9 0.95 1 1.05 1.1 ATLAS Simulation =20 GeV V π =140 GeV, m H m =10 GeV V π =126 GeV, m H m =25 GeV V π =100 GeV, m H m (b)
Figure 6. (a) Distribution of the number of reconstructed tracks in the ID at L2 with pT> 1 GeV in a (0.2 × 0.2) region in (∆η × ∆φ ) around the jet axis of a L2 jet with log10(EHAD/EEM) > 1.2 and | η | < 1.5 in events where the πvdecays in the HCal. (b) Fraction of πvdecays in the HCal with a delay of ∆t < 10 ns as a function of the πvmean proper lifetime.
response calibrated at the EM scale. Two additional criteria are applied: that there be no tracks with
p
T> 1 GeV reconstructed in a (0.2 × 0.2) region in (∆η × ∆φ ) around the jet direction and that the
jet log
10(E
HAD/E
EM) > 1.2. At the EF, the standard anti-k
tjet-finding algorithm [
14
] is added to
refine the jet object properties and E
T> 35 GeV is required. The final criterion removes beam-halo
events. A schematic diagram of the sequence of algorithms employed in the Calorimeter Ratio
trigger is depicted in figure
4
(b).
6
Decays in the muon spectrometer
Decays occurring at the outermost regions of the HCal or in the MS result in a large number of
charged hadrons traversing a narrow region of the MS. These events are characterized by a cluster
of L1 muon RoIs centred around the π
vline of flight.
Figures
7
(a) and
7
(b) show the total number of muon RoIs found in events with a π
vdecaying
in the MS barrel or end-caps. Larger RoI multiplicities are found in the end-caps because the muon
RoIs have a spatial extent of 0.1 in ∆η and ∆φ in the end-caps compared to 0.2 in the barrel.
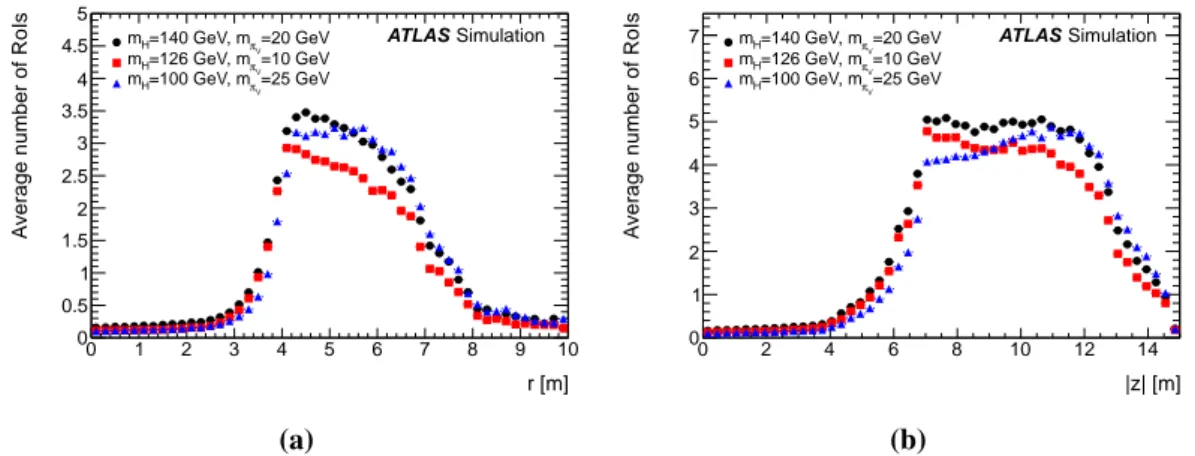
Figures
8
(a) and
8
(b) show the average number of L1 muon RoIs contained in a cone of ∆R = 0.4
around the π
vline of flight as a function of the π
vradial decay distance in the MS barrel and as a
function of the |z| decay coordinate in the MS end-caps. Figure
8
illustrates that a π
vdecaying in
the MS results in a mean value of approximately three RoIs and from four to five RoIs clustered
around the π
vline of flight in the barrel and in the end-caps, respectively. The mean number of
RoIs in the MS barrel is less than three RoIs for the sample with m
H= 126 GeV and m
πv= 10 GeV
due to the higher π
vboost, which leads to narrower jets in the MS. For π
vdecays close to the end
of the HCal (r ∼ 4 m in the barrel and |z| ∼ 6 m in the end-caps), the average number of muon
RoIs contained in the cone increases rapidly due to the charged-particle tracks from the π
vdecay
passing through the calorimeter and entering the MS. Once the π
vdecays occur in the MS, the
number of RoIs remains approximately constant until the π
vdecays are close to the muon trigger
2013 JINST 8 P07015
Number of RoIs 0 2 4 6 8 10 decaysv π Fraction of -3 10 -2 10 -1 10 1 10 ATLAS Simulation =20 GeV V π =140 GeV, m H m =10 GeV V π =126 GeV, m H m =25 GeV V π =100 GeV, m H m (a) Number of RoIs 0 2 4 6 8 10 decaysv π Fraction of -3 10 -2 10 -1 10 1 10 ATLAS Simulation =20 GeV V π =140 GeV, m H m =10 GeV V π =126 GeV, m H m =25 GeV V π =100 GeV, m H m (b)Figure 7. Distribution of the total number of RoIs found in events with a πvdecaying in (a) the MS barrel and (b) the MS end-caps.
r [m] 0 1 2 3 4 5 6 7 8 9 10 A v e ra g e n u m b e r o f R o Is 0 0.5 1 1.5 2 2.5 3 3.5 4 4.5 5 ATLAS Simulation =20 GeV V π =140 GeV, m H m =10 GeV V π =126 GeV, m H m =25 GeV V π =100 GeV, m H m (a) |z| [m] 0 2 4 6 8 10 12 14 A v e ra g e n u m b e r o f R o Is 0 1 2 3 4 5 6
7 =20 GeV ATLAS Simulation
V π =140 GeV, m H m =10 GeV V π =126 GeV, m H m =25 GeV V π =100 GeV, m H m (b)
Figure 8. Average number of L1 muon RoIs in a cone of ∆R = 0.4 around the πvline of flight as a function of (a) the πvradial decay position, r, in the MS barrel and (b) the |z| coordinate of the πvdecay in the MS end-caps.
not spatially separated enough to give multiple, unique RoIs. Moreover, decays occurring beyond
the first trigger plane do not give RoIs because hits are required in both the first and second trigger
planes.
A cluster of muon RoIs is defined as a ∆R = 0.4 radius region in the MS barrel (end-caps)
containing at least three (four) muon RoIs. This characteristic signature is exploited at the HLT
to select events with π
vdecays at the outermost regions of the HCal or in the MS. The SM
back-grounds from punch-through jets and bremsstrahlung from muons can be suppressed by requiring
the RoI cluster to be isolated with respect to both calorimeter jets and tracks in the ID.
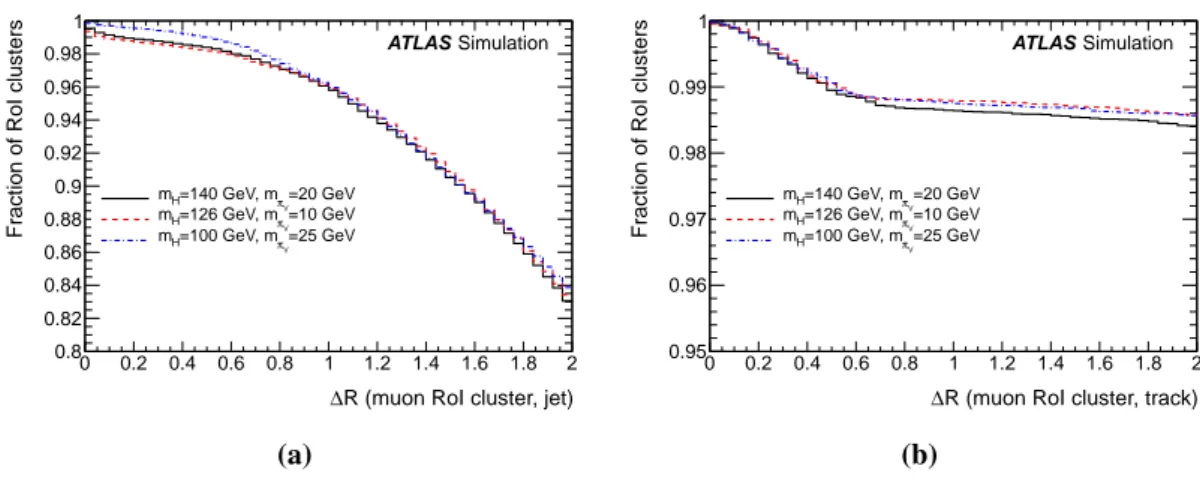
Figure
9
(a) shows the fraction of events accepted as a function of the ∆R distance from the
nearest jet to the RoI cluster centre in signal events. The acceptance is relatively flat up to values
of ∆R ∼ 0.7. Requiring the muon RoI cluster to be isolated from jets within ∆R < 0.7 results in a
signal loss of less than ∼ 3%. It should be noted that the RoI cluster is only required to be isolated
from jets that have log
10(E
HAD/E
EM) < 0.5 in order to increase the signal efficiency for events in
which the π
vdecays at the end of the HCal, depositing energy and thus producing both a jet with
2013 JINST 8 P07015
R (muon RoI cluster, jet)
∆
0 0.2 0.4 0.6 0.8 1 1.2 1.4 1.6 1.8 2
Fraction of RoI clusters
0.8 0.82 0.84 0.86 0.88 0.9 0.92 0.94 0.96 0.98 1 ATLAS Simulation =20 GeV V π =140 GeV, m H m =10 GeV V π =126 GeV, m H m =25 GeV V π =100 GeV, m H m (a)
R (muon RoI cluster, track)
∆
0 0.2 0.4 0.6 0.8 1 1.2 1.4 1.6 1.8 2
Fraction of RoI clusters
0.95 0.96 0.97 0.98 0.99 1 ATLAS Simulation =20 GeV V π =140 GeV, m H m =10 GeV V π =126 GeV, m H m =25 GeV V π =100 GeV, m H m (b)
Figure 9. Fraction of RoI clusters accepted in signal events as a function of ∆R between (a) the centre of the RoI cluster and the jet direction for L2 jets with log10(EHAD/EEM) < 0.5 and (b) the centre of the RoI cluster and the track direction for L2 tracks with pT> 5 GeV.
Figure
9
(b) shows the fraction of events accepted at L2 as a function of ∆R between the centre
of the RoI cluster and the nearest track in the ID with p
T> 5 GeV. Because the π
vparticles are
both long lived, high-p
Ttracks are not expected to be reconstructed in the ID. The acceptance is
found to be approximately constant across a wide range of ∆R values. Requiring isolation within a
region of ∆R < 0.4 results in an acceptance loss of less than ∼ 1%.
The timing of the L1 muon trigger is centred on the arrival time of the bunch crossing in
ATLAS, so that the trigger is active for 12.5 ns before and 12.5 ns after the bunch crossing. To
ensure that the Muon RoI Cluster trigger is associated with the correct bunch crossing, the critical
parameter to examine is the time delay between π
vdecays in the MS and a particle produced in the
same interaction travelling with β = 1. The π
vdecay products have β ' 1. Thus, in determining
the time delay between the π
varrival and a β = 1 particle, only the distance the π
vtravels from the
IP to the decay point needs to be considered.
The efficiency of the RPC trigger was measured, as a function of the time shift ∆t, in a test
beam [
15
]. The RPC time resolution has also been measured for the 2011 data and found to be in
good agreement with the test beam results. The L1 muon trigger accurately matches events to their
bunch crossings for time delays of less than approximately 6 ns. Time delays beyond 6 ns result
in some of the triggers being associated with the next bunch crossing in a predictable Gaussian
manner. If the trigger signal from the π
vis not associated with the correct bunch crossing, the event
is lost.
The expected online acceptance of the L1 trigger in the barrel MS for the three benchmark
mass points can be calculated
4from the measured bunch-crossing identification efficiency, given
in ref. [
15
], and the β distribution of the π
v. The results are shown in table
2
for π
vparticles emitted
at η = 0 and |η| = 1. Similar results are obtained for the trigger system in the end-caps. The table
also gives the trigger acceptances obtained from the simulation, which are systematically shifted to
larger values because in the barrel trigger simulation at L1 there is a time shift of plus 3.125 ns (one
4The distances to the first muon trigger plane are used for the calculation of the online quantities: L = 7 m and
2013 JINST 8 P07015
mean proper lifetime [m]v π 0 5 10 15 20 25 30 35 t < 6 ns ∆ decays with v π Fraction of 0.6 0.65 0.7 0.75 0.8 0.85 0.9 0.95 1 1.05 ATLAS Simulation =20 GeV V π =140 GeV, m H m =10 GeV V π =126 GeV, m H m =25 GeV V π =100 GeV, m H m
Figure 10. Fraction of πvdecays producing a Muon RoI Cluster trigger associated with the correct bunch crossing as a function of the πvmean proper lifetime.
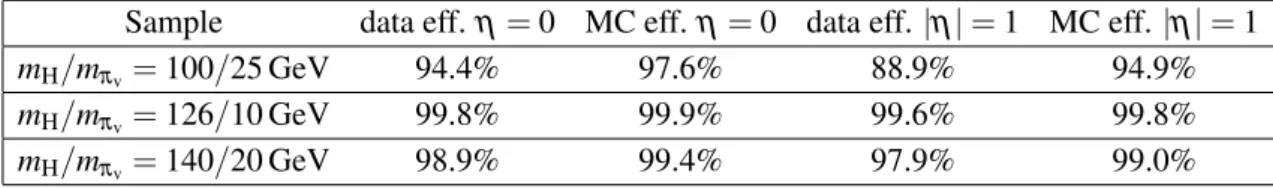
Table 2. The probability of associating πvparticles emitted at η = 0 and |η| = 1 with the correct bunch crossing for both simulation and data for the three benchmark samples. The statistical uncertainties are negligible.
Sample
data eff. η = 0 MC eff. η = 0 data eff. |η| = 1 MC eff. |η| = 1
m
H/m
πv= 100/25 GeV
94.4%
97.6%
88.9%
94.9%
m
H/m
πv= 126/10 GeV
99.8%
99.9%
99.6%
99.8%
m
H/m
πv= 140/20 GeV
98.9%
99.4%
97.9%
99.0%
least count) with respect to the online trigger. As a consequence, the simulation has a correctable,
systematically higher acceptance for late trigger signals as shown in table
2
for the three benchmark
samples. Analyses using this trigger will need to calculate the corrected efficiency.
Figure
10
shows the fraction of π
vdecays in the MS with a ∆t of less than 6 ns as a function
of the π
vmean proper lifetime. These are decays that could produce a trigger associated with the
correct bunch crossing. The π
vis associated with the correct bunch crossing with an efficiency
greater than 75% for the m
H= 100 GeV and m
πv= 25 GeV sample and with an efficiency greater
than 94% for the other mass points. When the mean proper decay length is small compared to
the detector dimensions, only very boosted π
vparticles have non-negligible probability to decay
in the MS. As the mean proper decay length increases, those π
vparticles with a smaller boost
begin to have some probability to decay in the MS. When the mean proper decay length becomes
comparable to the ATLAS detector dimensions all the π
vparticles have roughly equal probability
to decay in the MS.
The Muon RoI Cluster trigger is built by requiring two muons with p
T> 10 GeV at L1. A
cluster of muon RoIs is required at L2 for all the events passing the L1 selection. Then, the L2 jet
and track reconstruction algorithms are employed using all the jet RoIs found in the same event.
The jet isolation criterion is then applied, requiring that there be no jets within ∆R = 0.7 around the
muon RoI cluster centre with E
T> 30 GeV and log
10(E
HAD/E
EM) < 0.5, where the calorimeter
2013 JINST 8 P07015
tracks in the ID with p
T> 5 GeV within ∆R = 0.4 of the muon RoI cluster centre. No further
selection is applied at the EF. A schematic diagram of the sequence of algorithms employed in the
Muon RoI Cluster trigger is depicted in figure
4
(c).
7
Trigger efficiency on simulated events
The efficiency is defined as the fraction of π
vparticles that pass one of the triggers for displaced
decays of long-lived neutral particles as a function of the π
vdecay position. Figures
11
–
13
show the
long-lived neutral particle trigger efficiencies for the simulated mass points, with mean hµi = 22,
as a function of the π
vdecay position for decays in the barrel and end-cap regions of the ATLAS
detector. The uncertainties shown are statistical only. The Calorimeter Ratio trigger and Muon RoI
cluster triggers have good efficiency throughout the detector volume. All of the efficiencies are
lower in the forward region than in the central region. In general, this is a consequence of events
not satisfying the isolation criteria because of the higher mean occupancy in the forward region due
to pile-up interactions.
The Trackless Jet trigger is less than 5% efficient for decays occurring in the region of the
barrel between the middle of the ID and the ECal. The trigger efficiency increases as the decay
occurs closer to the end of the HCal. The dependence of the efficiency on the decay position is a
consequence of the low p
Tdistribution of muons produced by the π
vdecays. A muon originating
in the ID will lose an average of 4 GeV of energy as it traverses the ATLAS calorimeters [
16
];
therefore, a larger fraction of muons produced in π
vdecays reach the muon system as the π
vdecays
further into the calorimeter. The efficiency in the end-cap regions is ∼ 1–2%. The Calorimeter
Ratio trigger is ∼ 25% efficient for π
vdecays in the HCal barrel and 10% in the HCal end-caps.
The Muon RoI Cluster trigger in the MS barrel is ∼ 40% efficient from the end of the HCal to
r
∼ 6 m. The efficiency drops beyond a radial distance of 6 m because the jets originating from the
π
vdecay do not separate sufficiently before reaching the first muon trigger plane located at r ∼ 7 m.
The trigger efficiency in the MS end-caps is 15–25% for |z| between 7 and 12 m from the IP.
The lower efficiency of the Calorimeter Ratio trigger for the sample with m
H= 100 GeV and
m
πv= 25 GeV is due to the tight L1 energy threshold and the fact that jets produced by the π
vdecays
in this MC sample have lower energies compared to the other samples. The lower efficiency of the
Muon RoI Cluster trigger and rapid decrease with increasing decay distance for the sample with
m
H= 126 GeV and m
πv= 10 GeV is due to the higher π
vboost that results in collinear jets that
are more likely to be contained in a single MS sector. Because the L1 muon firmware is limited
to no more than two RoIs per sector, many of these decays do not satisfy the trigger condition that
requires three (four) or more RoIs in the MS barrel (end-caps). The effect is minimized if the jet
axis falls between two adjacent MS sectors.
To evaluate the effect of pile-up interactions on the trigger efficiency, the MC samples are
arbitrarily divided into two subsamples, one with hµi > 22 and one with hµi ≤ 22, with mean
hµi values of 28.6 and 15.8, respectively. Tables
3
and
4
give, for the three triggers, the ratio
of Efficiency(28.6)/Efficiency(15.8) in the barrel and end-cap detectors.
5Both the Trackless Jet
and the Calorimeter Ratio triggers show significant reduction of efficiency with increasing
pile-up in both the barrel and end-cap regions. These two triggers are particularly sensitive to pile-pile-up
2013 JINST 8 P07015
r [m] 0 1 2 3 4 5 6 7 8 9 10 T ri g g e r E ff ic ie n c y 0 0.01 0.02 0.03 0.04 0.05 0.06 ATLAS Simulation =20 GeV V π =140 GeV, m H m =10 GeV V π =126 GeV, m H m =25 GeV V π =100 GeV, m H m (a) |z| [m] 0 2 4 6 8 10 12 14 T ri g g e r E ff ic ie n c y 0 0.005 0.01 0.015 0.02 0.025 ATLAS Simulation =20 GeV V π =140 GeV, m H m =10 GeV V π =126 GeV, m H m =25 GeV V π =100 GeV, m H m (b)Figure 11. Efficiency for the Trackless Jet trigger as a function of (a) the radial decay position, r, for πv decays in the barrel and (b) the |z| position for πvdecays in the end-caps.
r [m] 0 1 2 3 4 5 6 7 8 9 10 T ri g g e r E ff ic ie n c y 0 0.05 0.1 0.15 0.2 0.25 ATLAS Simulation =20 GeV V π =140 GeV, m H m =10 GeV V π =126 GeV, m H m =25 GeV V π =100 GeV, m H m (c) |z| [m] 0 2 4 6 8 10 12 14 T ri g g e r E ff ic ie n c y 0 0.02 0.04 0.06 0.08 0.1 0.12 ATLAS Simulation =20 GeV V π =140 GeV, m H m =10 GeV V π =126 GeV, m H m =25 GeV V π =100 GeV, m H m (d)
Figure 12. Efficiency for the Calorimeter Ratio trigger as a function of (a) the radial decay position, r, for πvdecays in the barrel and (b) the |z| position for πvdecays in the end-caps.
r [m] 0 1 2 3 4 5 6 7 8 9 10 T ri g g e r E ff ic ie n c y 0 0.1 0.2 0.3 0.4 0.5 0.6 0.7 ATLAS Simulation =20 GeV V π =140 GeV, m H m =10 GeV V π =126 GeV, m H m =25 GeV V π =100 GeV, m H m (a) |z| [m] 0 2 4 6 8 10 12 14 T ri g g e r E ff ic ie n c y 0 0.05 0.1 0.15 0.2 0.25 0.3 0.35 0.4 ATLAS Simulation =20 GeV V π =140 GeV, m H m =10 GeV V π =126 GeV, m H m =25 GeV V π =100 GeV, m H m (b)
Figure 13. Efficiency for the Muon RoI Cluster trigger as a function of (a) the radial decay position, r, for πvdecays in the barrel and (b) the |z| position for πvdecays in the end-caps.
2013 JINST 8 P07015
Table 3. The ratio of the trigger efficiencies in the barrel for mean hµi = 28.6 (high pile-up sample) to mean hµi = 15.8 (low pile-up sample) for the three triggers and the three benchmark samples. The uncertainties shown are statistical only.
Sample Trackless Jet Calorimeter Ratio Muon RoI Cluster Range [m]
m
H/m
πv= 100/25 GeV
0.70 ± 0.04
0.48 ± 0.04
1.03 ± 0.03
0.4 < r < 4.0
m
H/m
πv= 126/10 GeV
0.76 ± 0.04
0.47 ± 0.02
0.95 ± 0.03
2.0 < r < 4.0
m
H/m
πv= 140/20 GeV
0.64 ± 0.02
0.50 ± 0.02
0.98 ± 0.03
4.0 < r < 7.2
Table 4. The ratio of the trigger efficiencies in the end-caps for mean hµi = 28.6 (high pile-up sample) to mean hµi = 15.8 (low pile-up sample) for the three triggers and the three benchmark samples. The uncertainties shown are statistical only.
Sample Trackless Jet Calorimeter Ratio Muon RoI Cluster Range [m]
m
H/m
πv= 100/25 GeV
0.32 ± 0.07
0.34 ± 0.06
0.93 ± 0.02
1.8 < |z| < 6.0
m
H/m
πv= 126/10 GeV
0.51 ± 0.08
0.35 ± 0.03
0.93 ± 0.02
4.2 < |z| < 6.0
m
H/m
πv= 140/20 GeV
0.39 ± 0.04
0.40 ± 0.04
0.92 ± 0.02
6.0 < |z| < 13.2
interactions because of the tight isolation criterion that requires no reconstructed tracks at L2 with
p
T> 0.8 and p
T> 1 GeV in a cone around the jet axis for the Trackless Jet and Calorimeter
Ratio triggers, respectively. The Muon RoI Cluster trigger includes a softer track isolation cut,
no reconstructed tracks at L2 with p
T> 5 GeV around the muon RoI cluster centre, and is more
robust against pile-up. No effect is observed in the barrel region while in the end-caps there is an
approximate 7% reduction. The isolation cuts represent a compromise between maximizing the
signal acceptance and reducing the final output rate to a sustainable level.
From the trigger efficiency plots, the signal fraction accepted by the long-lived neutral particle
triggers is predicted as a function of the π
vmean proper lifetime. The fraction of π
vdecays that
occur at a certain radius is weighted by the corresponding trigger efficiency for the same radius.
Figure
14
shows the expected fraction of events that pass each trigger as a function of the π
vmean
proper lifetime for m
H= 140 GeV and m
πv= 20 GeV.
All the trigger studies and efficiencies presented in this paper are based on MC simulations
and the associated uncertainties are statistical only. An analysis using one or more of these triggers
will need to make a careful study of the systematic uncertainties. While the details of the study are
analysis dependent, standard sources of systematic uncertainties include the jet energy scale, the jet
energy resolution, the modelling of hard and soft proton-proton interactions and the instantaneous
luminosity. Additional systematic uncertainty studies that focus on the physics objects used by
these triggers need to be taken into account and some examples follow.
The cluster of muon RoIs resulting from a π
vdecay in the MS is the basic physics object used
by the Muon RoI Cluster trigger. To compare the MS detector response to a π
vdecay in data and
simulation, a sample of jets that punch through the calorimeter can be used. The punch-through jets
are similar to signal events in that both low-p
Tphotons and charged hadrons are present in a narrow
region of the MS, thus the detector response to such an environment can be verified between data
and simulation. The systematic uncertainty related to the logarithmic ratio selection criteria can be
2013 JINST 8 P07015
mean proper lifetime [m] v π -1 10 1 10 decaysv π Fraction of triggered 0 0.02 0.04 0.06 0.08 0.1 0.12 ATLAS Simulation =20 GeV V π =140 GeV, m H m
Trackless Jet trigger Calorimeter Ratio trigger Muon RoI Cluster trigger
Figure 14. The expected fraction of events that pass each of the long-lived neutral particle triggers as a function of the πvmean proper lifetime.
studied by selecting a sample of jets with a small fraction of energy in the ECal and comparing the
distribution in data and simulation when applying the various cuts used in the Calorimeter Ratio
trigger. For the Trackless Jet trigger, a data sample collected with a minimum bias trigger can be
used to identify secondary vertex interactions that may mimic the decay topology of a π
vin the
ID or ECal. In general, systematic uncertainties are analysis dependent and detailed studies are
beyond the scope of this paper.
8
Triggering on collision data
These triggers need to meet tight bandwidth requirements for inclusion in the ATLAS trigger menu.
The exclusive bandwidth allocated for the long-lived neutral particle triggers is only a few Hz.
Figure
15
shows the rates as a function of instantaneous luminosity for the three triggers during
a typical 2012 data-taking period and demonstrates that the rates are well within the allocated
trigger bandwidth. The Muon RoI Cluster trigger shows a linear dependence on the instantaneous
luminosity. A linear fit, when extrapolated to null luminosity and accounting for the different
number of filled and empty bunches, predicts a rate of (0.04 ± 0.01) Hz. An analogous trigger only
enabled on empty bunch crossings gives a rate of (0.04 ± 0.03) Hz in the same data-taking period
as that displayed in figure
15
. The rates are found to be in excellent agreement, suggesting that the
Muon RoI Cluster trigger rate increases linearly as a function of the instantaneous luminosity and
there are no other dependencies affecting its rate.
The Trackless Jet and Calorimeter Ratio trigger rates show little or no dependence on the
instantaneous luminosity. As discussed in the previous section, this is the result of the tight track
isolation requirement included among the online selection cuts. The Muon RoI Cluster trigger uses
a softer track isolation requirement and its rate is determined only by the instantaneous luminosity.
More detailed studies on data are, in general, not possible since the instantaneous
luminos-ity and pile-up are correlated quantities and the LHC running conditions do not provide different
2013 JINST 8 P07015
] -1 s -2 cm 33 Inst. Luminosity [10 2 2.5 3 3.5 4 4.5 5 5.5 Rate [Hz] 0 0.2 0.4 0.6 0.8 1 1.2 1.4 1.6 1.8 2 ATLAS 26.6 〉 µ 〈 = 8 TeV, peak sTrackless Jet trigger Calorimeter Ratio trigger Muon RoI Cluster trigger
Figure 15. Trigger output rates as a function of the instantaneous luminosity during a typical 2012 data-taking period.
samples with the same instantaneous luminosity and different pile-up configurations. However,
the correlation between the track isolation criterion and the amount of pile-up in the event can be
further studied using the Muon RoI Cluster trigger. Figure
16
shows the ratio of the Muon RoI
Cluster trigger rates as a function of hµi when lowering the threshold of the p
Ttracking isolation
cut below the nominal p
T> 5 GeV used in the trigger. There is no difference in the rate when
requiring isolation using tracks with p
T> 5 GeV or p
T> 3 GeV. However, a net linear rate
reduc-tion with increasing pile-up is observed when using tracks with p
T> 1 GeV. As expected, a higher
number of interactions per event increases the likelihood that the event is rejected for triggers using
low-momentum track isolation.
9
Conclusions
Three signature-driven triggers designed to select decays of long-lived neutral particles
through-out the ATLAS detector volume are described: the Trackless Jet trigger for decays beyond the
pixel layers to the ECal, the Calorimeter Ratio trigger for decays in the HCal and the Muon RoI
Cluster trigger for decays from the end of the HCal to the MS middle station. These triggers are
demonstrated to be efficient for pairs of π
vparticles produced in Higgs boson decays, using
dif-ferent lifetimes and a range of Higgs boson and π
vmasses. They also met the tight bandwidth
requirements of the ATLAS triggers during the 2012 LHC physics data-taking period. The
esti-mated fraction of triggered π
vparticles is between 2% and 10% for a π
vmean proper lifetime in
the range 0.1 m to 20 m. The ATLAS physics potential for probing various SM extensions can be
greatly extended using the triggers described in this paper.
2013 JINST 8 P07015
〉µ 〈
0 5 10 15 20 25 30 35 40
Ratio of trigger rates
0.2 0.4 0.6 0.8 1 1.2 ATLAS Simulation >5 GeV T >3 GeV / p T p >5 GeV T >1 GeV / p T p
Figure 16. Ratio of trigger rates as a function of hµi when using lower pTisolation cuts for the Muon RoI Cluster trigger compared to the pT> 5 GeV cut used online.
Acknowledgments
We thank CERN for the very successful operation of the LHC, as well as the support staff from our
institutions without whom ATLAS could not be operated efficiently.
We acknowledge the support of ANPCyT, Argentina; YerPhI, Armenia; ARC, Australia;
BMWF and FWF, Austria; ANAS, Azerbaijan; SSTC, Belarus; CNPq and FAPESP, Brazil; NSERC,
NRC and CFI, Canada; CERN; CONICYT, Chile; CAS, MOST and NSFC, China;
COLCIEN-CIAS, Colombia; MSMT CR, MPO CR and VSC CR, Czech Republic; DNRF, DNSRC and
Lundbeck Foundation, Denmark; EPLANET, ERC and NSRF, European Union; IN2P3-CNRS,
CEA-DSM/IRFU, France; GNSF, Georgia; BMBF, DFG, HGF, MPG and AvH Foundation,
Ger-many; GSRT and NSRF, Greece; ISF, MINERVA, GIF, DIP and Benoziyo Center, Israel; INFN,
Italy; MEXT and JSPS, Japan; CNRST, Morocco; FOM and NWO, Netherlands; BRF and RCN,
Norway; MNiSW, Poland; GRICES and FCT, Portugal; MERYS (MECTS), Romania; MES of
Russia and ROSATOM, Russian Federation; JINR; MSTD, Serbia; MSSR, Slovakia; ARRS and
MIZ ˇS, Slovenia; DST/NRF, South Africa; MICINN, Spain; SRC and Wallenberg Foundation,
Swe-den; SER, SNSF and Cantons of Bern and Geneva, Switzerland; NSC, Taiwan; TAEK, Turkey;
STFC, the Royal Society and Leverhulme Trust, United Kingdom; DOE and NSF, United States of
America.
The crucial computing support from all WLCG partners is acknowledged gratefully, in
par-ticular from CERN and the ATLAS Tier-1 facilities at TRIUMF (Canada), NDGF (Denmark,
Norway, Sweden), CC-IN2P3 (France), KIT/GridKA (Germany), INFN-CNAF (Italy), NL-T1
(Netherlands), PIC (Spain), ASGC (Taiwan), RAL (UK) and BNL (USA) and in the Tier-2
fa-cilities worldwide.
2013 JINST 8 P07015
References
[1] S. Dimopoulos, M. Dine, S. Raby and S.D. Thomas, Experimental signatures of low-energy gauge mediated supersymmetry breaking,Phys. Rev. Lett.76 (1996) 3494[hep-ph/9601367].
[2] R. Barbier, C. Berat, M. Besancon, M. Chemtob, A. Deandrea et al., R-parity violating supersymmetry,Phys. Rept.420 (2005) 1[hep-ph/0406039].
[3] D. Tucker-Smith and N. Weiner, Inelastic dark matter,Phys. Rev.D 64 (2001) 043502 [hep-ph/0101138].
[4] M.J. Strassler and K.M. Zurek, Echoes of a hidden valley at hadron colliders,Phys. Lett.B 651 (2007) 374[hep-ph/0604261].
[5] M.J. Strassler and K.M. Zurek, Discovering the Higgs through highly-displaced vertices,Phys. Lett. B 661 (2008) 263[hep-ph/0605193].
[6] M.J. Strassler, Possible effects of a hidden valley on supersymmetric phenomenology, hep-ph/0607160.
[7] ATLAS collaboration, Search for a light Higgs boson decaying to long-lived weakly-interacting particles in proton-proton collisions at√s= 7 TeV with the ATLAS detector,Phys. Rev. Lett.108 (2012) 251801[arXiv:1203.1303].
[8] ATLAS collaboration, The ATLAS Experiment at the CERN Large Hadron Collider,2008 JINST 3 S08003.
[9] ATLAS collaboration, Performance of the ATLAS Trigger System in 2010,Eur. Phys. J.C 72 (2012) 1849[arXiv:1110.1530].
[10] T. Sj¨ostrand, S. Mrenna and P.Z. Skands, A Brief Introduction to PYTHIA 8.1,Comput. Phys. Commun.178 (2008) 852[arXiv:0710.3820].
[11] A. Martin, W. Stirling, R. Thorne and G. Watt, Parton distributions for the LHC,Eur. Phys. J.C 63 (2009) 189[arXiv:0901.0002].
[12] E. Fullana et al., Digital Signal Reconstruction in the ATLAS Hadronic Tile Calorimeter, IEEE Trans. Nucl. Sci.53 (2006) 4.
[13] ATLAS collaboration, Implementation and performance of the signal reconstruction in the ATLAS Hadronic Tile Calorimeter,TILECAL-PROC-2011-008(2011).
[14] M. Cacciari, G.P. Salam and G. Soyez, The Anti-ktjet clustering algorithm,JHEP04 (2008) 063 [arXiv:0802.1189].
[15] C. Adorisio et al., System test of the ATLAS muon spectrometer in the H8 beam at the CERN SPS, Nucl. Instrum. Meth.A 593 (2008) 232.
[16] ATLAS collaboration, Expected Performance of the ATLAS Experiment - Detector, Trigger and Physics,arXiv:0901.0512.
2013 JINST 8 P07015
The ATLAS collaboration
G. Aad48, T. Abajyan21, B. Abbott112, J. Abdallah12, S. Abdel Khalek116, A.A. Abdelalim49, O. Abdinov11, R. Aben106, B. Abi113, M. Abolins89, O.S. AbouZeid159, H. Abramowicz154, H. Abreu137,
Y. Abulaiti147a,147b, B.S. Acharya165a,165b,a, L. Adamczyk38a, D.L. Adams25, T.N. Addy56, J. Adelman177, S. Adomeit99, T. Adye130, S. Aefsky23, J.A. Aguilar-Saavedra125b,b, M. Agustoni17, S.P. Ahlen22,
F. Ahles48, A. Ahmad149, M. Ahsan41, G. Aielli134a,134b, T.P.A. ˚Akesson80, G. Akimoto156, A.V. Akimov95, M.A. Alam76, J. Albert170, S. Albrand55, M.J. Alconada Verzini70, M. Aleksa30, I.N. Aleksandrov64, F. Alessandria90a, C. Alexa26a, G. Alexander154, G. Alexandre49, T. Alexopoulos10, M. Alhroob165a,165c, M. Aliev16, G. Alimonti90a, J. Alison31, B.M.M. Allbrooke18, L.J. Allison71, P.P. Allport73,
S.E. Allwood-Spiers53, J. Almond83, A. Aloisio103a,103b, R. Alon173, A. Alonso36, F. Alonso70, A. Altheimer35, B. Alvarez Gonzalez89, M.G. Alviggi103a,103b, K. Amako65, Y. Amaral Coutinho24a, C. Amelung23, V.V. Ammosov129,∗, S.P. Amor Dos Santos125a, A. Amorim125a,c, S. Amoroso48,
N. Amram154, C. Anastopoulos30, L.S. Ancu17, N. Andari30, T. Andeen35, C.F. Anders58b, G. Anders58a, K.J. Anderson31, A. Andreazza90a,90b, V. Andrei58a, X.S. Anduaga70, S. Angelidakis9, P. Anger44, A. Angerami35, F. Anghinolfi30, A. Anisenkov108, N. Anjos125a, A. Annovi47, A. Antonaki9,
M. Antonelli47, A. Antonov97, J. Antos145b, F. Anulli133a, M. Aoki102, L. Aperio Bella18, R. Apolle119,d, G. Arabidze89, I. Aracena144, Y. Arai65, A.T.H. Arce45, S. Arfaoui149, J-F. Arguin94, S. Argyropoulos42, E. Arik19a,∗, M. Arik19a, A.J. Armbruster88, O. Arnaez82, V. Arnal81, A. Artamonov96, G. Artoni133a,133b, D. Arutinov21, S. Asai156, N. Asbah94, S. Ask28, B. ˚Asman147a,147b, L. Asquith6, K. Assamagan25, R. Astalos145a, A. Astbury170, M. Atkinson166, B. Auerbach6, E. Auge116, K. Augsten127,
M. Aurousseau146b, G. Avolio30, D. Axen169, G. Azuelos94,e, Y. Azuma156, M.A. Baak30, G. Baccaglioni90a, C. Bacci135a,135b, A.M. Bach15, H. Bachacou137, K. Bachas155, M. Backes49, M. Backhaus21, J. Backus Mayes144, E. Badescu26a, P. Bagiacchi133a,133b, P. Bagnaia133a,133b, Y. Bai33a, D.C. Bailey159, T. Bain35, J.T. Baines130, O.K. Baker177, S. Baker77, P. Balek128, F. Balli137, E. Banas39, P. Banerjee94, Sw. Banerjee174, D. Banfi30, A. Bangert151, V. Bansal170, H.S. Bansil18, L. Barak173, S.P. Baranov95, T. Barber48, E.L. Barberio87, D. Barberis50a,50b, M. Barbero84, D.Y. Bardin64, T. Barillari100, M. Barisonzi176, T. Barklow144, N. Barlow28, B.M. Barnett130, R.M. Barnett15, A. Baroncelli135a, G. Barone49, A.J. Barr119, F. Barreiro81, J. Barreiro Guimar˜aes da Costa57,
R. Bartoldus144, A.E. Barton71, V. Bartsch150, A. Basye166, R.L. Bates53, L. Batkova145a, J.R. Batley28, A. Battaglia17, M. Battistin30, F. Bauer137, H.S. Bawa144, f, S. Beale99, T. Beau79, P.H. Beauchemin162, R. Beccherle50a, P. Bechtle21, H.P. Beck17, K. Becker176, S. Becker99, M. Beckingham139, K.H. Becks176, A.J. Beddall19c, A. Beddall19c, S. Bedikian177, V.A. Bednyakov64, C.P. Bee84, L.J. Beemster106,
T.A. Beermann176, M. Begel25, C. Belanger-Champagne86, P.J. Bell49, W.H. Bell49, G. Bella154, L. Bellagamba20a, A. Bellerive29, M. Bellomo30, A. Belloni57, O. Beloborodova108,g, K. Belotskiy97, O. Beltramello30, O. Benary154, D. Benchekroun136a, K. Bendtz147a,147b, N. Benekos166,
Y. Benhammou154, E. Benhar Noccioli49, J.A. Benitez Garcia160b, D.P. Benjamin45, J.R. Bensinger23, K. Benslama131, S. Bentvelsen106, D. Berge30, E. Bergeaas Kuutmann16, N. Berger5, F. Berghaus170, E. Berglund106, J. Beringer15, P. Bernat77, R. Bernhard48, C. Bernius78, F.U. Bernlochner170, T. Berry76, C. Bertella84, F. Bertolucci123a,123b, M.I. Besana90a,90b, G.J. Besjes105, N. Besson137, S. Bethke100, W. Bhimji46, R.M. Bianchi30, L. Bianchini23, M. Bianco72a,72b, O. Biebel99, S.P. Bieniek77,
K. Bierwagen54, J. Biesiada15, M. Biglietti135a, H. Bilokon47, M. Bindi20a,20b, S. Binet116, A. Bingul19c, C. Bini133a,133b, B. Bittner100, C.W. Black151, J.E. Black144, K.M. Black22, D. Blackburn139, R.E. Blair6, J.-B. Blanchard137, T. Blazek145a, I. Bloch42, C. Blocker23, J. Blocki39, W. Blum82, U. Blumenschein54, G.J. Bobbink106, V.S. Bobrovnikov108, S.S. Bocchetta80, A. Bocci45, C.R. Boddy119, M. Boehler48, J. Boek176, T.T. Boek176, N. Boelaert36, J.A. Bogaerts30, A. Bogdanchikov108, A. Bogouch91,∗, C. Bohm147a, J. Bohm126, V. Boisvert76, T. Bold38a, V. Boldea26a, N.M. Bolnet137, M. Bomben79, M. Bona75, M. Boonekamp137, S. Bordoni79, C. Borer17, A. Borisov129, G. Borissov71, M. Borri83,
2013 JINST 8 P07015
S. Borroni42, J. Bortfeldt99, V. Bortolotto135a,135b, K. Bos106, D. Boscherini20a, M. Bosman12, H. Boterenbrood106, J. Bouchami94, J. Boudreau124, E.V. Bouhova-Thacker71, D. Boumediene34, C. Bourdarios116, N. Bousson84, S. Boutouil136d, A. Boveia31, J. Boyd30, I.R. Boyko64,
I. Bozovic-Jelisavcic13b, J. Bracinik18, P. Branchini135a, A. Brandt8, G. Brandt15, O. Brandt54,
U. Bratzler157, B. Brau85, J.E. Brau115, H.M. Braun176,∗, S.F. Brazzale165a,165c, B. Brelier159, J. Bremer30, K. Brendlinger121, R. Brenner167, S. Bressler173, T.M. Bristow146c, D. Britton53, F.M. Brochu28, I. Brock21, R. Brock89, F. Broggi90a, C. Bromberg89, J. Bronner100, G. Brooijmans35, T. Brooks76, W.K. Brooks32b, E. Brost115, G. Brown83, P.A. Bruckman de Renstrom39, D. Bruncko145b, R. Bruneliere48, S. Brunet60, A. Bruni20a, G. Bruni20a, M. Bruschi20a, L. Bryngemark80, T. Buanes14, Q. Buat55, F. Bucci49, J. Buchanan119, P. Buchholz142, R.M. Buckingham119, A.G. Buckley46, S.I. Buda26a, I.A. Budagov64, B. Budick109, L. Bugge118, O. Bulekov97, A.C. Bundock73, M. Bunse43, T. Buran118,∗, H. Burckhart30, S. Burdin73, T. Burgess14, S. Burke130, E. Busato34, V. B¨uscher82, P. Bussey53, C.P. Buszello167,
B. Butler57, J.M. Butler22, C.M. Buttar53, J.M. Butterworth77, W. Buttinger28, M. Byszewski10, S. Cabrera Urb´an168, D. Caforio20a,20b, O. Cakir4a, P. Calafiura15, G. Calderini79, P. Calfayan99, R. Calkins107, L.P. Caloba24a, R. Caloi133a,133b, D. Calvet34, S. Calvet34, R. Camacho Toro49, P. Camarri134a,134b, D. Cameron118, L.M. Caminada15, R. Caminal Armadans12, S. Campana30, M. Campanelli77, V. Canale103a,103b, F. Canelli31, A. Canepa160a, J. Cantero81, R. Cantrill76, T. Cao40,
M.D.M. Capeans Garrido30, I. Caprini26a, M. Caprini26a, D. Capriotti100, M. Capua37a,37b, R. Caputo82, R. Cardarelli134a, T. Carli30, G. Carlino103a, L. Carminati90a,90b, S. Caron105, E. Carquin32b,
G.D. Carrillo-Montoya146c, A.A. Carter75, J.R. Carter28, J. Carvalho125a,h, D. Casadei109, M.P. Casado12, M. Cascella123a,123b, C. Caso50a,50b,∗, E. Castaneda-Miranda174, A. Castelli106, V. Castillo Gimenez168, N.F. Castro125a, G. Cataldi72a, P. Catastini57, A. Catinaccio30, J.R. Catmore30, A. Cattai30,
G. Cattani134a,134b, S. Caughron89, V. Cavaliere166, D. Cavalli90a, M. Cavalli-Sforza12,
V. Cavasinni123a,123b, F. Ceradini135a,135b, B. Cerio45, A.S. Cerqueira24b, A. Cerri15, L. Cerrito75, F. Cerutti15, A. Cervelli17, S.A. Cetin19b, A. Chafaq136a, D. Chakraborty107, I. Chalupkova128, K. Chan3, P. Chang166, B. Chapleau86, J.D. Chapman28, J.W. Chapman88, D.G. Charlton18, V. Chavda83,
C.A. Chavez Barajas30, S. Cheatham86, S. Chekanov6, S.V. Chekulaev160a, G.A. Chelkov64, M.A. Chelstowska105, C. Chen63, H. Chen25, S. Chen33c, X. Chen174, Y. Chen35, Y. Cheng31,
A. Cheplakov64, R. Cherkaoui El Moursli136e, V. Chernyatin25, E. Cheu7, S.L. Cheung159, L. Chevalier137, V. Chiarella47, G. Chiefari103a,103b, J.T. Childers30, A. Chilingarov71, G. Chiodini72a, A.S. Chisholm18, R.T. Chislett77, A. Chitan26a, M.V. Chizhov64, G. Choudalakis31, S. Chouridou9, B.K.B. Chow99,
I.A. Christidi77, A. Christov48, D. Chromek-Burckhart30, M.L. Chu152, J. Chudoba126, G. Ciapetti133a,133b, A.K. Ciftci4a, R. Ciftci4a, D. Cinca62, V. Cindro74, A. Ciocio15, M. Cirilli88, P. Cirkovic13b, Z.H. Citron173, M. Citterio90a, M. Ciubancan26a, A. Clark49, P.J. Clark46, R.N. Clarke15, J.C. Clemens84, B. Clement55, C. Clement147a,147b, Y. Coadou84, M. Cobal165a,165c, A. Coccaro139, J. Cochran63, S. Coelli90a, L. Coffey23, J.G. Cogan144, J. Coggeshall166, J. Colas5, S. Cole107, A.P. Colijn106, N.J. Collins18, C. Collins-Tooth53, J. Collot55, T. Colombo120a,120b, G. Colon85, G. Compostella100, P. Conde Mui˜no125a, E. Coniavitis167, M.C. Conidi12, S.M. Consonni90a,90b, V. Consorti48, S. Constantinescu26a, C. Conta120a,120b, G. Conti57, F. Conventi103a,i, M. Cooke15, B.D. Cooper77, A.M. Cooper-Sarkar119, N.J. Cooper-Smith76, K. Copic15, T. Cornelissen176, M. Corradi20a, F. Corriveau86, j, A. Corso-Radu164, A. Cortes-Gonzalez166,
G. Cortiana100, G. Costa90a, M.J. Costa168, D. Costanzo140, D. Cˆot´e30, G. Cottin32a, L. Courneyea170, G. Cowan76, B.E. Cox83, K. Cranmer109, S. Cr´ep´e-Renaudin55, F. Crescioli79, M. Cristinziani21,
G. Crosetti37a,37b, C.-M. Cuciuc26a, C. Cuenca Almenar177, T. Cuhadar Donszelmann140, J. Cummings177, M. Curatolo47, C.J. Curtis18, C. Cuthbert151, H. Czirr142, P. Czodrowski44, Z. Czyczula177, S. D’Auria53, M. D’Onofrio73, A. D’Orazio133a,133b, M.J. Da Cunha Sargedas De Sousa125a, C. Da Via83,
W. Dabrowski38a, A. Dafinca119, T. Dai88, F. Dallaire94, C. Dallapiccola85, M. Dam36, D.S. Damiani138, A.C. Daniells18, H.O. Danielsson30, V. Dao105, G. Darbo50a, G.L. Darlea26c, S. Darmora8,