/
Statens väg- och trafikinstitut (VTI) • 581 01 LinköpingNational Road & Traffic Research Institute • S-581 01 Linköping • Sweden
The laser road surface tester
A system for simultaneous
measure-ment of rut depth, roughness,
macrotex-ture and friction
Statens väg- och trafikinstitut (VTI) • 581 01 Linköping National Road & Traffic Research Institute • S-581 01 Linköping • Sweden
The laser road surface tester
A system for simultaneous
measure-ment of rut depth, roughness,
macrotex-ture and friction
PREFACE
This report is based on research work carried out by several researchers at the institute, see literature list and responsibility list (Annex 1 and 2). Special thanks for help with the report will also be given to Leif Sjögren, Björn Ottersten, Evert Ohlsson, Georg Magnusson, Ulf Sandberg and Knut Rahs.
The Swedish National Road Administration has together with the National Swedish Road and Traffic Research Institute made it possible to carry out the develop-ment of the Laser Road Surface Tester (RST).
The sales organization for the RST is SweRoad Consulting
Box 4202
S-171 0 4 SOLNA Sweden Tel No. 468-98 01 80
ACKNOWLEDGEMENT
Researchers
The National Swedish Road and Traffic Research Institute, VTI
Pqter W. Arnberg, Ph.D.
Georg Magnusson, M.Sc.
•Knut Råhs, M.Sc. Ulf Sandberg, M.Sc. Leif Sjögren, Eng.
Evert Ohlsson, M.Sc.
The Royal Institute of Technology, KTH
Lars Olof Alm, M.Sc.
The project is financed by Administration (VV), and t]
and Traffic Research Insti
-Responsibilities
Project leader and human factors
Road roughness and longi-tudinal road profile System analysis and pro-gramming
Macrotexture
System analysis and field studies
Friction
Cross profile
the Swedish National Road e National Swedish Road ute (VTI).
CONTENTS Page ABSTRACT I REFERAT II SUMMARY III SAMMANFATTNING VI 1 THE NEED FOR A FAST, COMPREHENSIVE MEASURING 1
SYSTEM FOR ROAD SURFACE CHARACTERISTICS
2 THE FIRST-GENERATION MEASURING SYSTEM; 3 THE SAAB ROAD SURFACE TESTER
3 THE SECOND-GENERATION MEASURING SYSTEM; 5 THE LASER ROAD SURFACE TESTER
3.1 Basic principle of the laser device 7
3.2 The computer system 8 3.3 A road network reference system 8
3.4 Observed variables 9 3.4.1 Cross profile and rut depth 9
3.4.2 Unevenness 15 3.4.3 Surface deficiencies 18 3.4.4 Distance 18 3.5 Optional measurement 18 3.5.1 Skid resistance 18 3.6 Future developments 19 3.6.1 Crossfall 19 3.6.2 Longitudinal road profile 20
3.6.3 Surface macrotexture 24
4 AN EXAMPLE OF AN ASSIGNMENT AND DATA 2 8 PRESENTATION
5 CONCLUDING REMARKS 3 0
The Laser Road Surface Tester
A system for simultaneous measurement of rut depth, roughness, macrotexture and friction
by Peter W Arnberg
National Swedish Road and Traffic Research Institute S-581 01 LINKÖPING SWEDEN
ABSTRACT
The Laser Road Surface Tester (RST) is the second generation of an integrated road surveying instrument developed in Sweden. The principal component of the Laser RST is a noncontact road profiling system. The first road surveying instrument, the Saab RST, has been used for surveying the Swedish road network since
1980. It has given practical experience concerning the measurement and evaluation of road surface charac-teristics. In this report the new system, The Laser Road Surface Tester, is presented.
Laser Road Surface Tester (RST) av Peter W Arnberg
Statens väg- och trafikinstitut 581 01 LINKÖPING
REFERAT
Laser Road Surface Tester är den andra generationen av-ett integrerat vägytemätningsinstrument utvecklat i < Sverige. Huvudkomponenten hos Laser RST är en tvär-profilometer med kontaktlös avståndsmäthing. Första generationens instrument har använts för inventering av det sVenska vägnätet sedan 1980. Detta har givit erfarenhet av och kunskap om mätningar och vägytepara^. metrar vid mätningar av detta slag. I denna rapport presenteras det nya systemet, Laöer Road Surface Tester
The Laser Road Surface Tester
A system for simultaneous measurement of rut depth, roughness, macrotexture and friction
by Peter W Arnberg
National Swedish Road and Traffic Research Institute S-581 01 LINKÖPING SWEDEN
SUMMARY
The road network is one of the most vital components for transport and industrial development.
An extensive knowledge of the operative state of the road network is thus required for the management of maintenance and rehabilitation work, especially when considering the perpetually waning road budget.
Objective input, to a satisfactory extent, can be obtained only through the use of adequate instrumenta-tion. Existing instruments usually have the limitation of measuring only one variable, and, therefore, a set of apparatuses and measuring teams are required for the aquisation of sufficient data necessary for mainten-ance management. The measuring speed is often low, causing high operator hazards in heavy traffic condi-tions. To produce useful data, extensive and time-consuming data processing is necessary. The need is great for a reliable, integrated measuring vehicle which can be operated at the speed of the surrounding traffic flow in order to increase security and to reduce measuring costs. Simultaneous measurement of several variables and instantaneous data processing are also necessary.
The aim of the project was to integrate several well-known measuring principles developed at The National
Swedish Road and Traffic Research Institute (VTI) into one measuring vehicle which incorporated the use of modern computer technology. The purpose has also been to obtain an instrument which is:
- easily operated - one-man operated - easily maintained
- gives an output which is streamlined for decision-making .
The first integrated system was developed in
coopera-tion with the aerospace and car division of Saab-Scania. Experience from two years use of the system, although much positive feedback was received, indicated that further development was necessary. The present project, being carried out entirely by VTI is thus the second step in the process of producing a traffic-adjusted integrated measuring system.
This second generation system is called VTI Laser Road Surface Tester. The Laser RST is a noncontact measuring system consisting of eleven laser units fastened on a crossbar in front of the vehicle. Two of the laser units are positioned at a 45° angle, thus making it possible to measure a width of 3.1 meters without being more than 2.6 meters wide. The value from these eleven laser units gives the crossprofile of the road and the rut depth can be calculated.
A micro-computer-based data acquisition and processing system is provided in the vehicle as well as data storage and presentation units.
At present the equipment can measure transverse road profile, ruth depth and road roughness. It is also possible to register different road parameters such as cracks, road wear, etc.
In the future the road surface macrotexture will be measured by means of a special laser unit already in use. VTI is developing an evaluation system that will make it possible to predict friction/speed gradient, aquaplaning risks, tire to road noise and light reflec-tion properties. Development of a system to measure road crossfall by means of a gyro is in progress. The cross profile will be related to a horizontal line, obtained from the gyro, to provide information on the crossfall angle of the road.
The noncontact measuring system based on laser permits a stable system with a minimum of mechanical wear. VTI Laser RST will in a fast and a safe way measure the roads longitudinal and cross evenness together with the other parameters of the system.
Laser Road Surface Tester (RST) av Peter W Arnberg
Statens väg- och trafikinstitut 581 01 LINKÖPING
SAMMANFATTNING
Vägnätet är en viktig komponent då det gäller transport och industriell utveckling. Ingående kunskap om väg-nätets tillstånd är avgörande för prioritering av under-håll och förbättringsarbeten speciellt med hänsyn till den ansträngda budgeten.
Objektiva indata av tillräcklig omfattning kan endast erhållas genom lämpliga mätinstrument. Existerande instrument har flera begränsningar bl a mäter de nor-malt endast en variabel. Detta gör att insamlandet av nödvändiga data kräver flera instrument och mätningar eller mätlag. Därtill kommer att mäthastigheten ofta är låg vilket medför risker i trafiken. Bearbetning av data för att få användbara resultat är ofta tids-krävande. Behovet av ett pålitligt integrerat mätfordon som kan användas i normal trafikrytm för att öka säker-heten och minska mätkostnaderna är därför stort. Sam-tidig mätning av flera variabler och omedelbar beräk-ning av data är nödvändigt.
Projektets mål var att integrera flera av de av statens väg- och trafikinstitut framtagna mätprinciperna i ett mätfordon och att utnyttja modern datorteknik. Målet har också varit att erhålla ett instrument som är: - enkelt att använda
- enmansbetjänat
- samt att ge utdata av form som är anpassat till beslutsfattande vad gäller utdata
Det första integrerade mätsystemet utvecklades till-sammans med Saab-Scanias flyg- och bildivision. Två års erfarenhet av detta system bekräftade behovet, men visade också på att ytterligare utveckling var nödvän-dig. Det nuvarande projektet, vilket utförs av VTI, är därför ett andra steg i processen att utveckla ett trafikanpassat integrerat mätsystem. Detta andra gene-rationens system kallas VTI Laser Road Surface Tester.
Laser RST är ett system med kontaktlös avståndsmätning. Det består av elva laserenheter placerade på en balk i fronten av en bil. Laserenheterna är placerade lodräta med ett jämnt avstånd på den 2,6 meter breda balken. De två yttersta laserenheterna är utvinklade 45°. Detta medför att man erhåller 3,1 meters avstånd mellan de yttersta mätpunkterna. Värdet från dessa elva laser-enheter bestämmer vägens tvärprofil och utifrån denna beräknas spårdjupet. Kombinationen accelerometer- och laserenheter över hjulspåren känner av vägens längs-gående ojämnheter och ger ett därpå baserat komfort-värde .
I Laser RST ingår ett mikrodatorbaserat insamlings- och beräkningssystem, skivminne för lagring av program och resultat samt en monitor och printer för presentation av resultat. För närvarande kan systemet mäta vägens tvärprofil, spårdjup och längsgående ojämnheter. Det är också möjligt att via manuell bedömning lagra infor-mation om tre olika skadeparameterar såsom sprickor slitage etc.
I framtiden kommer även makrotexturen att kunna mätas med hjälp av en speciell laserenhet. Genom en bestämning
av makrotexturen kan det bli möjligt att förutsäga friktion, buller och ljusreflektionsegenskaper. Ett system för bestämning av vägens tvärprofil relateras till en horisontlirije erhållen från ett gyro och på så sätt ger vägens tvärfallsvinkel.
Det kontaktlösa mätsystemet baserat på laser ger ett stabilt och säkert system med ett minimalt mekaniskt slitage. Med VTI Laser RST kan man med en snabb och trafiksäker metod mäta vägens längs- och tvärgående jämnhet samt de övriga storheter som ingår i systemet.
1 THE NEED FOR A FAST, COMPREHENSIVE MEASURING SYSTEM FOR ROAD SURFACE CHARACTERISTICS
An extensive knowledge of the functional state of the road network is required for the management of main-tenance and rehabilitation work as well as for the planning of new roads. This is especially true
con-sidering the perpetually waning road budget.
A strategy concerning future, rational road maintenance actualizes the following needs:
- an improved basis for central and local decision-making concerning road maintenance and construction
- the development of functional and structural road standards
- feedback to highway engineers concerning pavement deficiencies
- knowledge of the role of pavement standards in acci-dent, vehicle and goods costs
Objective input can be obtained, to a satisfactory extent, only through the use of adequate instrumenta-tion .
Earlier instruments were usually limited by their ability to measure only one variable . There-fore, a set of equipment and measuring teams were required for the acquisition of sufficient data necessary for maintenance management. The measuring speed was often low, causing high operator hazards in heavy traffic conditions. To produce useful data, extensive and time-consuming data processing was often also necessary.
The need is thus great for reliable, integrated measur-ing vehicles which can be operated at the speed of the surrounding traffic flow in order to increase security and to reduce measuring costs. Simultaneous measurement of several variables and instantaneous data processing are both also necessary.
Several well-known measuring principles, most of which have been developed at the National Swedish Road and Traffic Research Institute (VTI), have been integrated into one measuring vehicle which incorporates the use of modern digital computer technology. The purpose has been to obtain an instrument which:
- is easily operated - is easily maintained
- gives direct output, which is streamlined for deci-sion-making .
The National Swedish Road and Traffic Research Insti-tute (VTI) and the Swedish National Road Administra-tion ( SNRA) have been collecting data on the road network for a number of years. A road data bank where all paved roads are described according to a number of variables, e.g., road geometry and width, traffic volume, and accident rate, has been developed by SNRA.
Follow-up surveys every third year by SNRA have also provided road surface data. In the beginning, these were collected by means of subjective judgements, but gradually they have been more objectively obtained and have included parameters such as longitudinal uneven-ness, cross profile, rut depth, friction, road wear, and cracking.
2 THE FIRST-GENERATION MEASURING SYSTEM; THE SAAB ROAD SURFACE TESTER
The first integrated system was developed by VTI and SNRA in cooperation with the aerospace and car divi-sions of Saab-Scania. Two Saab Road Surface Testers
(SAAB RSTs), one owned by SNRA and one by VTI, are now in use in Sweden. Magnetic tapes from the surveys are sent to and stored at the road data bank. Two surveys, each covering 25 percent of the paved road network in Sweden, have been carried out following the development of the vehicles.
CONTROL PANEL LATERAL ACCELEROMETER
and GYRO
TAPE RECORDER
and PRINTER WATER TANK
COMPUTER UNIT
RUT DEPTH ROLLERS VERTICAL ACCELEROMETER TEST WHEEL
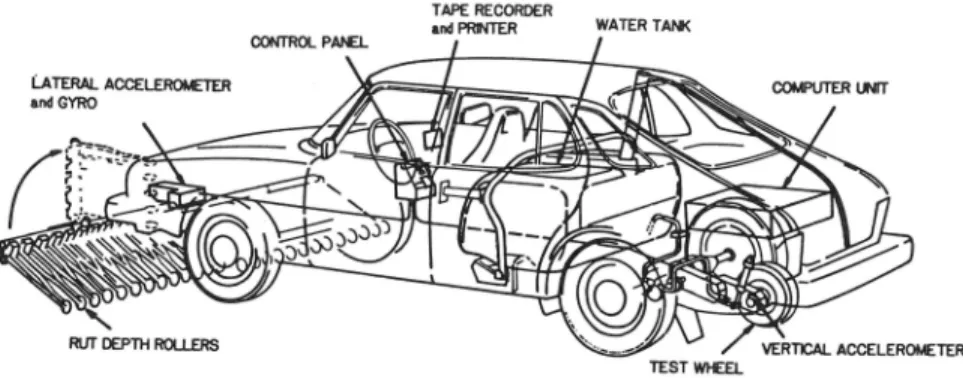
Figure 1. The principal components of the Saab RST measurement vehicle
For the measurement of road cross profile 26 spring-loaded measuring arms have been provided with small rollers. The measuring arms are mounted on a 2.5 meter long beam in front of the car. Each arm has a sensor which provides information on the vertical position of the roller related to the beam. All sensors are scanned every 10-15 meters, thus coordinating values of the cross profile of the road. From these values the rut depth is calculated.
The cross profile is related to the ground plane indi-cated by a gyro to obtain the crossfall of the road. Friction measurements are carried out by a braked measuring wheel which is mounted behind the rear axle. Longitudinal unevenness is measured with the aid of an accelerometer fitted on the swing arm of the same wheel
Since the Saab RST is limited to a 2.5 meter measuring width, it does not cover a normal traffic lane. Because of this, the Saab RST must be driven in a special way and certain approximations have to be made in order to obtain a complete road profile. Furthermore, there is an apparent risk for disturbance in the mechanical profiling system. These problems and others indicate the need for further development.
3 THE SECOND-GENERATION MEASURING SYSTEM; THE LASER ROAD SURFACE TESTER
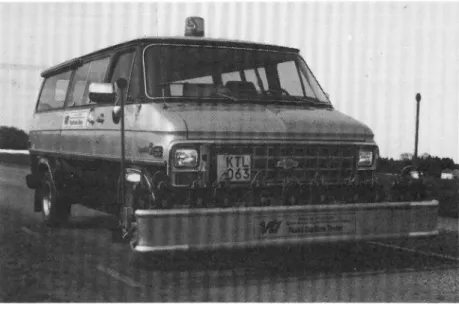
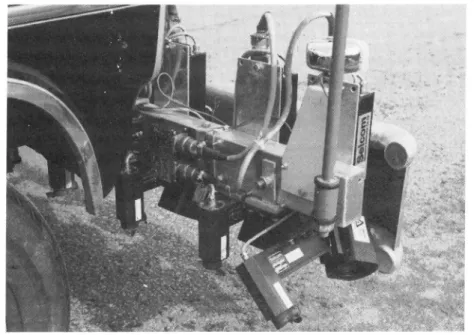
Due to some of the problems mentioned in the preceding section, a decision to study non-contact measuring systems was taken at an early stage. Experience from two years' use of the Saab RST, although much positive feedback was received, also indicated that further development was necessary. The process of producing a traffic-adapted integrated measuring system led to the second step, the development of the Laser RST, based on laser technique for profile measurements. Figure 2 provides an overall view of the vehicle.
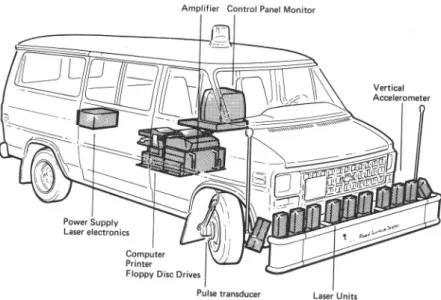
The Laser RST is a non-contact measuring system con-sisting of eleven laser units fastened on a crossbar in front of a van. During driving, the distance between the road and the crossbar is measured at eleven points by means of the laser units. The vertical movements of the vehicle body which result from unevenness in the road are measured by an accelerometer mounted on the bar. The van is also equipped with a constant speed device and a distance counter fitted on the right front wheel. A micro-computer data acquisition and processing system is provided in the vehicle as well as data storage and presentation units. Figure 3 shows the different measuring and processing units.
Amplifier Control Panel Monitor
Vertical Accelerometer Units Power Supply Laser electronics Computer Printer
Floppy Disc Drives
Pulse transducer Laser
3.1 Basic principle of the laser device
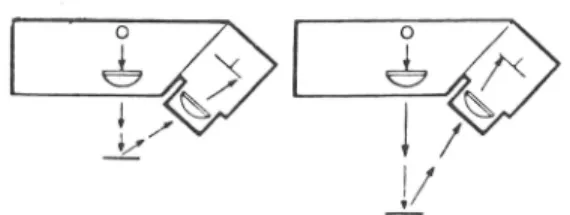
The measuring system consists of an optoelectronic device. A ligth source (laser diode) illuminates a spot on the road surface from which the light is flected in all directions. Part of the light is re-flected into a lens system which projects an image of the illuminated spot onto a photo-detector sensitive to position. Figure 4 illustrates the above principle.
Figure 4. Principle: Laser light-spot on road surface is projected on light-sensitive displacement sensor. Electrical signals representing ver-tical position and light intensity of laser spot are recorded and computer processed
If the illuminated surface moves nearer or further away from the camera, the reflected light will strike the photo-detector at a different point than previous-ly. The distance to the illuminated surface can then be calculated by the electronic unit.
The Selcom laser system used for cross profile, rough-ness and macrotexture measurements has proven to be superior to a mechanical measuring system. The
non-contact system is stable and requires little maintenance as there is no mechanical wear. Its accuracy to two tenths of a millimeter is more than sufficient.
3.2 The computer system
The computer system is based on the microprocessor Motoro 6809. The system is provided with two dual floppy-disc drivers, one for five inches and one for eight inches floppy-discs. The measuring programs are written in Pascal and Assembler language and stored on the five inches discs. Measured data are stored on the eight inches discs. With double sided and double densi-ty discs the storage capacidensi-ty is more than two Mbyte The results are also printed on paper directly in the car (see figure 6). The flexible programming system makes it possible to adjust programs to meet specific information needs.
The computer system, which is developed by Primal Data AB, and the system for collecting data on floppy discs has proven to be very reliable.
3.3 A road network reference system
The reference system of the SNRA road data bank has been adopted as the reference system in Sweden. In this system every road junction has a aiscredite number linked to its locality. Before the start of an RST run, the actual junction and road numbers are entered into the computer. When passing a preprogrammed junction, the operator acknowledges this to the
computer, thereby defining the measured data geo-graphically by its automatically measured distance to adjacent road junctions.
3.4. Observed variables
3.4.1 Cross_profile_and_rut_degth
As mentioned before, the profiling system consists of eleven laser units fastened on a cross bar in front of the vehicle. The two outer laser units are positioned at a 45° angle (see figure 5), thus making it possible to measure a width of 3.1 meters without requiring more space than 2.5 meters.
Figure 5. One of the outer angled laser units
The road cross profile is normally measured with a width of 3.1 meters, but one or two of the lasers can be disconnected if a narrow lane is being measured. The lasers are nominally 300 mm above the road surface and have an accuracy of ±0.2 mm within a range of ±128 mm for temperatures within 0° to 40°C.
In the surveying mode, one profile is recorded every five meters. For each profile the rut depth is calcu-lated. A fictitious straight line between the readings of the outermost laser units serves as a reference.
The reading from each laser unit represents the devia-tion from the reference line (resoludevia-tion 0.1 mm). Rut depth can be calculated by two different methods
referred to as the straight-edge and wire methods. The computer also calculates the mean profile, the devia-tion and the mean rut depth for a given distance, and the percentage of road length with rut depth exceeding 10 and 20 mm is printed (see figure 6 which gives an example of the output from cross profile and rut depth measurements). The result is also stored on floppy disk.
***** Laser Road Sur-face Tester ***** Crossprofi1e and road roughness
1932-09-13 Time 10:32 ObJectnr = 1 Length = 20 37 m Roadnr = 34 From - 0 8 5 2A 0 81 . 00 To = 0 852A0 63. 0 0 Di stance = 0 m Speed = 82 km/h Evenness = 4 .3 >6.5 = 9 . 3 % Rutdepth = 22 .3 mm > 1 0 mm = 1 0 0 . 0 X >20 mm = 82 . 3 Hang = 4 . 5 Crack = 14 .0 x Wear = 6 . 3 M e a n p r o f i l e : 0 - 1 3 9 - 2 0 ? - 1 ¿ 0 - 3 5 4 2 2 9 - 4 1 - 1 1 3 - 1 2 5 D e v i a t i o n : 0 6 0 3 7 3 3 3.5 2 2 3 8 5 6 ¿ 4 4 5
When calculating the rut depth by the straight-edge method, the same principle is used as when placing a
straight beam across one lane of the road and measuring the maximum distance to the pavement surface (see fi-gure 7). Normally the beam rests on A and E. If the roadway center is elevated, the bar can be tipped onto two positions. The rut depth is the largest value of S1 and S2.
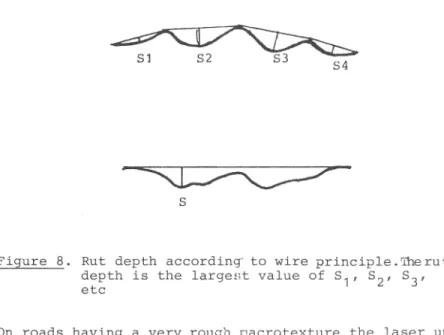
Calculation according to the above method requires a cross profile with two "normal" ruts, such as shown in figure 7. The wire principle is mathematically more general (see figure 8). A wire or string is assumed to be fastened across the profile and the rut depth is calculated as the maximum distance between the road and the wire. The results are easy to evaluate. For example, the rut depth is automatically zero when the profile is convex and has no ruts.
Figure 7. Rut depth according to the straight-edge principle
Figure 8. Rut depth according' to wire principle. The rut depth is the largest value of S^, S^r S etc
On roads having a very rough nacrotexture the laser units measure the average distance to the surface. The dist-ance to the top of the aggregate is obtained when measuring by conventional mechanical methods.
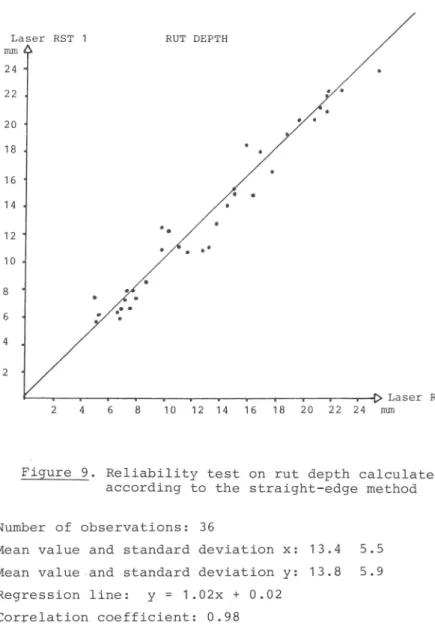
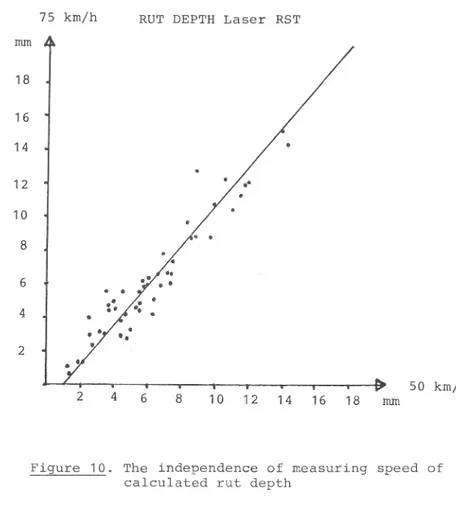
Figure 9 shows the reliability of the method. Figure 10 shows the independence of measuring speed.
The distance over which averaging will take place is determined by the operator and ranges from five meters up to several kilometers at a speed from 30 to 90 km/h. The result is printed on paper and stored on floppy-discs for later retrieval. The system will automati-cally resume measuring a new profile after the first profile is concluded.
Figure 9. Reliability test on rut depth calculated according to the straight-edge method
Number of observations: 36
Mean value and standard deviation x: 13.4 5.5 Mean value and standard deviation y: 13.8 5.9 Regression line: y = 1.02x + 0.02
75 km/h RUT DEPTH Laser RST
Figure 10. The independence of measuring speed of calculated rut depth
Number of observations: 52
Mean value and standard deviation x: 6.3 3.1 Mean value and standard deviation y: 6.2 3.5 Regression line: y = 1.19x - 1.35
3.4.2 Unevenness
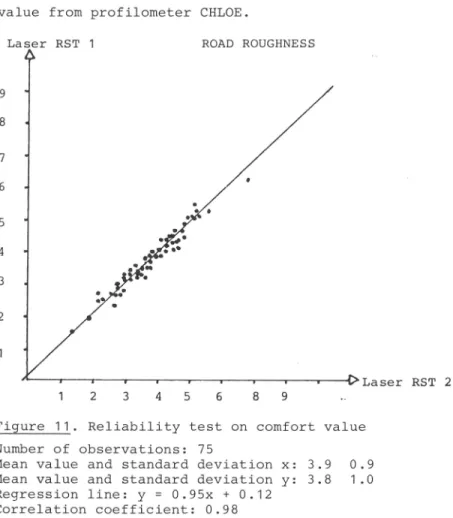
Road roughness measured and presented as a comfort value. For this function, the readings from the lasers above the wheelpaths of the road are coordinated with the double integrated readings from a vertical accelero-meter mounted on the crossbar in order to compensate for the vehicle's vertical movement. Road roughness is presented as a comfort value based on a scale from 1.0 to 9.0, with 9.0 being the roughest road. Figure 11 shows the reliability of the method and figure 12 shows the speed independence. Figure 13 shows the correla-tion between Laser RST's comfort value and the TRAC value from profilometer CHLOE.
Laser RST 1 ROAD ROUGHNESS
9 8 7 6 5 4 3 2 1
Figure 11. Reliability test on comfort value Number of observations: 75
Mean value and standard deviation x: 3.9 0.9 Mean value and standard deviation y: 3.8 1.0 Regression line: y = 0.95x + 0.12
Laser RST ROAD ROUGHNESS 7 6 5 4 3 2 1 Laser RST 50 km/h
Figure 12. The independence of comfort values of measuring speed
Number of observations: 67
Mean value and standard deviation x: Mean value and standard deviation y: Regression line: y = 0.86x + 0.54 Correlation coefficient: 0.95 4.0 4.0 1 .3 1 . 1
C H L 0 E ROAD ROUGHNESS
Figure 13. The correlation between Laser RST comfort value and the CHLOE profilometer trac value
Number of observations: 28
Mean value and standard deviation x: 4.4 1.2 Mean value and standard deviation y: 3.03 0.59 Regression line: y = -0.43x + 4.9
3.4.3 §urface_deficiencies
The RST system has the possibility of recording cracks, patches and pavement wear by a manually operated
switchboard on line with the computer. The presence of a road distress is automatically presented as a percentage value for any given distance.
3.4.4 Distance
A pulse transmitter is fitted in one of the nondriven front wheels. By counting the pulses from the trans-mitter, a measure of the distance travelled is obtained with an accuracy of ±0,2%.
3.5 Optional measurement
3.5.1 §kid_resistance
Skid resistance measurements can be carried out by connecting a friction test trailer BV11 to the ve-hicle (see figure 13). The trailer uses the "skiddo-meter" principle which means that the measurements are carried out with a braked wheel at incipient skids, 15% slip, and that 1 0 0 - 1 5 = 8 5 % of the brake force is fed back to the trailer as a driving force, thus diminishing the demand for propelling force from the van. The slip is also fully controlled and not influ-enced by travelling speed. Test wheel size is 4.00-8/4 and wheel load 1000 N. The torque on the braked test wheel is measured and a special program in the computer calculates the friction values within ±5%.
Figure 14. Skiddometer BV11 connected to the Laser RST. (Measuring speed 20 - 130 km/h)
3.6 Future developments
3.6.1 Crossf
all-Testing of a system to measure road crossfall by means of a gyro is in progress in the Saab RST. The cross profile is related to a horizontal line, obtained from the gyro, providing information on the cross-fall angle of the road. The gyro, however, takes a long time to start and is expensive. The value of crossfall information in surveying has also been questioned. For new roads and short road sections, an inclinometer has been tested with positive results. However, the speed in curves cannot exceed 10 km/h to obtain acceptable data if the inclinometer is used.
3.6.2 Longitudinal_road_grofile
To be able to calculate a true longitudinal road pro-file, VTI has developed a digital system according to the so called GMR principle.
The GMR method involves the measurement of the vertical distance between the car and the road surface. This measurement is carried out with a laser and it provides a picture of the road profile in a coordinate system fixed to the more or less bouncing car. To get the road profile related to an earth-fixed coordinate system it is necessary to perform a coordinate transformation, i e the vertical movements of the vehicle-fixed coordi-nate system must be known. In order to accomplish this the vertical acceleration of the car at the mounting of the laser is measured and integrated twice. By
adding the distance signal from the laser to the double integrated vertical acceleration of the laser the road profile in the earth-fixed coordinate system is obtained
(see figure 15).
The signal treatments involved in the integration and filtering procedures to accomplish the task are ne-cessarily rather complicated in order to avoid, or at least keep control over unavoidable phase shifts which otherwise would distort the road profile. The institute has tried to solve the problem by the use of digital filter technique and the preliminary results seem very promising .
Figure 16 shows a preliminary comparison between the GMR-profile of a 200 m road section and levelling every 10 m.
Figure 17 shows a comparison between the GMR-profile of about three 10 m sections and the profile obtained on the same sections from a special device called Primal capable of measuring the road profile very accurately but only on short sections and at very low speed. The two profiles are, however, presented in different scales longitudinally as well as vertically.
The comparisons between the GMR-profile and the actual profile as presented in those figures show a very good qualitative agreement in the coarse scale as well as in the fine scale. The agreement in the quantitative respect has so far not been studied. The measurements with the GMR-profilometer presented in figures 16 and 17 are performed at 70 km/h. Measurements performed at
90 km/h give the same result. Further studies will be carried out 1982 as well as in the spring 1983.
This very sophisticated system is, however, not
necessary for the calculation of comfort values where an analogue system would be quite satisfactory. It may, however, be needed in the future to give a good prog-nosis of the breaking down of the road or the damag-ing effects of goods and vehicles, driven on an uneven road.
V E H I C L E - F I X E D C O O R D I N A T E SYSTEM A C C E L E R O M E T E R
n
1
M E H I C L L//
W-Z)
w ) H I G H - P A S S F I L T E R LASER ROAD PROFILE E A R T H - F I X E D C O O R D I N A T E SYSTEMFigure 15. The measuring principle of the GMR-profilo-meter AETLIR 4 . 0 0 , 3 . 6 0 2.60 180 2 0 0 METER
Figure 16. Comparison between the continuous GM-profile ( ) an<3 levelling every 10 meters (+)
PRIMAL
Figure 17. Comparison between the GMR-profile and the PRIMAL profile. Observe that the two pro-files are presented in different scales longitudinally as well as vertically
3.6.3 Surface_macrotexture
In the near future the road surface macrotexture will be measured by means of a special electro-optical laser sensor already in use on a test vehicle. By using the same method as described earlier, the distance to the surface is calculated. The sensor is placed 180 mm above the road surface and has a measuring range of ±32 mm. Macrotexture is here considered as roughness with wavelengths between 1 and 100 mm. The wavelength covered by the "macrotexture unit" is at best 2-500 mm. The obtained resolution, in terms of the wavelength, is at present 2 mm at 36 km/h and 5 mm at 90 km/h. The light spot size as well as the background electrical noise level are limiting factors for the measurement.
The sensor enables a continuous measurement of the surface profile curve with little or no drop-out. A macro-texture (Root Mean Square) value could be directly calculated, but in this case much more in-format ion can be obtained by calculating the frequency spectrum of the profile curve. In the special test vehicle this is done in real-time by a third-octave band frequency analyzer.
The result is a diagram displaying the RMS: texture value as a function of texture wavelength (= inverse of spatial frequency), as the example of figure 18 shows. Additionally, some overall texture values are calculated which are based on the summation of the
levels in certain wavelength bands. These overall levels are named "Waviness" (wavelengths 100-500 mm), "Large-scale macrotexture" (wavelengths 10-100 mm), "Fine-scale macrotexture" (wavelengths 2-10 mm) and "Macro-texture" (wavelengths 2-100 mm). The macrotexture value is closely related to the "Sand-patch measured texture depth".
Macrotexture data measured by VTI mobile laser profilo-meter:
_ g Macrotexture level: L.. = 52 dB rel. 10 m
M
Macrotexture (RMS value): T^ = 0.40 mm (antilog of L^)
Profile spectrum: X w Eh 55 dB 50 45 40 35 30 SPATIAL FREQUENCY 2 c/ra 5 10 20 50 100 200 500 1000 I I I I I I I I I I I I I I I I I I I I I I I I I I I 562 jrn. (rms) 316 178 100 5 6 . 2 31 . 6 en D En ( 1 1 1 | 1 ' | • * \ ' ' ' | ' I | I I | I I I | I I | 1 7 . 8 500 200 100 50 20 10 5 2 mm 1 TEXTURE WAVELENGTH
Figure 18. Example of presentation of profile spectrum measured by VTI mobile laser profilometer
Macrotexture measures derived from the surface profile can be utilized in the following areas:
- Prediction of the speed gradient of the wet friction number: If the friction number is known at one speed it will be possible to estimate it at other speeds if the macrotexture is known. This reduces the number of necessary friction measurements.
- Localization of potential low-friction roads: By combining information about the road texture depth with the sharpness of the surface aggregates and the rut depth, it may be possible to locate certain potential low-friction roads. These roads can then be measured with special equipment like the skiddo-meter BV11.
- Drainage property of the road surface: This is a very important factor when considering wet skidding which appears to be predicted quite well from macro-texture data.
- Prediction of rolling resistance: The macrotexture influences tire tread deformation within the contact region and consequently the rolling resistance. The rolling resistance is of great importance for fuel comsumption.
- Tire/road noise: The macrotexture has a distinct in-fluence on tire/road noise. Increases in large-scale macrotexture amplify low-frequency noise while in-creases in fine-scale macrotexture reduce high-frequency noise.
- Prediction of light reflection properties: These may be possible to predict by combining the intensity of the light spot with macrotexture data.
- Macrotexture measurement could also be used to study the abrasion of the aggregates in pavements (see figure 19).
M a c r o t e x t u r e
Figure 19. The macrotexture RMS of profile curve for wavelengths 2-100 mm on nine surfaces correlated to the abrasion*.
Correlation coefficient: 0.92
Regression line: y = -0.0042x + 1.0688
*Abrasion in the aggregate as measured by a standard-ized method used by VTI
A macrotexture measurement and analysis unit is planned to be transferred from the special vehicle used so far to the Laser RST in the near future. As long as our understanding of the fundamental relations between tex-ture and other characteristics is improved, it will improve the ability of predicting - for example - which roads, and which parts of them, are poor in different aspects.
4 AN EXAMPLE OF AN ASSIGNMENT AND DATA PRESENTATION
On the entrance road E4 to Stockholm with a traffic volume of 100 000 vehicles per day rut depth measure-ments had to be done. The road consists of three lanes in each direction. Normally the measurements are
carried out manually with the aid of a straight-edge. A value is measured every 100 meters. There measure-ments are done during night time. The measured lane has to be closed and the traffic is redirected. The risk is considerably high both for the measuring per-sonnel and for the road users.
Instead the road was measured by the Laser RST during daytime at normal traffic speed. No closing of the road was necessary. The readings of a profile with Laser RST are executed with a frequency 20 times higher than that of the manual way. The Laser RST measured the entire object in a few hours compared to weeks with the manual way. The results are printed directly for immediately evaluation. Figures 20a and b show possible ways to present thr results. Figure 20b shows the results for one lane and figure 20a shows the results for all lanes.
E S S I N G E L E D E N 82-OSN-22 dfc ROADNR E 4 L A N E 1 - 3 T / 5 COUNTY 0 2 L A S E R R S I
0 0 - 0 5
RUT .DEPTH lili 0 5 - 1 0 M M 1 0 - 1 5 D I S T A N C E KU 1 5 - 3 0 1LLJ 0 1 2 3 4 5 6 1 1 1 1 ^—1 1 1 1 1 1 1 1 1— « a H a H i « a H = g
m
2«-1 —^HniilJiilB^aC^i:;;;^«^::!^^^!!;^"!?^^ "i »!*iiinTninyi 3-* m m .in^Ecar^jig^^nriirr^^ • h h ^ F R E D H Ä L L S a - SOLNA T U N N E L ÅRSTA Figure 20a. The rut depth results for all lanes. Thevalue of rut depth for each section of a lane is represented with different patterns as shown in the upper right corner of the figure. E S S I N G E L E D E N R O A D N R E 4 L A N E 1 C O U N T Y 0 2 D I S T A N C E L A S E R O E U E N N E S S • F R E D H Ä L L S S O L N A T U N N E L A R S T 1
Figure 20b. The rut depth and evenness results for one lane. The width of the bars represents the sections' length and the height represents the measured variables' mean value for the section. The upper bars show the rut depth ant the lower show the evenness.
5 CONCLUDING REMARKS
A complete measuring vehicle for road surface analysis will be manufactured, but laser units and computer hard- and software will also be available as a separate module system to be built into any car or trailer. In addition to this, the Laser RST will be available for measuring assignments.
Extensive tests of the Laser RST have been carried out. Measurements of rut depth, roughness and distance as well as manual distress registration can be performed at normal traffic speed with high accuracy. Defining data like road numbers etc are preprogrammed and stored together with, the measurement data, all relevant in-formation being simultaneously available directly during measurement. With special program the system can also be used for measurement of skid resistance and macrotexture and in the future, for longitudinal road profile. New programs for the calculation of rut volume and measurement of cracks are under consideration as well as photocell system reacting on objects (reflecting material) near the road or by magnetic sources inside the road for exact location of starting points. Video facilities for automatic documentation of various types of distress will also be a future part of the equip-ment .
When these last things have been finished the system, to save cost, could be used for surveys with only one man. Although the technical equipment is rather expen-sive it is still cheaper than the cost for personnel, calculated per km measured distance. If the personal cost could be reduced to half, the total cost for measured km will be rather low.
Further research will continue to improve the Laser RST. Parallel research is being carried out in the area of decision-making to give priority to important
variables, and efforts are being made to encourage the rOad authorities to use the data. As knowledge about the influence of road variables on costs to road users, traffic safety and road service life is still rather limited, subjective methods by experts in different fields have to be used. A general use of objective and powerful measuring systems like the RST will stimulate the development of decision-making models as well as further research and cooperation on an international basis.
REFERENCES
ALM, Lars-Olof, Spårbildning i vägbeläggningar. Olägen-heter. Kritiska spårdjup och mätmetoder. (Road pave-ment rutting - hazards, critical depths and measur-ing methods)*
VTI Report 129, 1977.
ALM, Lars-Olof, Mätning av vägbeläggningars makrotextur för friktionsbedömning. Principer och mätmetoder.
(Measurement of road surface macrotexture for skid resistance prediction. Principles and measuring metods)*
VTI Report 163, 1979.
ARNBERG, P.W., Litteraturgenomgång och diskussion av vägojämnheters betydelse för komfort och prestation.
(Literature survey and discussion of the influence of road roughness on comfort and performance)* VTI Internrapport 134, 1973.
ARNBERG, P.W. and HELLSTRÖM, Å., Betydelsen av "stimu-lusfelet" för ISO och VDI komfortnormer vid till-lämpning på vägojämnheter. (The importance of the "stimulus error" to the ISO and VDI comfort stan-dards applied to road roughness)*
University of Stockholm, Psychological Institution, Memorandum, 1973.
ARNBERG, P.W. and MAGNUSSON, G., Mätning och utvärde-ring av vibrationer alstrade av vägojämnheter.
Föredrag vid specialsymposiet "Helkroppsvibrationer11
12 november 1980. (Measurement and evaluation of vibrations produced by road roughness.)*
Ingenjörsvetenskapsakademien, kommittén för vibra-tionsfrågor, Arbetsgrupp 8 - Vibrationers inverkan på människan.
VTI Separate impression.
ARNBERG, P.W., CARLSSON, G. and MAGNUSSON, G., Inverkan av vägojämnheter. En problemanalys.
(The influence of road roughness. Analysis of prob-lems ) *
VTI Meddelande 95, 1978.
ARNBERG, P.W., MAGNUSSON, G. and OHLSSON, E., Mätning vid hög hastighet av olika vägkarakteris-tika. Problemanalys samt utvärdering av metod för vägojämnhetsmätning. (High speed measurement of different road surface characteristics.)* VTI Meddelande 15 4, 1979.
* available only in Swedish VTI REPORT 2 55A
ARNBERG, P.W. and ÅSTRÖM, G., Vägojämnheters inverkan på bilförares prestation och trötthet. (The
influ-ence of road roughness on drivers1 performance and
tiredness. A literature survey and a simulator experiment.)*
VTI Report 181, 1979.
ARNBERG, P.W. and MAGNUSSON, G., Jämnhet och spårdjup samt subjektiva bedömningar vid provinventeringen 1979. (Evenness, rut depth and subjective rat-ings at the test survey in 1979.)*
VTI Work Report, 19 79.
ARNBERG, P.W., Inventering med vägytemätbil, Saab RST, 1980. Inventerarnas och förarnas uppfattning om mätfordonet och inventeringsmetoderna. (Road survey carried out in 1980 with the Road Surface Tester
(Saab RST). Sub-report on the road engineers and the drivers attitudes to the test equipment and the method utilized.)*
VTI Meddelande 250, 1981.
ARNBERG, P.W. and SJÖGREN, L., Nordiska jämnhetsmätare. En jämförande studie. (Evenness measuring vehicles used in Scandinavia. A comparative study.)*
VTI Meddelande 332, 1983.
ARNBERG, P.W. and SJÖGREN, L., Nordiska friktionsmät-bilar. En jämförande studie. (Friction measuring vehicles in Scandinavia. A comparative study)* VTI Meddelande 333, 1983.
ARNBERG, P.W. and SJOGREN, L., Nordiska spårdjupsmätare. En jämförande studie. (Rut depth measuring vehicles in Scandinavia. A comparative study.)*
VTI Meddelande 334, 1983.
ARNBERG, P.W., The Laser Road Surface Tester. A new road measuring system developed by the National Swedish Road and traffic Reserach Institute. Paper presented in the US and Japan, December 1981. ARNBERG, P.W., The influence of road roughness on
driver performance and fatigue. A paper prepared for the conference "Truck Ride Quality and Highway Safety - Is there a Connection" at The University of Michigan, Ann Arbor, January 24-26, 1982. GYNNERSTEDT, G., Road geometric design as a function
of level of service and road users' cost by traffic simulation.
VTI Meddelande 192, 1980. * available only in Swedish
HAMMARSTRÖM, U. and ERICSSON, T., Samband mellan for-dons kostnader och väg- och trafikmiljö. Litteratur-studier. (Effects of road design and traffic condi-tions on vehicle operating costs. A study of the literature.)*
VTI Report 154, 1978.
HAMMARSTRÖM, U., Bilars värdeminskning. Värdeminsk-ningens beroende av miljö, körlängd och tid.
(Vehicle depreciation. Effects of road standard, mileage and age.)*
VTI Meddelande 182, 1979.
KIHLGREN, B., Slitage av bildäck vid körning på äldre ytbehandling och asfaltbetong. (Tyre wear caused by driving on old and used surface treatment and
asphalt concrete.)*
VTI Meddelande 236, 1980.
LILJA, B. and OHLSSON, E., Faktorer som medverkar till låg friktion mellan vildäck och vägbana. (Factors contributing to low friction between car tyre and road surface.)*
VTI Report 52, 1974.
LUNDKVIST, S-O., HELMERS, G. and YTTERBOM, U., Specific luminance measurements of road markings and road surfaces in the field. Comparisons between instruments.
VTI Report 188A, 1980.
LUNDKVIST, S-O. and S0RENSEN, K., Reflection properties of road markings in vehicle headlight illumination. VTI Report 189A, 1980.
MAGNUSSON, G., Inventering av utländska bestämmelser och standardkrav för vägars jämnhet. (An inventory of foreign regulations and standard demands regard-ing road roughness.)*
VTI Report 84, 1976.
MAGNUSSON, G. and ARNBERG, P.W., The rating and measuring of road roughness.
VTI Report 83A, 1976.
MAGNUSSON, G., ARNBERG, P.W. and PETTERSSON, H-E., Mätning och bedömning av ojämnheter på grusväg. (The rating and measuring of road roughness on gravel roads.)*
VTI Report 123, 1977.
MAGNUSSON, G. and ARNBERG, P.W., Vägojämnhetens inver-kan på broms- och styrbarhet. (The influence of road roughness on the braking and steering perform-ance of cars: A literature study.)*
VTI Report 134, 1977.
MORËN, B., ARNBERG, P.W., MAGNUSSON, G. and SANDBERG, U., Unpublished VTI working paper.
NORDSTROM, 0. and OHLSSON, E., Description of friction test vehicle No 5 of the National Swedish Road and Traffic Research Institute.
VTI Report 2, 1971.
NILSSON, A. and OHLSSON, E., Aqua planing Tests, 1967 to 1969. Investigation of Braking Action Developed by Motor Car Wheels.
VTI Meddelande 193, 1980.
OHLSSON, E., Friktionsmätvagn BV 11. Handbok. (Friction measuring vehicle BV 11. Manual.)*
VTI Meddelande 157, 1979.
OHLSSON, E., Friktionsmätning på rullbanor och vägar. (Friction measurement on runways and roads.)* VTI Report 177, 1979.
OLOFSSON, G., Bränsleförbrukningens beroende av belägg-ningens typ och standard. En pilotstudie. (The dependence of fuel consumption on the type and standard of the road surface.)*
VTI Meddelande 152, 1979.
RÅHS, K., Vägjämnhetssimulatorer - en funktionsbeskriv-ning. (Road roughness simulator - a function descrip-tion . ) *
VTI Report 184, 1979.
SANDBERG, U., Road Surface Characterization With Respect to Tire/Road Noise - Summary of Characteri-zation Methods. STU-report 76-6618/77-6232/78-5650/ 79-5618, National Swedish Board for Technical
Development, 1982.
SANDBERG, U., The Development of a Laser Profilometer for Mobile Macrotexture Measurement.
VTI report (for publishing in 1983)
SCHANDERSSON, R., Samband mellan vägbeläggningar och trafikolyckor 1977. (Connection between road surfaces and traffic accidents in 1977.)*
VTI Meddelande 242, 1981. * available only in Swedish VTI REPORT 255A
SINHA BRAJNANDAN, Influence of road unevenness on road holding and ride comfort.