Mining Rare Cases in Post-Operative Pain by Means of Outlier Detection
M. U Ahmed, P. Funk
School of innovation, design and engineering Mälardalen University, SE-72123 Västerås, Sweden
mobyen.ahmed@mdh.se
Abstract - Rare cases are often interesting for health
professionals, physicians, researchers and clinicians in order to reuse and disseminate experiences in healthcare. However, mining, i.e. identification of rare cases in electronic patient records, is non-trivial for information technology. This paper investigates a number of well-known clustering algorithms and
finally applies a 2nd order clustering approach by combining the
Fuzzy C-means algorithm with the Hierarchical one. The approach is used in order to identify rare cases from 1572 patient cases in the domain of post-operative pain management. The results show that the approach enables identification of rare cases in the domain of post-operative pain management and 18% of cases are identified as rare case.
Keywords- rare cases, clustering, case mining, medical informatics, information technology, post-operative pain
I. INTRODUCTION
Rare cases can often be seen as outliers since they are an observation of data that deviates from the regular observation i.e. they do not comply with general behaviour of the data [1]. In the project PAIN OUT1, clinicians
suggest that approximate 10-30% of the post-operative patients do not fit with recommended procedures due to individual factors and unusual or exceptional clinical situations. Cases that do not follow any standard protocol can be classified as “rare case”. These “rare cases” often needed adaptation of standard procedures and personalised treatment. Moreover, outcome of these patients using different treatment by clinicians and hospitals may vary and the interesting cases are patients who experienced severe or little pain. The outcome scale is defined as a range from 0 to 10 with the average value of the all pain measurements scale. The patients who have experienced “no or little pain” are defined as exceptionally good cases and those who have experienced “severe pain” or close to “severe pain” are defined as unusually bad cases in the “rare case” group. Severe pain may cause further medical problems and slow recovery. These rare cases are important to consider and could be used in a clinical decision support system (CDSS) [2], using rare cases the system could generate a warning and give references to similar bad or good cases. This will help a clinician to formulate an individual treatment plan. The quality of individual post-operative pain management can be improved if relevant similar cases and experience are presented for the clinician, especially if the patient needs
1 This research is funded by EU FP7 project PAIN OUT,
http://www.pain-out.eu
special medical consideration. Therefore, identification of rare cases is important in the domain of post-operative pain treatment.
Outlier detection aims to mine cases that carry uncommon events, deviant objects, and exceptions [3]. In data mining, unlike statistical methods, the clustering-based approach is one that is used to identify outliers [4] with little or no knowledge about data distribution. Clustering algorithms can be used directly or after combination [5][6][7]. In this paper, a number of clustering algorithms are explored in order to propose a clustering-based approach to identify rare cases in the medical domain. K-means, Fuzzy C-means (FCM), Gaussian mixer model and Hierarchical clustering have been identified as promising choices. These algorithms are compared based on variance, frequency, execution time and percentage of identified cases. Finally, a 2nd order clustering approach is proposed
that combines the FCM algorithm with the Hierarchical clustering algorithm. Here, an experimental work is carried out with 1572 cases (with 100% data availability) from post operative pain management domain. From the experimental work, 17.60% of the total cases (276 out of 1572) have been identified as rare through the 2nd order clustering approach.
Further, a comparison among the four well known clustering algorithms has been done using the same data set and the results are presented and discussed in the paper.
The paper is organized as follows; related work is outlined in chapter 2. Chapter 3 gives an overview of the materials together with the relevant methods. The approach for combining the clustering methods (FCM and Hierarchical) is presented in chapter 4. In chapter 5, the experimental works and the corresponding results are presented and discussed in chapter 6. Finally in chapter 7, the paper is concluded with the summary and main contribution of the paper.
II. RELATED WORK
A research effort has been carried out through a literature study, where outlier detection in post-operative pain management has been investigated. It seems that identification of rare cases in this domain is not available. However, some work has been found in medical domains where outliers are identified using clustering-based approaches on single and/or multidimensional data sets. In [5], a clustering technique is used together with Thompson’s Tau method in multidimensional medical data. Similarly, in paper [8], the authors have proposed an
approach that determines outliers in two stages 1) 1st all the
datasets are clustered into several groups and then 2) gained clusters identify the outlier cluster. A comparison among different well known clustering algorithms is also presented in [7] and [9]. In addition, a detailed literature study that has been conducted to identify widely used clustering methods is summarised in the next chapter.
III. METERIALS AND METHODS
The PAIN OUT project is creating the “European Pain Registry” with data obtained from patients in 11 hospitals throughout Europe. The data is collected by the research assistants or doctor/nurse/pharmacist using a questionnaire which composes mainly in two parts: 1) information about patient’s history, pre-medications, screening, demographics and treatment 2) patient outcomes using the American Pain Society-Pain Outcome Questionnaire-Revised (APS-POQ-R) [10]. From the pain registry, 3793 patient’s records with in total 1026 attributes including system fields (database ids, dates, etc.) were used in this part. However, only 1572 patient’s records were selected for this study based on completeness, i.e. 100% data availability were checked through a ‘data pre-processing’ step.
A. Data pre-processing
The data pre-processing has been started through a case formulation (each record as a case) where each patient’s records are divided into three parts. They are 1) all the patient’s related information, medical history, pre-medications, screening and demographics are formulated as problems 2) treatment and/or medication information during operation, recovery room and ward are formulated as solutions and 3) pain measurements along with patient’s perception are formulated as outcomes. Here, problems part of the cases is used in clustering process and outcomes part of the cases is used for classification. A feature abstraction has been done on the problems and outcomes in order to reduce number of attributes and finally 17 features are selected to formulate a case. Note that, the solutions part contains around 685 attributes, which is not further considered for clustering process since they contain important medicine information that might be destroyed during abstraction. The possible values of each abstracted feature are either 0 = if the answer(s) is ‘No’, or any positive value (> 0) = if the answer(s) is ‘Yes’ and have information, or -1 = if the information is not available i.e. empty. For the outcome the value is either between 0 and 10 or -1 if it is totally empty. A percentage of all positive value for each case is calculated and the cases those have 100% of positive value are considered for case mining. The cases with missing values or empty features are excluded since they may affect the clustering process, the value of feature D3 (weight) =102 kg and -1 is one example case scenario. Thus, a case library is formulated containing 1572 cases with 17 features. Table 1 shows an example of the
case library after features abstraction with few patient’s records as case, where ID= Case id, S1= Inclusion criteria, S2= Sleep or Seduction level, D1=Gender, D2=age, D3=Weight, D6=Language, D8= Comorbidities, D9= Existing state, D10= Chronic pain, D11= Opioid before admission, M1= Sedatives (pre-medication), M2= Non-opioids pre-medication), M3= Opioids pre-medication), D12= Surgical procedure(s), D12a= Major surgical procedure, outcome= Average value of pain measurements (0-10 scale). A discussion about case formulation and feature abstraction is presented in [2].
Table 1.An example of the case library after the features abstraction. ID S1 S2 D1 D2 D3 D6 D8 D9 D10 D11 M1 M2 M3 D12 D12a outcome 321 0.60 1 1 63 77 1 1 0 1 1 1 1 0 1 309 2.37 382 0.60 1 1 33 102 1 1 0 0 0 1 0 0 2 4389 5.68 402 0.60 1 1 64 69 1 1 0 0 0 0 0 0 1 4863 3.17 423 0.60 1 0 60 62 1 1 0 1 0 0 0 0 1 8151 7.17 425 0.60 1 0 65 77 1 0 0 0 0 0 0 1 1 8152 5.17 B. Methods
According to Barnet and Lewis, ‘an outlier is an observation that is numerically distant from the rest of the data’ [11]. Again, Johnson described in [12], an outlier is an observation in a data set which appears to be inconsistent with the rest of data in that set.
Various ways could be used to mine rare cases by means of outlier detections. For example, Statistical methods, they are generally based on a known underlying distribution of the observations [11] [13]. Using the method, the deviated observations can be extracted from normal distribution as outliers. However, the method is not suitable for our data set since the knowledge of underlying data distribution of our multi-dimensional data set is unknown. Another way is to apply Density based approach where each object belongs to a group is assigned a degree of being an outlier and the degree is termed as Local Outlier Factor (LOF) [14]. However, the value of LOF which depends on dataset i.e. LOF = 1.2 could be used to determine outliers in one data set whereas in another data set LOF = 2 (i.e even more then 1.2) could not be used to determine outliers.
This paper focuses on clustering-based approched in order to indentify rare cases in post-operative pain domain. A literature study through the well known search engines (Google Scholar, IEEE Xplore, Science Direct and Web of Science) has been conducted to select most well known clustering methods. Arround 50 articles have been selected for the study where clustering algorithms, outlier detection, and data-mining are used as keywords. In Table 2 a summary of the number of articles relevant to each particular clustering methodology is shown. It has been observed that certain methodologies are more common in applications than others because of their simplicity and flexibility to apply them in different domains. Thus, the top four well known clustering algorithms (K-means, Fuzzy C-means (FCM), Gaussian mixer model and Hierarchical) are
selected for a comparison using post-operative pain data set. However, only FCM and Hierarchical are applied in a 2nd
order clustering manner since they have shown (according to this study and experimental work) to be well suited for the domain in order to mining the rare cases.
Table 2. Different clustering algorithms and the relevant articles.
SL No
Clustering Algorithms
Articles Ref. Total No. of Articles
1 Fuzzy C-means (FCM) [7, 15, 16, 17, 18, 19, 20] 7
2 Hierarchical [4, 21, 22, 23, 24, 25, 26] 7
3 K-means [6, 20, 27, 28, 29, 30] 6
4 Gaussian matrix model [31, 32, 33, 34, 35] 5
5 Genetic [36, 37, 38, 39] 4
6 Density based [40, 41, 42] 3
7 Neural Network (Self
Organizing Maps/ART)
[43, 44] 3
8 Evolutionary [45] 1
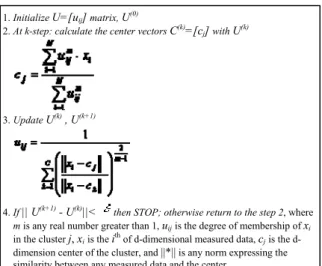
FCM also referred to as soft clustering, is an unsupervised clustering algorithm that has been applied to a wide range of problems involving feature analysis, clustering and classifier design. It is similar in structure to the K-means algorithm and also behaves in a similar way [19][20] except that the fuzzy behaviour is also considering. It is a clustering method that allows one piece of data to belong to two or more clusters. It associates each element that represents a set of membership levels. The algorithm is presented in several steps in Fig. 1.
Fig. 1. Algorithm and steps of the FCM clustering [20] technique The Hierarchical algorithm clusters data over a variety of scales by creating a hierarchical structure (tree) or dendrogram. The tree is not a single set of clusters, but rather a multilevel hierarchy, where clusters at one level are joined as clusters at the next level [9]. It is then further divided into two categories bottom up i.e., agglomerative and the top down i.e., divisive clustering. To perform agglomerative Hierarchical cluster on a data set the algorithm uses the following procedures:
1. It calculates the distance between every pair of objects in a data set in order to find similarity or dissimilarity. 2. It collects or groups the objects into a binary,
hierarchical cluster tree. Here, pairs of objects that are close to each other are linked. Since all the objects are paired into the binary clusters, newly formed clusters are grouped to larger clusters until a hierarchical tree is formed.
3. It determines cutting position of the hierarchical tree into clusters. Here, it prunes the branches off at the bottom of the hierarchical tree, and assigns all the objects below the cutting point to a single cluster.
IV. THE 2nd ORDER CLUSTERING APPROCH
For the clustering purpose only the problem part (i.e 15 features excluding ID and outcome) of the cases are considered and the clustering is conducted in two stages. The FCM is applied in 1st stage and the Hierarchical
algorithm is applied in 2nd stage on each clusters (achieved
in 1st order clustering) and thus the term “2nd order” is
introduced in the approch. Fig. 2 illustrates the steps that are taken into consideration during searching the rare cases.
Fig. 2. Steps of the approach in order to identify rare cases, ot is the outcome value as pain measurements.
A data pre-processing including feature abstraction step is performed on the 3793 records of post-operative pain patients. In total 1572 cases with 17 features (1 for case ID, 15 for problems and 1 for outcomes) are obtained after the data preprocessing step which is discussed in the previous chapter. However, only 15 features in the problems part of the cases were used in clustering. All the clustering algorithms and the user interface to identify rare cases are developed in MATLAB and applied MATLAB build-in clustering functions.
Fig. 3. Determining the number of clusters considering percentage of average variance. 3793 patient’s records with 1026 attributes 1572 cases with 15 features data preprocessing 9 clusters between 46 and 391 cases 276 rare cases out of 1572 cases Determines 104 exceptional good
cases with better outcome, 158 unusual cases with severe
outcome Case classification 2nd order clustering on 9 clusters achieved from 1st order using Hierarchal
1. Initialize U=[uij] matrix, U(0)
2. At k-step: calculate the center vectors C(k)=[c
j] with U(k)
3. Update U(k) , U(k+1)
4. If || U(k+1) - U(k)||< then STOP; otherwise return to the step 2, where
m is any real number greater than 1, uijis the degree of membership of xi
in the cluster j, xiis the ith of d-dimensional measured data, cjis the
d-dimension center of the cluster, and ||*|| is any norm expressing the
similarity between any measured data and the center.
pe rcent age o f v ar ian ce 1st order clustering using FCM
The 1st order clustering has been done using FCM
algorithm on the problems part of the cases. FCM is applied as a multi-variant clustering where 15 features are involved excluding ID. The main goal of this stage is the pertitioning, i.e. all the cases should be divided into several small groups with similar frequency. Here, the percentage of average variance (i.e. algorithm runs 10 times for each k) is used as a function to determine the number of clusters. Fig. 3 presents the percentage of average variance explained by the clusters against the number of clusters. As shown in Fig, the lowest percentage of average variance is achieved when the number of clusters is 9. The lowest variance was considered (i.e., 12066) among all the clusters and clustering algorithms. Thus, 9 clusters are obtained, the smallest with 46 cases and the largest with 391 cases.
In the 2nd order, these 9 clusters are used and the
Hierarchical clustering algorithm is applied in each cluster. In Hierarchical, the distance between pairs of objects is calculated using Euclidean distance as a default parameter of the MATLAB function ‘pdist’. The linkage function applies ‘single’ (i.e. shortage distance) as default parameter which determines the objects in the data set that should be grouped into clusters. Finally, a cluster function is applied to group the sample data set into clusters by specifying the cluster’s number. Here, the cluster’s number is determined by observing the percentage of the case frequency. That is, the algorithm continues it’s iteration by increasing the number of clusters as long as at least two clusters obtained more than 10% of whole cases. Then, the clusters with small sizes (i.e. less than 10 %) are selected as the rare case cluster and thus the approach has achieved 17.60% (i.e. 276 out of 1572) as rare cases.
The last step in Fig. 2, determines the 232 cases whether they are exceptionally good (0-3.9) or unusual bad (6-10) according to pain outcome (the threshold for good/bad may be changed). The attribute outcome is the average value of the pain measurements for each case. A clinician may be most interested in the extreme cases first (0/10) when looking for similar case among the rare cases. Thus, the approach obtained 158 cases as unusual bad and 104 cases as exceptionally good. Only 14 cases with the outcome value between 4 and 5 are exist among the set of rare cases.
V. EXPERIMENTAL WORKS AND RESULT
In the experimental works, the four clustering algorithms are compared with each other, considering execution times, frequencies and variances. Since the main goal in 1st order
clustering is to partition the whole cases into smaller groups with lower variance (i.e. cases are more or less equally distributed), the objective of the comparisons is to identify the appropriate technique for partitioning. In Table 3, the execution time of each algorithm with increased number of clusters is presented. Here, both the problems (with 15 features excluding ID) and outcomes (with 1 feature) parts are used as multi-variant and single-variant clustering.
However, the problems part of the cases is not well fitted for the algorithm Gaussian matrix model. It can be seen from the table that the K-means algorithm executes with less elapsed time both the parts of the cases. Similarly, FCM algorithm shows better partitioning compare to the other methods and the frequency i.e. number of cases in each cluster is presented in Table 4.
Table 3.Comparesion results between the clustering algorithms considering the problems and outcomes parts of the cases, the elapsed time of each
algorithm with increased number of clusters are presented.
Parts of
the cases ClustersNo. of meansK Fuzzy C means Gaussian Hierarchical
Mu lti-va ri an t ( 15 fe at ur es ) on problem s p art of th e cas es 2 0.011 0.74 D at a d is tri bu ti on is not s uit ab le to fit by t he al gor ithm 1.23 3 0.071 0.32 0.68 5 0.025 0.59 0.68 10 0.058 0.62 0.69 15 0.062 0.83 0.67 20 0.660 0.66 1.05 30 0.290 0.961 0.69 S ing le-var ia nt ( 1 fea tu re ) on outc om es par t o f the ca se s 2 0.016 0.098 0.781 3.79 3 0.019 0.106 0.209 4.19 5 0.018 0.178 0.311 3.78 10 0.046 0.476 0.480 3.72 15 0.100 0.328 0.634 3.65 20 0.065 0.508 0.799 4.06 30 0.053 0.912 1.178 3.71
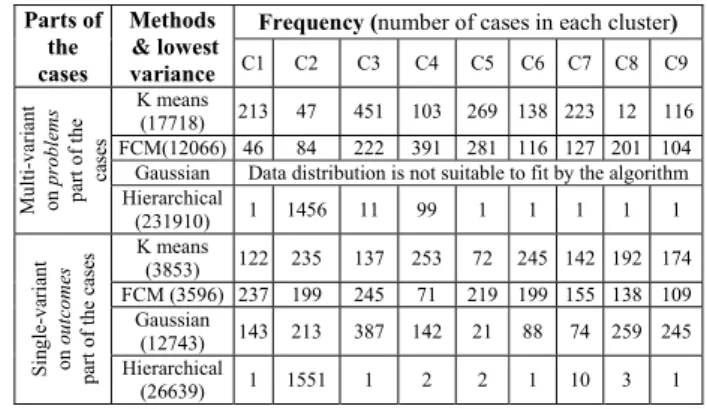
Table 4. Comparisons results between the clustering algorithms considering the problems and outcomes parts of the cases, the frequency of
each cluster (when number of clusters is 9) is presented.
Parts of the cases Methods & lowest variance
Frequency (number of cases in each cluster)
C1 C2 C3 C4 C5 C6 C7 C8 C9 Mult i-vari an t on pro ble ms pa rt of th e ca ses K means (17718) 213 47 451 103 269 138 223 12 116 FCM(12066) 46 84 222 391 281 116 127 201 104
Gaussian Data distribution is not suitable to fit by the algorithm
Hierarchical (231910) 1 1456 11 99 1 1 1 1 1 S ing le -v ari an t on ou tc om es par t of th e c ase s K means (3853) 122 235 137 253 72 245 142 192 174 FCM (3596) 237 199 245 71 219 199 155 138 109 Gaussian (12743) 143 213 387 142 21 88 74 259 245 Hierarchical (26639) 1 1551 1 2 2 1 10 3 1
Fig. 4 presents comparisons between the clustering algorithms using Probability Distribution Function (PDF) or bell curves where the number of cases in each clusters obtained with lowest variance. Here, FCM shows better distribution of cases for each cluster since the PDF peak is high and the width is low. In Fig. 5, the variance value against the number of iterations (i.e. same algorithm runs with 9 clusters again and again) of each algorithm are illustrated. As the figure shows, FCM obtained lower variances for most of the iterations considering both the problems and outcomes parts of the cases. It could be observed that Hierarchical clustering algorithm is suitable for identifying outliers and FCM is suitable for partitioning the whole cases into smaller groups. However, only 22 cases out of 1572 i.e. only 2% cases are identified by the Hierarchical algorithm when there are 9 clusters.
Fig. 4. Probability Distribution Function (PDF) curves comparing the algorithms on the problems (A) and the outcomes (B) parts of the cases.
Fig. 5. Variances vs. number of iterations for k-means and FCM on the problems (A) and outcomes (B) parts of the cases.
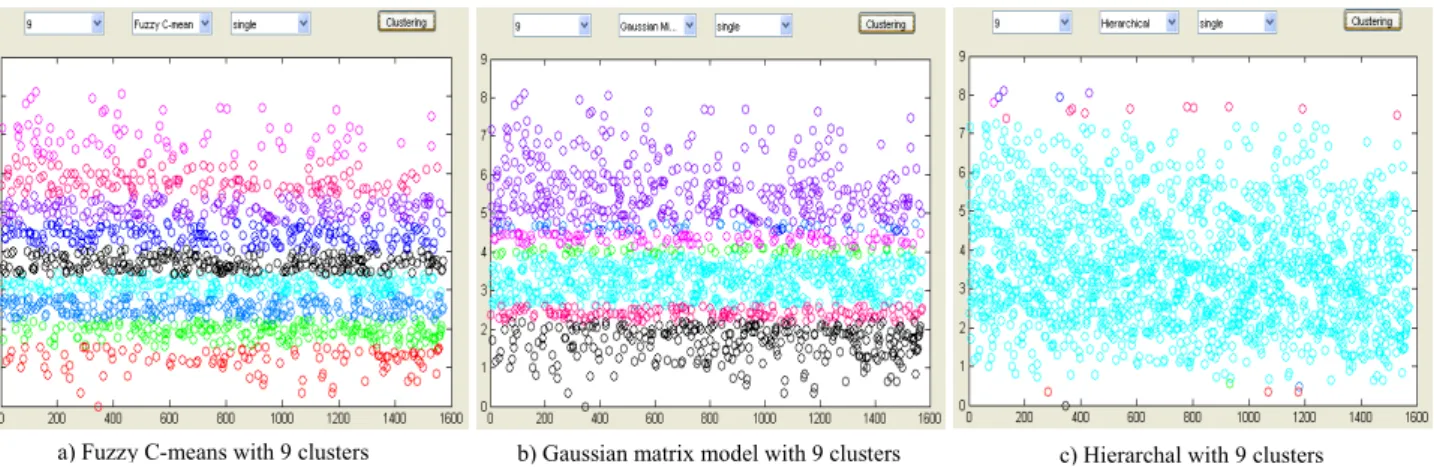
Fig. 6. Graphical comparison on FCM (a), Gaussian (b) and Hierarchical (c) on the outcomes parts of the 1572 cases. Table 5. FCM on outcomes part of the cases, the frequency of each cluster
i.e. number of cases for each cluster (when number of clusters is 9) in several iterations are presented.
No. of Iterations & Variance
Frequencies for Fuzzy C-means (number of cases in each cluster) C1 C2 C3 C4 C5 C6 C7 C8 C9
It.1. (35965) 245 237 71 109 199 219 155 199 138
It.2. (35965) 109 237 219 199 138 245 71 199 155
It.5. (35965) 71 245 199 219 199 155 109 237 138
It.8. (35965) 219 237 138 199 109 71 245 155 199
It could also be observed that the variance of FCM clustering considering the outcomes part of the cases (B in Fig. 5.) is same for all the iterations, only the sequences of the clusters are changed as presented in Table 5.
A. Result
Among the 1572 cases there are 371 cases containing outcome value greater or equal to five i.e. 23.6% patients have experienced severe pain and 1201 cases containing outcome value less than to 5 i.e. 76.4% patients have experienced less or no pain. While combining the implementation of the FCM and Hierarchical algorithms, the 2nd order clustering approach has succeeded to identify
17.6 percent cases as rare from the whole cases. Among the rare cases ≈ 57.25% of the cases are found as unusual bad and ≈ 37.68% of the cases are found as exceptionally
A
B
A
B
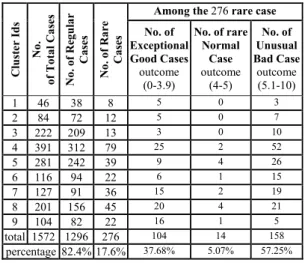
good. However, about 5% of the rare cases contains outcome between 4 and 5. Table 6 presents the total number of cases, rare and regular cases for each cluster.
Table 6. Rare (both good and bad), regular and total cases for 9 clusters.
Clus te r Id s No . of To ta l Ca se s No. of Re gular Ca se s No . o f Ra re Ca se s
Among the 276 rare case No. of Exceptional Good Cases outcome (0-3.9) No. of rare Normal Case outcome (4-5) No. of Unusual Bad Case outcome (5.1-10) 1 46 38 8 5 0 3 2 84 72 12 5 0 7 3 222 209 13 3 0 10 4 391 312 79 25 2 52 5 281 242 39 9 4 26 6 116 94 22 6 1 15 7 127 91 36 15 2 19 8 201 156 45 20 4 21 9 104 82 22 16 1 5 total 1572 1296 276 104 14 158 percentage 82.4% 17.6% 37.68% 5.07% 57.25% VI. DISCUSSIONS
In order to identify rare cases in post-operative pain domain, this paper focuses on several clustering algorithms. The motivation behind the focus on cluster– based approach is that clustering algorithms also work without knowledge of the data distribution whereas statistical methods are dependented on knwoldege of data distribution. Clustering methods are also able to handle large databases and high dimensional data structures. Using the algorithms data can be clustered randomly and there is no need to calculate LOF like the Density based approach. The experimental works show that the Hierarchical algorithm is working well to identify outliers and FCM is the best among the others in order to divide large data set into several smaller data sets. However, FCM takes more execution time than k-means and less than the Hierarchical and Gaussian matrix model. The number of clusters is determined by considering the average variance of 10 times iteration of the FCM algorithm. The Hierarchical algorithm is also applied in the whole cases (1572) without splitting them into smaller groups. However, the result obtained using this algorithm was not acceptable. The algorithm has succeeded to determine only 2% of cases as rare when there are 9 clusters. In addition, Hierarchical clustering algorithm is performed by considering the relative distance rather by finding out the less and exceptional population. This is why the whole cases are divided into several smaller groups in 1st order
clustering and then in 2nd order clustering, the Hierarchical
clustering is applied on the problems part of the cases. This strategy provides improved result for determining the rare cases. As we have mentioned earlier in the introduction chapter, in post-operative pain management domain it is of value to identify rare cases. By applying the 2nd order
clustering approach in pain out data sets it shows that around 18% of cases are identified as rare case. However, validation by an expert of the domain is important to see whether the identified cases are really rare cases and determine the accuracy of the number of rare cases will be performed. Among all cases (i.e. 1572), 23.6% of the cases are unusual bad considering the outcome value greater or equal to 5 of the cases. Again, among the rare cases (i.e. 276), around 57.25% of the cases are also classified as unusual bad by the approach. This could be interpreted that it is more difficult to secure a good pain treatment for the rare cases. Clinical findings are beyond the scope of this paper but an ongoing part of the PAIN-OUT project.
VII. CONCLUSIONS
Identification of rare cases is valuable in any medical domain such as in post-operative pain management. Rare case mining in terms of outlier detection is a topic that achieves increasing attention by researchers in information technology. This paper combines the FCM and Hierarchical clustering algorithms in 2nd order clustering
manner in order to mine rare cases. The main contributions of the paper is twofold, 1) investigation of popular clustering methods through a literature study and compare them in order to identify suitable methods those fits better with the post-operative pain data set. 2) implementation of the 2nd order clustering approach where the FCM and the
Hierarchical algorithms are combined. The experimental work has been done considering 1572 patients records in post-operative pain domain and it shows that the approach is suitable and well fitted for this domain. Finally, 18% of cases from the whole cases library i.e. 276 out of 1572 are identified as rare cases. In an overall goal of reducing pain it shows that with the given dataset the proposed approach are able to identify “rare cases” that often cause high level of pain (57% compared with 23.6%) without including the pain level i.e. outcome in the clustering. The result will be a part of an overall approach to improve the quality of individual pain management in the PAIN OUT project.
REFERENCES
[1] G. Williams, R. Baxter, H. He, S. Hawkins and L. Gu, A Comparative Study for RNN for Outlier Detection in Data Mining. In
Proceedings of the 2nd IEEE International Conference on Data
Mining, Maebashi City, Japan, December 2002, page 709,
[2] M.U. Ahmed, P. Funk, A Case-Based Retrieval System for Post-operative Pain Treatment, accepted in the International Workshop Case-Based Reasoning CBR 2011, IBaI, Germany , New York/ USA, Editor(s):Petra Perner, September, 2011
[3] M.O. Mansur, and M. Noor Md. Sap, Outlier Detection Technique in Data Mining: A Research Perspective, In: Postgraduate Annual Research Seminar 2005.
[4] Loureiro L. Torgo, and C. Soares, Outlier Detection Using Clustering Methods: a Data Cleaning Application, In the proceedings of the data mining for business workshop, 2004
[5] M.S. Anbarasi, S. Ghaayathri, R. Kamaleswari,and I. Abirami, Outlier Detection for Multidimensional Medical Data, International
Journal of Computer Science and Information Technologies, Vol. 2 (1) , 2011, 512-516
[6] Y. Kyung-A, K. Oh-Sung, and B. Doo-Hwan, An Approach to Outlier Detection of Software Measurement Data using the K-means Clustering Method, 1st International Symposium on Empirical
Software Engineering and Measurement, ESEM 2007, Madrid, 20-21 Sept. 2007, pp: 443 - 445
[7] H. Guldemır, and A. Sengur, Comparison of clustering algorithms for analog modulation classification, Expert Systems with Applications, vol 30, 2006, pp: 642–649
[8] J. Sheng-Yi, and Y. Ai-Min, Framework of Clustering-Based Outlier Detection, 6th International IEEE Conference on Fuzzy Systems and
Knowledge Discovery, ISBN: 978-0-7695-3735-1/09, 2009
[9] G. Chen, S. A. Jaradat, N. Banerjee, T.S. Tanaka, M.S.H. Ko, M.Q. Zhang, Evaluation and comparison of clustering algorithms in anglyzing es cell gene expression data, Statistica Sinica, Vol. 12 2002, pp. 241-262
[10] D.B Gordon, R.C Polomano, T.A Pellino, D.C Turk, L.M McCracken, G. Sherwood, J.A Paice, M.S Wallace, S.A Strassels, J.T Farrar, Revised American Pain Society Patient Outcome Questionnaire (APS-POQ-R) for quality improvement of pain management in hospitalized adults: preliminary psychometric evaluation, Journal of Pain,11(11), 2010, pp:1172-86.
[11] V. Barnett, T. Lewis, Outliers in Statistical Data, John Wiley, 1994. [12] R. Johnson, Applied Multivariate Statistical Analysis, Prentice Hall,
1992.
[13] P. Rousseeuw, A. Leory, Robust Regression & Outlier Detection, Wiley Series, in Probability and Statistics, 1987.
[14] M. Markus, K. Hans-Peter, T. Raymond & S. Jörg, LOF: Identifying Density-Based Local Outliers, ACM 2000 1-58113-218-2/00/05. [15] L. Zhide, C. Jiabin, S. Chunlei, A New RBF Neural Network with
GA-based Fuzzy C-Means Clustering Algorithm for SINS Fault Diagnosis, Control and Decision Conference, 2009. CCDC '09. Pp: 208 - 211
[16] Z. Lin, C. Fu-Lai, & W. Shitong, Generalized Fuzzy C-Means Clustering Algorithm With Improved Fuzzy Partitions, Transaction On Systems, Man & Cybernetics- Part B: Cybernetics, Vol 39, No.3, June 2009, 1083-4419/ 2008.
[17] L. Jingwei, & X. Meizhi, Kernelized Fuzzy Attribute C-Means Clustering Algorithm, Fuzzy Sets and Systems, vol. 159, 2008, pp: 2428 – 2445
[18] A. Mohanad, M. Mohammad & R. Abdullah, Optimizing of Fuzzy C-Means Clustering Algorithm Using GA, World Academy of Science, Engineering and Technology, vol. 39, 2008
[19] C. Somporn, L. Chidchanok, S. Peraphon, & S. Suchada, Fuzzy C-Means: A Statistical Feature Classification of Text and Image Segmentation Method, International Journal of Uncertainty, Fuzziness and Knowledge-Based Systems (IJUFKS), Vol. 9, Issue. 6 , 2001, pp. 661-671
[20] T. Velmurugan, T. Santhanam, Performance Evaluation of K-Means and Fuzzy C-Means Clustering Algorithms for Statistical Distributions of Input Data Points, European Journal of Scientific Research, vol.46, No.3, 2010, pp.320-330
[21] T. Jeremy, M. Alejandro & S. Werner, Assessment and Pruning of Hierarchical Model Based Clustering, In Proceedings of the 9th
International Conference on Knowledge Discovery and Data Mining ACM SIGKDD, 2003
[22] S. Haojun, L. Zhihui & K. Lingjun, A Document Clustering Method based on Hierarchical Algorithm with Model Clustering, 22nd
International Conference on Advanced Information Networking and Applications–Workshops, 2008
[23] F. Clark, Parallel algorithms for hierarchical clustering, Parallel Computing, vol. 21, 1995, pp. 1313-1325
[24] Q. Yun-Tao, S. Qing-Song & W. QI, CURE-NS: A Hierarchical Clustering Algorithm With New Shrinking Scheme, in the
Proceedings of the 1st International Conference on Machine Learning
and Cybernetics, 4-5 November 2002
[25] B. Young-Keun, & L. Chul-Heui, Fuzzy time series prediction using hierarchical clustering algorithms,Expert Systems with Applications, Vol. 38, Issue 4, 2011, pp. 4312-4325
[26] R. Saeidi & H. Sadegh, Hierarchical Mixture Clustering Mixture Clustering & Its Application to GMM Based Text Independent Speaker Identification, International Symposium on Telecommunications, 2008, pp. 770-773
[27] W. Fang & Q. J Zhang, An improved K-means clustering algorithm and application to combined multi-codebook/MLP neural network speech recognition, Canadian Conference on Electrical and Computer Engineering, 1995, pp. 999-1002.
[28] L. Hongyang & H. Jia, The Application of Dynamic K-means Clustering Algorithm in the Center Selection of RBF Neural Networks, 3rd International Conference on Genetic and Evolutionary
Computing, 2009
[29] C. Yiu-Ming, k-Means: A new generalized k-means clustering algorithm, Letters Pattern Recognition, vol. 24, 2003, pp. 2883–2893 [30] Q. Dingxi, A Comparative Study of the K-Means Algorithm &
Thenormal Mixture Model for Clustering: Bivariate Homoscedastic Case, Journal of Statistical Planning and Inference, vol. 140, 2010, pp. 1701–1711
[31] U. Naounori & N. Ryohei, Split & Merge EM Algorithm For Improving Gaussian Mixture Density Estimates, Journal of VLSI Signal Processing, vol. 26, 2000, pp. 133–140
[32] S. Ananth & R.R. Venkata, Parameter Tying and Gaussian Clustering for Faster, Better & Smaller Speech Recognition, EUROSPEECH, 1999
[33] Y. Zhiwen & W. Hau-San, Fast Gaussian Mixture Clustering For Skin Detection, IEEE International Conference on Image Processing, 2006, pp. 2997 - 3000
[34] J.E. Rougui, M. Rziza & D. Aboutajdine, Fast Incremental Clustering of Gaussian Mixture Speaker Models for Scaling up Retrieval in On-Line Broadcast, International Conference on Acoustics, Speech and Signal Processing, 2006
[35] K. Jeyhan, An Unsupervised Gaussian Cluster Formation Technique as a Bussgang Blind Deconvolution Algorithm, IEEE International
Symposium on Circuits and Systems, 1993, pp.719 – 722
[36] H.S. Rahila, M. Raghuwanshi & N.J Anil, Genetic Algorithm Based Clustering: A Survey, 1st International Conference on Emerging
Trends in Engineering and Technology, 2008
[37] R.H. Eduardo & F. F. Nelson, Using a Clustering Genetic Algorithm for Rule Extraction from Artificial Neural Networks, IEEE Symposium on Combinations of Evolutionary Computation and Neural Networks, 2000, pp. 199 - 206
[38] M. Ujjwal, Genetic algorithm-based clustering technique, Pattern Recognition, vol. 33, 2000
[39] G. Gautam & B. Chaudhuri, A novel genetic algorithm for automatic clustering, Pattern Recognition, vol. 25, 2004, pp. 173–187
[40] B. Stefan, K. Hans-Peter, & P. Martin, Multi-Step Density-Based Clustering, Knowledge and Information Systems (KAIS), vol.9, No. 3, 2006
[41] B. Stefan, K. Hans-Peter & P. Martin, Parallel Density-Based Clustering of Complex Objects, W.K. Ng et al. (eds.): PAKDD 2006, pp.179-188
[42] B. Christian, K. Karin, K. Hans-Peter & K. Peer, Density Connected Clustering with Local Subspace Preferences, In Proc. 4th IEEE Int.
Conf. on Data Mining (ICDM 04), Brighton UK, 2004.
[43] G. Bhupesh, ART Neural Network Based Clustering Method Produces Best Quality Clusters of Fingerprints in Comparison to Self Organizing Map & K-Means Clustering Algorithms, International
Conference on Innovations in Information Technology, 2008, pp.282
– 286
[44] W.L. Tung & C. Quek, Falcon: Neural Fuzzy Control & Decision Systems Using FKP and PFKP Clustering Algorithms, Transactions On Systems, Man & Cybernetics-Part B: Cybernetics, vol. 34, No. 1, 2004
[45] A. Ioannis, W. Phil, A. Trinder, NOCEA: A rule-based evolutionary algorithm for efficient and effective clustering of massive high-dimensional databases, Applied Soft Computing, vol. 7, 2007, pp. 668–710