Energy. Climate, Environment
and Water -
Issues and
Opportunities for
Irrigation and Drainage
San Luis Obispo, California
July 9-12, 2002
Sponsored by
U.S. Committee on Irrigation and Drainage Environmental & Water Resources Institute, ASCE
Co-Sponsored by
Irrigation Training and Research Center California Polytechnic State University
Edited by Charles M. Burt
California Polytechnic State University Susan S. Anderson
U.S. Committee on Irrigation and Drainage
Published by
U.S. Committee on Irrigation and Drainage 1616 Seventeenth Street, Suite 483
Denver, CO 80202 Telephone: 303-628-5430
Fax: 303-628-5431 E-mail: stephens@uscid.org
Internet: www.uscid.org
Copyright © 2002, U.s. Committee on Irrigation and Drainage Printed in the United States of America
Library of Congress Number 2002108153
USCID
The Mission of the United States Committee on Irrigation and Drainage is to foster sustainable, socially acceptable and environmentally responsible irrigation, drainage and flood control systems and practices for providing food, clothing and shelter ta the people of the United States and the World.
USCID is a nonprofit professional society whose members share an interest in the planning, design, construction, operation and maintenance of irrigation, drainage and flood control works; agricultural economics; water law; and environmental and social issues affecting irrigated agriculture.
USCID is the United States member of the International Commission on Irrigation and Drainage (ICID), an association of more than 70 countries. Founded in 1950, ICID is a non-governmental organization dedicated to the sound and responsible management of water resources. Its central purpose is to promote the development and application of the sciences and techniques of irrigation, drainage, flood control and river channel stabilization.
USCID publishes the USCID Newsletter, proceedings ofUSCID meetings and special reports; organizes and sponsors periodic technical meetings and Conferences; and distributes ICID publications.
Since 1986, USCID has organized a number of regional, national and international mectings throughout the U.S. These meetings address contemporary issues affecting irrigated agriCUlture, offering a multi-disciplinary evaluation of problems and solutions. For additional information about USCID, its meetings, publications and membership, contact
U.S. Committee on Irrigation and Drainage 1616 Seventeenth Street, Suite 483 Denver, CO 80202 U.s.A. EWRI of ASCE Telephone: 303-628-5430 Fax: 303-628-5431 E-mail: stephens@Uscid.org Internet www.uscid.org
The Environmental and Water Resources Institute (EWRI) of the American Society of Civil Engineers (ASCE) is recognized as a leader for the integration of technical expertise and public policy into the planning, design, construction, and operation of environmentally sound and sustainable infrastructure impacting air, land, and water resources.
The work of the EWRI addrcsses the technical, educational, and professional needs of its members as it promotes public health and safety as well as the sustainable use, conservation, and protection of natural resources.
For more information, contact
EWRI of the American Society of Civil Engineers 180 I Alexander Bell Drive
Reston, VA 20191-4400 U.S.A. 800-548-2723 703-295-6000 http://www.asce.org http://www.ewrinstitute.org
Climate, Environment and Water - Issues and Opportunities for Irrigation and Drainage was sponsored by the U.S. Committee on Irrigation and Drainage and the Environmental & Water Resources Institute of the American Society of Civil Engineers. The Irrigation Training and Research Center, California Polytechnic State University, co-sponsored the Conference.
Irrigators are facing new challenges as competition for water supplies, coupled with significant increases in energy costs and environmental considerations, threaten the economic viability of irrigation. Climate changes, whether natural or a result of human activity, are providing additional concerns. The Conference provided a forum to discuss and evaluate these issues, with a focus on the technology being applied to meet the challenges.
Papers included in the Proceedings were accepted in response to a call for papers and were peer-reviewed prior to preparation of the final papers by the authors. The authors are professionals from academia; federal, state and local government agencies; water districts and the private sector.
The U.S. Committee on Irrigation and Drainage, the Environmental & Water Resources Institute and the Conference officers express gratitude to the authors, session moderators and participants for their contributions. The Office of International Affairs, Bureau of Reclamation, sponsored the Conference Proceedings and this support is acknowledged with appreciation.
v
Charles M. Burt Conference Chairman San Luis Obispo, California
Contents
Plenary Technical Presentations
Energy Efficiency as a Non-Point Source Problem ... 1 Peter Canessa
Suggested Research on the Effect of Climate Change on California
Water Resources ... 11 Maurice Roos
Drainage
A Conceptual Salt Budget for Characteristic Water Districts in the
Western San Joaquin VaHey, California ... 23 Tracy Brumbaugh, Clinton Williams, Manucher Alemi and
Nigel Quinn
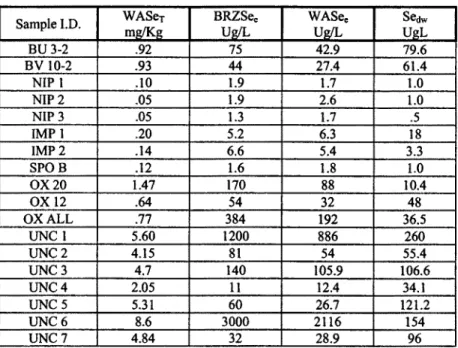
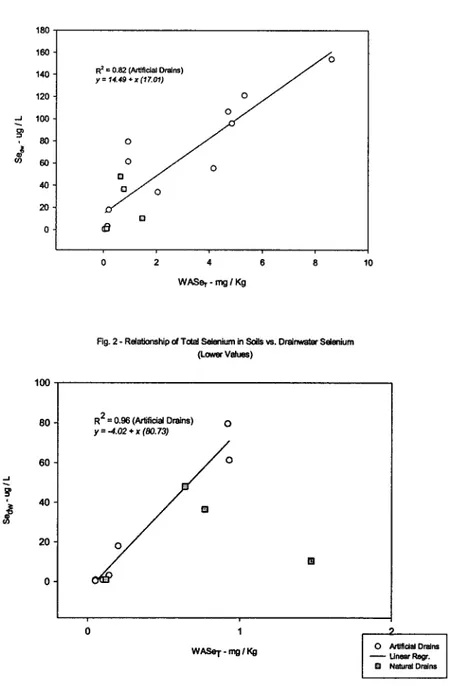
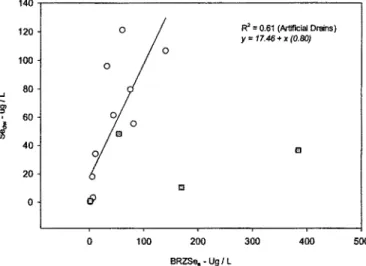
Relationship of Selenium in Drainage Water to the Selenium Content of Irrigated Soils ... 35
Joe Brummer, Juli Fahy and Sam Schaefer
A Decision Support System for Field Drainage Management ... 49 Luis A. Garcia, Daniel Gillham, David Patterson and Blair Hanna Strategies for Regional-Scale Recovery of a Salinity-Threatened Irrigated River Valley ... 59
J. Philip Burkhalter, Timothy K. Gates and John W. Labadie Real-Time Water Quality Modeling and Management in the San
Joaquin River ... 73 Nigel W. T. Quinn and Michael C. S. Eacock
Remediating Irrigation Drainage Problems at Stewart Lake ... 87 Delbert M. Smith
Applied Technologies
Breaking the Technology Barriers Imposed by Cast-In-Place Concrete Pipe in Irrigation Districts - Case Study of South San Joaquin
Irrigation District ... 95 Charles M. Burt, Michael B. Gilton, Kevin Johansen and
Keith Crowe
Partnerships in Applying New and Innovative Technology ... 109 Paul G. Elser and Mark T. Barnett
Modernization of Water Measurement Systems in the Turlock Irrigation District ... 119
Brent Harrison and Mike Kavarian
Victor M. Ruiz
c.,
Arturo Moreno, Alberto Rodriguez, Ofelia Begovich, Juan C. Zapien and Rafael BlancoCase Study: Installation of Canal Control Structures on the
Government Highline Canal ... 153 Ram Dhan Khalsa, Stuart Styles, Charles Burt, Bob Norman
Climate and Environment
Evapotranspiration from a Satellite-Based Surface Energy Balance
for the Snake Plain Aquifer in Idaho ... 167 Richard G. Allen, Anthony Morse, Masahiro Tasumi, Ricardo
Trezza, Wim Bastiaanssen, James L. Wright and William Kramber Spatial and Temporal Variability in Reference Evapotranspiration in
Oklahoma ... 179 Daniel Itenfisu and Ronald L. Elliott
Impacts of Population Growth and Climate Change on California's
Future Water Supplies ... 191 Marion W. Jenkins, Jay R. Lund and Richard E. Howitt
Nature-Based Tourism - Economic Opportunities on a Federal Water
Project, A Case Study ... 203 Warren L. Jamison, Maria Effertz Hanson and Richard McCabe Reclaimed Water - A New Irrigation Source for Citrus Irrigation in Florida ... 213
Larry R. Parsons, T. Adair Wheaton and William S. Castle Application of Automation Technology for Ensuring Stream Flows for Endangered Species in the Lemhi River ... 221
Jeff Peterson and Brian Sauer
Simulating Pesticide Leaching with GLEAMS ... 233 W. F. Ritter and R. W. Scarborough
Water Quality of Surface Irrigation Returns in Southern Idaho ... 243 Clarence W. Robison, Richard G. Allen and Richard Merkle
Impact of Farmer-Managed Maintenance of Secondary Canals on
Water Distribution Equity: A Case Study from Sindh, Pakistan ... 253 Bakhshal Lashari and D. Hammond Murray-Rust
Management of Salts in Clay Soils ... 265 Ian C. Tod, Khaled M. Bali and Mark E. Grismer
Pesticide Contamination of Groundwater on a Coastal Plain Soil ... 275 W. F. Ritter and A. E. M. Chirnside
Applied Technologies and Evapotranspiration
Modernizing Irrigation Facilities at Sutter Mutual Water Company:
A Case Study ... 283 Frederick F. Schantz, Stuart W. Styles, Beau J. Freeman, Charles M. Burt and Douglas Stevens
Case Study: Patterson Irrigation District's Use of SCADA for Total
Water & Energy Management. ... 299 John Sweigard, Dick Hearth and Mark Crossett
www-Based Monitoring and Control for Over-Stressed River Basins .... 311 Roger D. Hansen, Bret Berger and Arlen Hilton
Evapotranspiration of Full-, Deficit-Irrigated and Dryland Cotton on the Northern Texas High Plains ... 321
T. A. Howell, S. R. Evett, J. A. Tolk and A. D. Schneider
A Simulation Model for Evapotranspiration of Applied Water ... 341 Morteza N. Orang, J. Scott Matyac, Richard L. Snyder, Shu Geng and Sara Sarreshteh
Evapotranspiration and Irrigation Water Requirements for Jordan's
National Water Master Plan: GIS-Based ET Calculations ... 353 Sudan Taka. Richard G. Allen, Klaus Jacobi and Edouard Cancer
Hydraulics and Technology
Routing Demand Changes with Volume Compensation: An Update ... 367 Eduardo Bautista, Albert J. Clemmens and Theodor S. Strelkofj Improving the Reliability of Canal de Provence Hydraulic
Measurements by Data Reconciliation ... 377 Jean-Luc Deltour, Eric Canivet, Franck Sanfilippo and
Jacques Sau
Preliminary Results for Downstream Water-Level Feedback Control
of Branching Canal Networks ... 387 Brian T. Wah lin and Albert J. Clemmens
New Calibration Method for Submerged Radial Gates ... 399 A. J. Clemmens
Advances in PLC-Based Canal Automation ... 409 Charles M. Burt and Xianshu Piao
On Tracking Sediment Particle Sizes in Furrow-Irrigation Induced
Erosion for Modeling Phosphorus Transport ... 423 T. S. Strelkoff, R. Fernimdez-Gomez, L. Mateos, J. V. Giraldez
Designing and Implementing a Large Scale Grant Program for
Energy Efficiency ... 445 Peter Canessa
Load Shifting and Energy Efficiency Opportunities Available to
California Water Districts ... 457 Hilary Armstrong Reinhard and Michael J. Day
Energy Use for Microirrigation ... 465 Tom Trout and Jim Gartung
Merriam Poster Session
Sensitivity of Surface Irrigation to Infiltration Parameters:
Implications for Management ... 475 Eduardo Bautista, Theodor S. Strelkoff and Albert J. Clemmens A Leading-Edge Irrigation Demand Model for Assessing Irrigation
Expansion with Finite Water Supplies ... 487 Wally R. Chinn, Arva J. Traynor, Don W. Roth and Bonnie C.
Hofer
Canal Automation System Demonstration at MSIDD ... 497 A. J. Clem mens, R. J. Strand L. Feuer and B. T. Wahlin
Subsurface Drip Irrigation Applications in the Humid Region:
Status of the Task Committee Activities ... 507 Michael D. Dukes, Daniel L. Thomas and Members of the
SDI Task Committee
Simplification of Planning to Meet Future Demands for Food and
Water ... 513 George H. Hargreaves and Donald T. Jensen
Impact of Scavenger Wells on Crops and Groundwater Table ... 525 Rasheed Ahmed Kumbhar and Abdul Khalique Allsari
Consumptive Use Program (CUP) Model ... 535 Morteza N. Orang, Richard L. Snyder and J. Scott Matyac
Glenn-Colusa Irrigation District Flow Monitoring Program ... 543 Dennis Perkins, Stuart W. Styles and Marcus Y. Yasutake
Selenium Loading in the Lower Gunnison River Basin ... 553 Terence L. Stroh and Delbert Smith
Automation in Drip Irrigation System for Cotton Growing on Large
Scale - A Case Study ... 561
On-Farm Increased Production, Income and Water Use Efficiency
through Micro-Irrigation in India ... 571 S. M. Taley and R. S. Pat ode
Sprinkler Irrigation in Humid Areas with the EASY Pan ... 581 Daniel L. Thomas, Kerry A. Harrison, James E. Hook and
Terrell W. Whitley
Use of Hydrological Models inWater Design Project in Turkmenistan ... 591 Alexander A. Vecher. Venera V. Arutyunova and Stanislav
E. Agallov
Tools for Design, Calibration, Construction and Use of
Long-Throated Flumes and Broad-Crested Weirs ... 601 Tony L. Wahl, Albert J. Clemmens, Marinus G. Bos and John A. Replogle
Policies to Reduce Environmental Degradation and Enhance Irrigation and Drainage in the Indus Basin of Pakistan ... 611
ABSTRACT
This paper argues that improving energy efficiency in agriculture is a long-term, non-point source type of problem. "Fixing" non-point source problems generally involves changing the behavior of resource managers. These types of problems are generally addressed by programs involving three components: 1) problem awareness, 2) solution awareness, and 3) targeted resources. The concept of market transformation as applied to energy efficiency is discussed in relation to non-point source programs. Market transformation also involves changing the way end-users (managers) think and act, but also recognizes supply-side issues in terms of changing the services and hardware being offered to the end-user.
"A problem well-stated is a problem half-solved" INTRODUCTION
Business, government agency, and political managers are often charged with correcting problems in society. Generally, resources (time and money) to address these problems are limited. It is essential that problems be correctly characterized as to type so that the correct form (as opposed to the details) of response is utilized.
Two obvious examples of problem type are point source versus non-point source. The defining feature ofthe point source problem is that it can be "fixed" by addressing relatively few and/or well-defined situations. In contrast, non-point source problems require a response to a large number of (possibly ill-defined) situations. Point source problems may take a relatively short amount oftime to correct while non-point source problems usually require a long-term effort. The argument of this paper is that energy efficiency in irrigated agriculture is a long term, non-point source problem (NPS). Characterizing energy efficiency as this type of problem leads to an efficient strategy for achieving solutions.
CHARACTERISTICS OF NON-POINT SOURCE PROBLEMS NPS have several defining characteristics:
I Program Manager, Center for Irrigation Technology, California State
University, Fresno, 5370 North Chestnut Avenue, Fresno, CA 93740 1
2 USCIDIEWRI Conference
• The source of the problem is diffuse. That is, there are multiple sources of
the problem.
• Each individual source may be operating "legally". That is, the activity is legal and is also being conducted to prevailing community and business standards. Importantly, the activity may be (or may have been) encouraged by society (e.g. use of fertilizer to increase crop yields).
• Few, ifany, of the individual sources on their own are causing a problem
as a legal or practical matter.
• The problem is caused by the cumulative effect of the diffuse sources.
• Because NPS are generally slow to appear, the activities causing the
problem are many times "entrenched". That is, they are the result of long-term investments both in money to purchase and install the activity, but also in terms of management education in how to actually conduct the activity. There may be a cultural environment built up around the activity. The characteristics ofNPS add considerable political, economic, and engineering complexity to solving these types of problems.
Does energy efficiency (or lack thereot) in agriculture fit this description? Consider these points concerning energy used for pumping irrigation water:
• There were over 86,000 agricultural accounts in 1997 in just one of the
three major California utilities. About 80,000 of these were pump users. " Although there may be restrictions of one sort or another placed on the use
of water in agriculture, there are no laws governing the use of energy (except for those governing the efficiency of electrical motors or laws governing fuel efficiency and emissions of internal combustion engines).
• Pumping plants are a major investment and may be in operation for 40
years or more.
• No one pumping plant (not even a thousand pumping plants) on its own is
causing a problem (i.e. lack of electricity in California)
• Pumping water for irrigation can obviously be considered a benefit to
society considering improved yields and is encouraged where applicable.
• The problem is the cumulative effect of all pumping plants. Electricity
use for water pumping for one California utility in 1997 was in the range on billion kWh/year, representing 81 % of all energy use in the
agricultural sector for that utility. Current data from one large-scale energy efficiency program indicates the following average pumping plant efficiencies for various sizes of electric-powered water pumps (all types). Table 1. Average Overall Pumping Plant Efficiency in California from Pump Tests Performed During the Agricultural Peak Load Reduction Program - June I,
2001 - February 5, 2002 (all pump types and uses represented)
Horsepower Number of Tests Average Overall
Range Pumping Plant
Efficiency
5 - 20 386 43
21 - 50 701 53
51 - 200 926 59
Improving the efficiency of pumping plants by three percentage points could save in the range of 90 million kWhlyear for that utility alone. More importantly, even ignoring any desirable improvement in pumping plant efficiency, moving a significant percentage of the agricultural pumping demand away from the peak periods of overall statewide demand might forestall the need to construct power plants or avoid blackouts. • Obviously production agriculture has created an economic, political, and
cultural environment in California.
It seems clear that improving energy efficiency in agriculture can be characterized as a non-point source problem.
IMPROVE MANAGEMENT OR HARDWARE?
Given that energy is used by hardware, another aspect of the problem statement is whether to address the hardware itself or the management of hardware. The question can be framed analytically for production agriculture by equations [1], [2], and [3]. They represent a simplified method for estimating energy use for an agricultural pumping plant used for irrigation.
kWhlyr= kWhiAF
*
AF/yr [1]where:
kWhlyr = kilo Watt-hours of electricity used annually
kWhiAF = kiloWatt-hours required to pump an acre-foot of water through the pumping plant
4 USCIDIEWRI Conference
kWhiAF = 1.0241
*
TDH lOPE [2]where:
kWhiAF = kiloWatt-hours required to pump an acre-foot of water through the pumping plant
TDH = total dynamic head developed by the pumping plant in feet OPE = overall pumping plant efficiency as a decimal (0 - 1.0) 1.0241 is the conversion constant for water at standard conditions
AF/yr = CL
+
(Ac*
(ETc - PPTeft) I «1 - LR)*
IE» [3]where:
AF/yr = acre-feet pumped annually for irrigation of a crop CL = conveyance losses in the irrigation system in acre-feet Ac = acres irrigated
ETc = annual net crop water use as acre-feet/acre
PPTeff= annual effective rainfall (rainfall used for crop ET) LR = required leaching ratio as a decimal (0 - 1.0)
IE = irrigation efficiency as a decimal (0 - 1.0)
Using a superficial analysis of equation [2] one can state that reducing energy use
IS partially a problem of hardware. That is, equation [2] implies that overall energy use is governed both by the design of the system (which leads to the required TDH) and by the design of the pumping plant (which leads to the OPE). In addition, by equation [3] it is seen that management of the overall activity, as represented by IE, is equally as responsible for overall energy use. As IE decreases (i.e. poor management), AF/yr increases and thus, the more energy required. Note also that OPE in equation [2] is partially governed by maintenance of the pumping plant. Thus, poor management can lower OPE, which leads to higher overall energy use.
However, it is also true that the design of the pumping plant affects OPE. Management is involved in the design (i.e. choice of hardware) ofa system. Thus, some might argue that the distinction between management and hardware is somewhat artificial.
However, where the distinction is not artificial is when the decision is made to address what type of hardware is available to the manager. This is the difference between addressing supply-side issues (e.g. available hardware, design expertise)
versus demand-side issues (e.g. choice, use, and maintenance of hardware). Examples of this are the implementation of Corporate Average Fuel Efficiency standards that the automotive industry must meet, or minimum electric motor efficiencies for motor manufacturers set in the Energy Policy Act of 1992.
PROGRAM FORM TO ADDRESS NPS
Having established that energy efficiency is a non-point source problem, the question is how should this type of problem be addressed? As just pointed out, NPS are substantially the result of management actions, either design,
maintenance, or operational. Thus, if a non-point source problem is to be fixed, there must be a change in management action - people have to change the way they think and act.
Three things have to happen to make someone change in the context of solving some problem of behavior:
I. He/she must see that there is a problem and that that problem is their responsibility.
2. He/she must see that there are solutions available for the problem. 3. He/she must have resources to implement the solution.
Thus, programs that address non-point problems at the end-user level generally have three components. These three components exist at both the program design and the program implementation level. They are:
I. Problem awareness - At the implementation level the actors need to see that there is a genuine problem and that they are (wholly or partially) responsible for solving that problem. "Seeing" implies that the actor not only takes responsibility but also has tools by which specific problems can be identified. At the program design level it is essential managers a) identify the real (or priority) problem(s), b) implement sufficient education and public outreach, and c) ensure that engineering/analysis tools are available for individual problem identification.
2. Solution awareness - At the implementation level the actors need to see that there are solutions to the problem(s)- that is, something can be done. At the program design level it is essential that managers identify viable solutions ("targeted technologies"). Viability means more than just the ability to improve energy efficiency. It must be economical, reliable, practical, widely adaptable in the field, and understandable.
6 USCID/EWRI Conference
3. Resources - At the implementation level the actors need the time, money, and expertise to a) identify their problem(s), b) identify the most applicable solution(s), and c) install the solution(s). It is essential that program designers recognize when aide in the form of engineering services, low interest loans, and outright grants are required. To paraphrase the above discussion: if a manager doesn't see a problem, or doesn't believe it is his/her problem, nothing will change - we need problem awareness. If the manager sees the problem but doesn't see that there is anything that can be done, nothing will change - we need solution awareness. However, even if the manager sees the problem and has a solution, nothing will be done unless resources are available to implement the solution.
As a practical example of how the above three components interact consider low overall pumping plant efficiency for a pump in place. The first concern is making the pump operator aware of the situation. Thus, the program will advertise the availability and encourage the operator to have the pumping plant tested for efficiency. The pump test identifies the current overall pumping plant efficiency. Thus, the operator is given objective data with which to make a decision. The program should also develop awareness of solutions. In this situation most every pump operator will know that a pump can be repaired. However, it is possible that part of the problem is excessive drawdown in a well. The owner may not be aware of actions that reduce encrustation or otherwise improve specific yields.
Economics of the solution are also important. Equations [IJ, [2J, and [3] can be packaged in different forms so that operators can develop valid benefit/cost ratios for pump repairs. Note that a necessary part of the package is information concerning achievable levels of efficiency.
Finally, the program may have to provide resources. These may be in the form of direct cash rebates, either to defer some of the cost of the pump test or a
subsequent pump repair. Time can also be considered as a provided resource as the tools developed for economic analyses, including developed data, save the operator time in making a decision.
Programs that address NPS may also include development of new solutions if current solutions are not satisfactory. This could include development of new management techniques (e.g. improved irrigation event management leading to increased irrigation efficiency) or research to develop new hardware.
"MARKET TRANSFORMATION" AS A SOLUTION TO THE ENERGY EFFICIENCY PROBLEM
"Market transformation" has been a popular term with the California Public Utilities Commission (CPUC) in the recent past while California was moving towards deregulation. CPUC, in light of the advent of a "fully competitive" market, was trying to move away from energy efficiency programs that were mainly "buying the resource". That is, they wanted to reduce the use of
programs that primarily were designed to provide cash incentives to install energy efficient equipment. In terms of the preceeding discussion, it was an indication that existing programs provided resources, but possibly were deficient in improving problem and solution awareness.
The major problems of incentive-based programs were seen to be:
1. Substantial amount of "free riders". That is, people were participating in the program that would have installed the measure without the incentive. Thus, the cost ofthe energy efficiency program was artificially inflated. 2. Questions of persistence- that is, would energy-efficiency behavior persist
in the absence ofthe incentive? For example, if an incentive grant for pump repairs is discontinued, will the rate of pump repairs stay steady or decline?
Market transformation programs would be specifically intended to change the way people think and act. Thus, after market transformation, people would buy and act in an energy efficient manner without being paid to do so. The goals of moving towards market transformation programs were:
1. More efficient programs in terms of impact for dollars spent.
2. Creation oflasting energy efficient behavior- that is, increased persistence. In current terminology, market transformation activities include identifying barriers to technology adoption and implementing programs that will serve to break down those barriers. That is, if there is technology available that will improve energy efficiency and it is not being adopted (or at least not being adopted without some form of "bribe"), what can be done to increase adoption? Further, can this adoptive behavior be made to persist without the program? Commonly identified market barriers include:
1. Information and search costs - the costs of searching out new technologies and learning enough about them to make an informed decision.
8 USCIDIEWRI Conference
2. Asymmetric information - this barrier surfaces when information concerning a technology cannot be verified by disinterested third parties. New technology is most often marketed by those wishing to profit from it. The marketers may be the only ones with information and test data regarding the product. The end-user may not trust this information. 3. Performance uncertainty - can the true benefits and costs be identified? 4. Hidden costs - this is different than performance uncertainty in that
performance uncertainty relates to the known factors while hidden costs relate to the unknown, and thus unevaluated, factors.
5. Unstable investment environment - this may involve overall business economics, overall energy costs, or the relation between costs of alternative energy sources.
Another way to state the problems identified in points 3 through 5 above is "risk". There is a risk to changing the hardware and/or management of an activity. A manager must not only determine the benefit/cost ratio of known variables but also try to evaluate the unknown.
Also, note the repeated theme of the need for complete and valid information in points I - 4 above. Thus, desirable characteristics of market transformation programs would seem to be similar to those programs designed to address standard non-point source problem. In fact, programs that address non-point source problems are very much "market transformation" programs. Both are trying to change the way people think and act.
However, the concept of market transformation, in the context of energy efficiency, extends and clarifies some of the desirable aspects ofNPS program design and implementation. The market transformation concept specifically identifies both supply side and demand side actors. The supply side of the equation includes both those designing and manufacturing the individual
components of a solution as well as those who package and sell the components to the end-user (the demand side). Thus, within the basic components of problem awareness, solution awareness, and appropriate resources, the following factors must also be addressed:
• Educational programs concerning the problem and the solution need to involve all "actors" including end-users, consultants, suppliers, and lending institutions. At the very least this will promote efficiency in program implementation as suppliers, consultants, and lending institutions become involved in encouraging energy conservation. To the extent that these actors become involved and existing communication links utilized, the efforts (and
the costs) of the Program Manager can be reduced. It should be obvious that different methodsllevels of education are appropriate for different audiences. • The individual program components should not become a necessary part of
the adoption process. The intent is to transform the market so that it acts on its own. Thus, if the intent is for supply side actors (i.e. a pump repair company) to help sustain the solution adoption (i.e. provide pump tests to identify low efficiency pumps) after the program stops, the supply side actor (who acts independently of the Program) must be part of the program design. For example, while the end-user should see (and use) the pump test as a source of information, the supply side should see (and offer) the pump test as a (continuing) source of revenue- the pump test can lead to a pump repair. • There must be a monitoring component. That is, there must be some measure
of success of the Program and some control function to indicate when and where changes have to be made in the Program. Also, there should be some level of the monitored measure that indicates Program objectives have been reached. If the goal of a market transformation program is the market acting on its own, then it is logical that sooner or later the Program can be (should be) discontinued.
CONCLUSION
In summary, it is argued that energy efficiency in agriculture is a long-term, non-point source type of problem. "Fixing" non-non-point source problems generally involves changing the behavior of resource managers. These types of problems are generally addressed by programs involving three components: 1) problem awareness, 2) solution awareness, and 3) targeted resources.
Market transformation as a concept is directly related to non-point source programs. Market transformation also involves changing the way end-users think and act, just as the traditional NPS program. However, the concept explicitly recognizes that supply side actors must be involved in terms of changing the services and hardware being offered to the end-user. This is especially true if the long term objective is the market to act on its own to ensure high-energy efficiency.
Involving the supply side also takes advantage of existing communication links and hopefully can lead to lower program costs.
SUGGESTED RESEARCH ON THE EFFECT OF CLIMATE CHANGE ON CALIFORNIA WATER RESOURCES
Maurice ROOSI ABSTRACT
Quite significant changes in climate are being predicted for the latter part of this century due to global warming. The changes would be the result of increases in greenhouse gases from human activities, such as carbon dioxide, methane, and other trace gases. These potential changes are expected to affect many of our water resources systems. Some of the more important changes would be temperature increases which would raise temperate zone snow levels and change the pattern of runoff from mountain watersheds, thereby affecting reservoir operation. Other consequences would be sea level rise wQich could adversely affect the Sacramento San Joaquin River Delta, source of major water exports for the State; possibly larger floods and more extreme precipitation events; and changes in the water requirements of crops.
By and large, reservoirs and water delivery systems and operating rules have been developed from historical hydrology on the assumption that the past is a good guide to the future. With global warming, that assumption may not be valid. This paper will briefly look at the major factors affecting water resources systems and go on to suggest eleven priority items of research. The emphasis will be on items important in California and other western states.
In view of these forecasts of a significant change in future climate, with the author's knowledge of the existing water resources system in California, an analysis of potential effects and a list of higher priority research items has been developed. In summary, the list is as foJlows, and will be explained in more detail subsequently in the paper:
--Monitoring ofhydrologicaJly important variables
--Test operation of the Central VaJley Project and State Water Project system with modified runoff
--Modeling of future precipitation
--Update depth-duration-frequency rainfall data --Evaluate Golden Gate Tide Gage datum
--Catalog sea level trends along the coast, in San Francisco Bay and the Delta
--Check for recent changes in evapotranspiration
--Estimate future changes in evapotranspiration and crop water use.
1 Chief Hydrologist (part time), California Department of Water Resources, P. O. Box 219000, Sacramento, California 95821-9000.
--Evaluate effect on major multipurpose flood control reservoirs --Water temperature modeling in major reservoir/river systems --Effect of climate change on regions adjoining California, such as the
Colorado River and the Pacific Northwest
POSSIBLE CHANGES AFFECTING WATER RESOURCES SYSTEMS Most of the forecasted climate changes by year 2100, the end of the century, due to the increase in greenhouse gases have been developed by the
Intergovernmental Panel on Climate Change (IPCC). The IPCC was jointly established in 1988 by the World Meteorological Organization and the United Nations Environment Programme to study climate change. The IPCC has issued several reports since 1990 outlining possible global warming and the effects as a result of increased amounts of carbon dioxide, methane, and other trace gases originating from human activities.
A good assessment of the state of research on the potential consequences of climate change on water resources in the United States, including what is known and what is not known, is the report of the National Water Assessment Group for the U. S. Global Change Research Program (Gleick and Adams, 2000).
The most recent IPCC Working Group I Summary Report, in its third assessment (IPCC, 2001), projects a 1990 to 2100 average surface temperature increase of around 3 degrees C, with a range of 1.4 to 5.8 degrees. The different scenarios cover a wide range of assumptions about the rate of future increases in greenhouse gases and the amount of temperature forcing in the climate system. The increase in global temperature during the 20th century was estimated to be about 0.6 degrees C. much of which occurred by 1940, and a recent significant increase after 1980 which is believed to be primarily of human origin. Because of warmer temperatures, some increase in global evaporation and therefore
precipitation is projected for the 2151 century, more likely at higher latitudes. For hydrology and water resources, precipitation is the most important variable; rainfall changes in specific California regions cannot be well defined by the current general circulation climate models of the atmosphere.
Sea level (IPCC,2001) is projected to rise around 0.5 meter (1.6 feet) by 2100, with a range of 0.1 to 0.9 meters (0.3 to 2.9 feet). The rate during the 20th century appears to have been around 0.2 meters (0.7 feet) with a range of 0.1 to 0.25 meters (0.3 to 0.8 feet). The 0.2 meter figure is consistent the historical trend at the Golden Gate tide station, although it is possible that tectonic movement, or settlement, has influenced the stages there.
There is a general expectation that a warmer climate would lead to more intense precipitation events, thereby causing somewhat bigger floods and more intense convective storms, thereby affecting the rainfall statistics used for storm drainage
Climate Change 13
design. The IPCC report rates prediction confidence in more intense precipitation events as "very likely, over many areas".
The increase in carbon dioxide, from the current 370 ppm to perhaps 600 or 700 ppm, is expected to be beneficial to plant growth on many food crops, provided the water supply is adequate. To some extent, higher carbon dioxide
concentrations in the air could partly offset the higher water use (evapotranspiration) resulting from warmer temperatures.
All of these projected changes, as well as some not yet identified, are likely to affect the hydrologic cycle and the water resources of California.
WATER SUPPLY RELATED RESEARCH
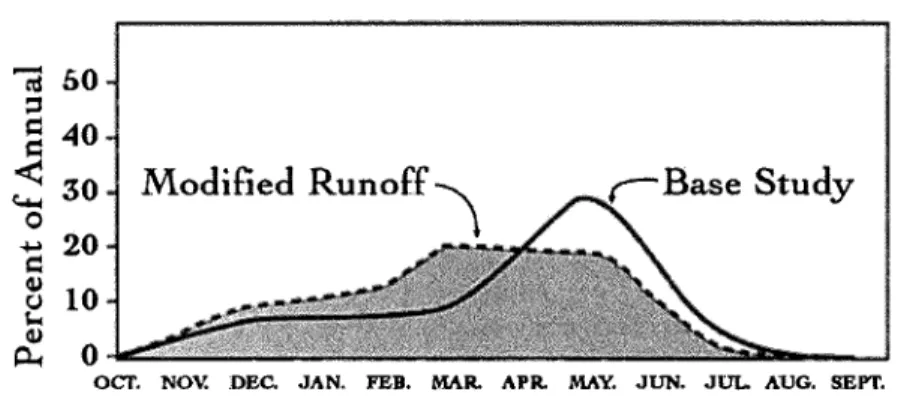
Probably the most significant change, which is judged fairly certain in the next 100 years, is a change in temperate zone mountain runoff patterns. Even if precipitation remains the same, the rise in temperatures means less snow, less snow covered area, and winter rain to higher elevations. The higher snow levels during storms, about 450 meters (1500 feet) under the 3 degree median projection, would produce more winter runoff. Less spring snowmelt would make it more difficult to refill winter reservoir flood control space during late spring and early summer of many years, thus reducing the amount of water deliverable during the dry season. Lower early summer reservoir levels also would adversely affect lake recreation and hydroelectric power production, with possible late season
temperature problems for downstream fisheries.
.... 20
d~
10
I-c Q) ~0
Modified Runoff ' \
OCT. NOV. DEC. JAN. FEB. MAR. APR. MAY. JUN. JUL AUG. SEP1'.
Figure l. Comparison of historical and modified runoff from a mid-Sierra snow runoff watershed, assuming 3 degrees C warming
It is possible, if precipitation increases and the mountains are high enough, for the volume of April through July snowmelt to increase. In California, this could
happen in the higher elevation southern Sierra, where about 70 percent of the historical April I snow zone area would remain with a 450 meter (1500 feet) rise. In the northern Sierra, however, the same rise in snow levels would reduce estimated snow covered area by over 70 percent, so a reduction in spring snowmelt is virtually certain. In fact, there has been such a trend during the last 50 years.
Monitoring of Hydrologically Important Variables
The first research need is good hydrometeorologic monitoring. Regular, consistent and sustained measurements of hydrologically important variables are essential to track what is happening and to verify model predictions. This means continuing measurements of variables such as precipitation and other climate data, snowpack, streamflow, and ocean and Delta tide levels. Emphasis should be in the locations where significant change is expected, for example the mountain snow zone. The National Weather Service, in its reorganized Climate Services Division, is developing a climate reference network of250 high grade weather stations to be a national benchmark for long term climate monitoring. That would be a good start, but only 5 of these are likely to be located in California. Scripps Institution of Oceanography, in cooperation with the Yosemite National Park and others, has recently installed a number of new snow measurement and
meteorological instruments in the Park, with high hopes that these will be operating for the long term. But more thought should be given to several networks along gradients from east to west and north to south, and across climate zones.
Test Operation of the Central Valley Project - State Water Project System These two big water projects furnish about 30 percent of California net water demand for agricultural and urban use. The major reservoirs of these two projects are located on watersheds (Trinity, Sacramento, Feather and American) likely to see large shifts in runotfpatterns as a result of rising snow levels. At least 50 years of monthly hydrology are suggested as a minimum length for comparisons. Currently many studies are made with the 1922 - 1994 historical period of 72 years. This longer period includes simulation during the two major 6-year historical droughts, 1928-1934 and 1987-1992. The operation model of choice would be the CALSIM model jointly developed by the Department of Water Resources and the Bureau of Reclamation.
The test evaluations would logically proceed in two stages: (1) a simplified run involving approximate adjustments to major project reservoir inflows with the changes anticipated with global warming, and (2) more detailed studies involving all major facilities, including local and upstream power reservoirs. Initial studies should focus on the assumption of precipitation similar to the historical amounts, except warmer. Later studies could try some of the projected precipitation
Climate Change
scenarios derived from a new generation of atmospheric general circulation models (GCMs).
Modeling Future Precipitation
15
Future precipitation is probably the most important variable influencing water resources and water supply. It is also the most difficult to predict at the regional and watershed levels. It should be no surprise that research should continue into modeling likely future precipitation in enough detail in time and space to feed into individual watershed runoff models. We need to support the University of California and National Laboratory experts in analyzing results of newer GeM modeling by the modeling centers of the world as they apply to California and other western states, especially in simulating historical precipitation and
predicting future precipitation. And feedback from these expert researchers to the GCM modelers should be encouraged.
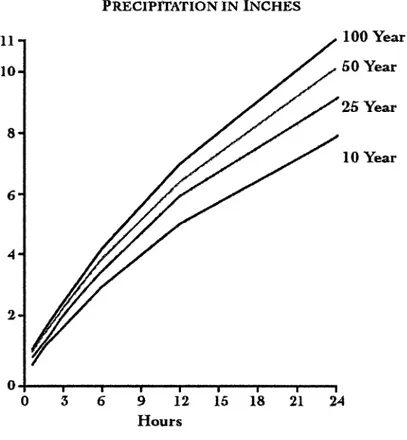
Depth-Duration-Freguency Rainfall Data
Support of the processing and dissemination of up-to-date rainfall depth-duration-frequency data is important to incorporate extreme events of recent years and as more of these extreme events are expected in future years. These data are some of the most valuable rainfall statistics, widely used by engineers and designers for storm drains, culverts, roofs and host of works. These are the curves, for example, which show that a 1 in 25 year storm can produce 2 inches (50 rnm) in 2 hours at a particular place. Continual updating will gradually incorporate expected storm intensity increases as a result of climate change so that structures built with their guidance will not be out of date with less protection than intended.
11 10 8 6 4 2
BLUE CANYON
PRECIPITATION IN INCHES100 Year
50 Year
25 Year
10 Year
o;---~--~--~----~--~--~--~--~o
6 912
15
18
2124
HoursFigure 2. Chart of depth-duration-frequency statistics for Blue Canyon SEA LEVEL RISE
California is not generally as vulnerable to sea level rise as some of the eastern and southern states, which have lower shorelines. Since California is tectonically active, it is the combined effect of geological change, rising or falling land, and global sea level rise that matters. But there are areas, such as San Francisco Bay and the Sacramento San Joaquin River Delta, which are vulnerable. Major water projects have been built to convey water from areas of plenty to the drier central and southern portions of the State. The tidewater region of the Delta is the hub of major water transfer; water quality there can be affected by salinity intrusion from the Pacific Ocean via San Francisco Bay.
Climate Change 17
Reservoirs in the north provide water storage and flood control. Water is then released downstream to meet Delta and fishery needs and to be exported by large pumps in the southwestern comer of the Delta. During low flow months additional water is released to repel ocean salinity incursion in the western Delta as a hydraulic barrier to preserve suitable fresh water quality within the estuary and for export. Much of the land within the Delta is below sea level protected by levees, many of which are on weak peat soil foundation.
Evaluate the Golden Gate Tide Gage Datum
Rising sea level is not only a concern along the coast but to the hub of
California's water transfer system in the Sacramento San Joaquin Delta. Rising ocean levels could affect water transfer across the Delta from north to south by decreasing the stability of Delta levees. The second factor is more salinity intrusion, which would gradually degrade the quality of export supplies or require more precious fresh water releases from upstream reservoirs to repel ocean salinity.
Since the Golden Gate tide gage is the key reference for so many sea level determinations (i.e., the central California coast, the Bay, and the Delta), it is essential that an accurate determination of its vertical stability be made, checking for long term vertical movement of the datum. Tools may now be available by use of highly precise space geodetic techniques, which can measure very small changes in vertical elevation. The gage has shown an apparent rising sea level trend of about 0.2 meters (0.7 feet) per century over the past 80 years, but we can't be sure if this is real or due to settlement of the pier or tectonic movements in the underlying rock. The measurements should proceed in three stages: (1) compare previous precise leveling where the Golden Gate gage can be compared to nearby benchmarks on solid rock; (2) investigate whether the GPS system can be used for a precise determination of the Golden Gate tide gage datum and its changes, if any, over time and how long a record would be needed to give confidence of a measurement which could be less than 2 mrn (.007 feet) per year; and (3) perform the measurements of actual tide gage datum over a period of time, probably years. The National Geodetic Survey does this kind of work. Catalog Sea Level Trends Along the Coast
The objective of this proposed study would be to catalog all available tide station data along the California coast, in San Francisco Bay and in the Delta. Long term data is needed, at least 20 years and preferably 50 years, to look for apparent trends in annual sea level. Presumably an average of San Francisco at the Golden Gate and San Diego can be used to represent global sea level rise. Departures from that could be due to tectonic activity or possibly some other effect such as oil and gas extraction, or perhaps consolidation of deep sediments (as in the Delta, for example). The catalog would establish a useful base to guide government and
developers in the coastal zone. The San Francisco Bay Conservation and Development Commission (1988) and the California Coastal Commission (2001) have both made some studies ofthis matter.
CHANGES IN WATER REQUIREMENTS
There are at least two factors which could change water use by vegetation. As a general rule, warmer temperatures mean more evapotranspiration. But higher carbon dioxide levels tend to reduce water consumption, at least in laboratory tests. Most observers expect the net change to be somewhat higher water requirements but not as high as would otherwise be expected from temperature change considerations.
Recent Changes in Evapotranspiration
Since carbon dioxide concentrations have increased about 17 percent over the past 40 years (Keeling and Whorf, 2001), one wonders whether there is any noticeably effect on evapotranspiration, especially the measured reference ET of grass. During the 1960s there were a number of well measured grass lysimeter plots in various locations in California, measuring directly, by weight changes, the water consumption of grass. The University of California, in cooperation with the Department of Water Resources, should reinstall or reoperate former lysimeters at Davis and Five Points (on the San Joaquin Valley west side). Since there is variation from year to year and day to day, depending on weather conditions, it will probably take 3 to 5 years, perhaps 10 years, to see if there is a noticeably change from the measurements 40 years ago. It is possible that higher carbon dioxide is a factor in the continuing improvement in crop yields.
Estimate Change in ET and Crop Water Requirements
Knowledgeable experts in plant water consumption at the University of California and the Agriculture Extension Service and land and water use analysts in State and federal government should estimate likely future ET rates for major crops. To do this, they will need to obtain reasonable median projections of weather in 2050 and 2100 from the GCM climate modelers. This would be primarily temperatures, both average and maximum and minimum, in our dry summer climate, but could include projections of monthly rainfall changes if significant, and should include projected carbon dioxide levels. One would expect that higher water consumption because of increased temperatures will only be partly offset by carbon dioxide based reductions. The result would be slightly higher water requirements, probably varying somewhat by crop type. A complicating factor is possible shifts in the growing season of annual crops. For example, because of less frost risk, tomatoes might be planted earlier when the sun angle is not as high.
Climate Change 19
OTHER ITEMS OF RESEARCH
There are several other item of potential research which don't fit into the previous headings. These are discussed below.
Conduct a Systematic Review and Evaluation of the Effect of Global Warming on Major Multipurpose Flood Control Reservoirs
In a warmer world, some increase in the intensity of major precipitation events could be expected because saturated warmer air can hold more water vapor than cooler air. More intense precipitation would generate larger floods. Another factor on streams draining high mountain areas is that many storms now produce a mix of rain with snow on the higher parts of the watershed. A warmer climate means a greater proportion of storm precipitation is likely to be rain, producing more direct rain runoff.
Currently reserved flood control space in major multipurpose reservoirs during the winter may not be adequate for the larger storms. As a result, the degree of protection would gradually shrink. Additional flood control space or downstream channel capacity is likely to be expensive on our major rivers.
As GCM models are developed and improved, their precipitation results should be analyzed to see if there is a consistent trend for more intense storms and
precipitation events in California. The model precipitation can then be entered into watershed runoff models to assess the higher risk. A careful analysis of historical trends during the last 30 years or so may be useful too.
Water Temperature Modeling in Rivers
Warmer air and less snowmelt will make it more difficult to maintain rivers cold enough for cold-water fish, including anadromous fish like salmon. This could create difficult problems for some salmon, such as the winter run, where fish spend the warm season in the streams. There may be similar problems for juvenile steel head too. On most California rivers large foothill reservoirs provide some temperature control for downstream reaches.
There are some existing models of water temperature in reservoirs and downstream rivers. These models may need improvement as the job of maintaining suitable temperatures becomes more difficult. Analysis of selected foothill reservoirs and rivers is suggested to see what a different pattern of inflow and higher temperatures would do. Some new temperature modeling is
anticipated as part of the Oroville power plant relicensing during the next several years. A logical extension would be to apply the new Lake Oroville and Feather River temperature models under a changed climate and runoff regime.
Effect of Climate Change in Other Regions
The Colorado River, which drains a huge area of the American Southwest, is a very important component of California water supply, especially in the south. Earlier studies (Nash and Gieick, 1993) have indicated a high probability ofa change to less runoff. Since the Colorado River is already fully subscribed, ifnot oversubscribed, a reduction in average runoff could affect California's water supply as well as that of the other Colorado River Basin states. Hydroelectric power too could be affected, especially generation at Glen Canyon and Hoover dams due to change in reservoir levels.
California's long-term entitlements to Colorado River water are 4.4 million acre-feet (5.4 billion cubic meters) per year. In recent years, California's net diversions have been as much as 5.2 million acre-feet and the State is being forced to reduce its diversions as water demands in the other states build toward use of their entitlements. Climate change in the watershed could acerbate the water supply situation. It is also possible that a wetter scenario could improve Colorado River runoff, even to the point of generating more flood problems on the lower river.
California depends on the Pacific Northwest, including the Columbia River system, for about 10 percent of its electric energy supply. As we saw during 2001, when Columbia River runoff was down, there is an impact on California's electric power supply and reliability. In conclusion, the effects of climate change, especially precipitation, in the adjoining Pacific Northwest and Colorado River watershed would have an impact on California--on electricity for both regions and on water supply for the Colorado.
It is anticipated that new research and studies on runoff and water supply in both of these regions will be forthcoming by interested regional parties. It is recommended that the California Energy Commission and the Department of Water Resources monitor results of these studies as they are completed and try to assess what they might mean for California water supply and electric energy imports.
SUMMARY
The preceding are 11 areas of research on the effect of global warming on water resources systems in California that the author feels should have priority. There are many more items which could be added. In a report on potential water resources research ideas for a globally warmer world now being prepared by for the California Energy Commission Public Interest Energy Research (PIER) program, some 35 items were identified. However, completion ofthe work suggested herein would be an excellent start in adapting to a potentially different climate.
Climate Change
REFERENCES
California Coastal Commission, 2001. Overview of Sea Level Rise and Some Implicationsfor Coastal California. CCC, San Francisco, CA.
21
California Dep't of Water Resources, 1998. Bulletin No. 160-98, The California Water Plan Update. DWR, Sacramento, CA.
Gleick, Peter H. and Adams, D. Briane, 2000. Water; the Potential Consequences of Climate Variability and Change for the Water Resources of the United States. Pacific Institute, Oakland, CA.
Keeling, C.D. and Whorf, T.P., 2001. Chart showing Monthly Average Carbon Dioxide Concentration, Mauna Loa Observatory, Hawaii. Scripps Institution of Oceanography, La Jolla, CA.
Intergovernmental Panel on Climate Change, 2001. Summary for Policy Makers, Third Assessment Report, a Report of Working Group I on the IPCC web site. 20pp.
Knowles, Noah and Cayan, Dan, 2001. Global Climate Change: Potential Effects on the Sacramento/San Joaquin Watershed and the San Francisco Estuary. Scripps Institution of Oceanography, La Jolla, CA.
Nash, Linda and Gleick, Peter, 1993. The Colorado River and Climatic Change, prepared for the Environmental Protection Agency by Pacific Institute for Studies in Development, Environment, and Security, Oakland, CA .
San Francisco Bay Conservation and Development Commission, 1988. Sea Level Rise: Prediction and Implications for San Francisco Bay, prepared by Moffatt and Nichol, Engineers. SFBC & DC, San Francisco, CA.
Manucher Alemi'
ABSTRACT
Nigel Quinn2
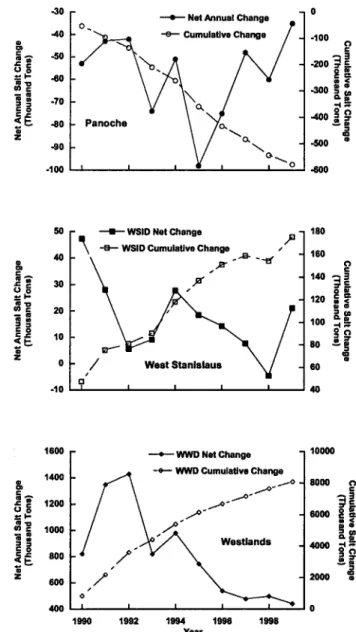
When considering salinity management in the San Joaquin Valley there is a tendency to take a broad approach and assume that all water districts have similar hydrologic characteristics, employ the same suite of technologies to address the soil management to sustain crop productivity, and maintain water quality. However, this article shows that water districts with different characteristics face different salt management challenges within the Valley. The three water districts chosen in this study are Westlands Water District, Panoche Water District, and West Stanislaus Irrigation District. They each have different histories, differ in the source of their irrigation water supply and differ in the physical and institutional constraints on their drainage return flows. These factors can have an impact on salt budget within each district. Approximate values of salt budget components for the three irrigation districts are presented.
INTRODUCTION
The westside of the San Joaquin Valley includes the San Joaquin River Basin and the Tulare Lake Basin with 2.4 million acres of mostly irrigated agricultural land. Historical drainage discharged to the San Joaquin River was about 55 thousand acre-feet (T AF) per year from an estimated 50 000 acres ofland with installed subsurface drain. The Tulare Lake basin at the southern end of the Valley has no natural drainage outlet and annually discharges 15 T AF of drainage water to evaporation ponds. In areas without installed subsurface drains and no or inadequate natural drainage, salts accumulate in the groundwater aquifer and the water table may rise over time.
Farmers and water districts within the Valley have adopted various irrigation improvements and drainage reduction measures to manage salts and trace elements in response to regulatory requirements to protect environmental
I Engineer-Water Resources, Associate Land and Water Use Analyst, and Supervising Land and Water Use Analyst, respectively; Data Services and Program Development Branch, Office of Water Use Efficiency, Department of Water Resources, 1416 Ninth Street, Sacramento, California 95814.
2 Group Leader, Hydroecological Engineering and Decision Support, Earth
Science Division, Berkeley National Laboratory, Berkeley, CA 94720.
1.4 USCIDIEWRI Conference
resources. These actions have resulted in significant reduction in the volume of drainage water discharged to the San Joaquin River (from 57 TAF in 1990 to about 30 T AF in 2000). Acreage of and discharge rates to evaporation ponds have also been reduced, since selenium induced teratogenesis in wildfowl embryos was found. For example, the evaporation pond acreage reduced from about 6 000 acres in 1990 to about 4 000 acres in 2000. The irrigation and drainage management measures and some fallowing have been the primary mechanisms for water conservation and reduction of contaminant loads to water bodies in the region. These measures coupled with separation and safe disposition of salts from the root zone or groundwater aquifer could result in sustainable soil and water quality. Drainage reduction and separation of salts from drainage help maintain agricultural productivity and water quality, and have the benefit of creating new sources of water supply.
BACKGROUND
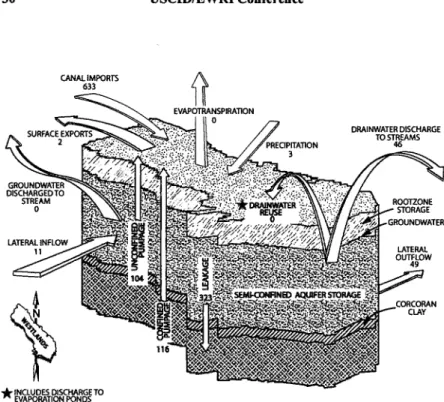
One of the principal subsurface geological features of the San Joaquin Valley is the Corcoran clay formation. Formed as a lakebed about 600 000 years ago, this clay layer ranges in thickness from 20 to 200 feet and underlies most of the westside of the Valley. The Corcoran clay divides the groundwater system into two major aquifers - a confined aquifer below and a semi-confined aquifer above. The Diablo Range to the west is comprised of complex, uplifted sediments, which are composed predominantly of sandstones and shales of marine origin. These sandstones and shales contain salts, as well as trace elements such as selenium. With decreasing elevation from the west to east, soil textures become finer. These fine textured soils are characterized by low permeability and increased
concentrations of water-soluble solids, primarily salts and trace elements. Furthermore, there are discontinuous clay lenses at different depths within the semi-confined aquifer, resulting in localized shallow groundwater. Three water districts are addressed in this paper, chosen for their distinct applied water and drainage characteristics. For example, West Stanislaus Irrigation District (WSID) can release drainage water to the San Joaquin River, Panoche Water District (PWD) has limited access to release drainage water to the San Joaquin River, and Westlands Water District (WWD) has no means for drainage water removal. Additionally, the districts differ in the quality oftheir irrigation water supply. WSID receives medium-quality water from a combination of Central Valley Project (CVP) and San Joaquin River water, PWD receives high-quality water from CVP water, and WWD receives some high-quality CVP water as well as lower-quality groundwater (depending on the availability ofCVP water).
Panoche Water!!!!t.ti.£!
PWD is located in the northern part of the Valley. Soils in the PWD can be characterized as very deep, nearly level to gently sloping, and moderately to poorly drained soils that are drained to some extent on low alluvial fans. PWD
began receiving its first water from the San Joaquin River in 1947 under interim contracts. In August 1949, contract negotiations began with United States Bureau of Rec1amation (USBR) for the CVP water, and a long-term contract was established in 1955. Currently PWD has a contract for the delivery of 99 T AF of water per year.
PWD receives a yearly average of nine inches of precipitation, most of which falls during the months of November through March. Reference evapotranspiration measured in PWD averages 55 inches per year.
PWD's service area is approximately 38000 acres. Actual irrigated land is approximately 36 000 acres. The five major irrigation methods in PWD (in order by highest to lowest acreage, in 1997) are (1) sprinkler (hand move) and graded (surface y.. mile: siphon tube); (2) graded (surface y.. mile: siphon tube); (3) trickle (surface and subsurface); (4) graded (surface y.. mile: gated pipe); and (5) sprinklers (hand move).
Historically, drainage water discharged from the PWD service area flowed through the wildlife refuges and then into the San Joaquin River. As a result of environmental limitations, it became necessary to remove the drainage water from the wildlife areas. Therefore, in 1996 the drainage water (from PWD and other districts in the area) was rerouted through a newly constructed channel that bypasses the refuges. The water now travels through the bypass, and portions of the San Luis Drain and is then discharged to the River. Due to selenium load limitations imposed by the Central Valley Regional Water Quality Control Board, a large portion of the subsurface drainage water (about 4.5 TAF annually) collected by PWD is blended back into the delivery system at several different locations. Additionally, as of 1997, PWD does not allow tailwater (surface drainage water) into its drainage or distribution system. The water is to be retained on farm by the individual water users where it is pumped back into the farmer's delivery system and redelivered to the field. This promotes more efficient water use and reduces the volume of drainage water conveyed to PWD's drainage works.
West Stanislaus Irrigation.rum:!£!
WSID is located in the northern part of the Valley. WSID was formed in 1920 and began diverting water from the River in 1929. Diversions increased from 12 TAF to a maximum of 113 T AF in 1984. After construction of the Friant Dam in 1942, the quantity of water available to WSID users decreased, and the quality of water became increasingly saline. WSID signed a contract with USBR in 1953 to receive 20 TAF of water from the CVP, which was increased to 50 TAF in 1976. WSID receives a yearly average of ten inches of precipitation, most of which falls during the months of November through March. Temperatures range from an
26
USCIDIEWRI Conferenceaverage monthly low of 17°F in winter months, to a high of 111°F in summer months. Reference evapotranspiration is 57.0 inches/year.
WSID total acreage and irrigable area is 24 500 and 21 500 acres, respectively. White Lake Mutual Water Company also irrigates approximately 5000 acres under an agreement. The soils are moderately to well drained, and permeability is low to medium. The majority of agricultural acreage is used to produce almonds, apricots, dry beans, green beans, melons, peas, walnuts, wheat, and can tomatoes. The five major irrigation methods (in order by highest to lowest acreage) are furrow (gated pipe), border (gated pipe), sprinkler, and micro/drip. Drainage water flows back into the River, either directly into natural channels or onto riparian land adjacent to the River.
Westlands Water District
WWD is located in the southern half of the Valley. It is approximately 15 miles wide and 70 miles long. Formed in 1952, it included approximately 376 000 acres. WWD later merged with its western neighbor to form the current 604 000-acre district with an irrigable 000-acreage of 567 800 000-acres. In 1968, USBR created a 40-year contract with WWD, providing 900 T AF of CVP water per year. Then in 1986, a new agreement added an additional 250 TAF of water per yeaf.
WWD receives a yearly average of seven inches of precipitation, most of which falls during the months of December through March. The mean annual
temperature is 62°F. Reference evapotranspiration is 58 inches/year.
Approximately 60 different crops are grown in WWD. In 2000, cotton, tomatoes, wheat, and almonds comprised almost 64% of the 564 200 cropped acres. WWD crops are irrigated using groundwater and CVP water. In the 1990's,
approximately 40% of all crop acreage was irrigated by surface irrigation systems (furrow and/or border irrigation), approximately 20% was irrigated by pressurized systems (sprinklers and/or drip irrigation), and approximately 40% was irrigated by a combination of surface and pressurized systems.
Currently, there is no outlet for drainage water. Some farms reuse subsurface drainage water. Some lands are fallowed annually due to inadequate water supplies and drainage-related problems. Shallow groundwater levels are typically highest in April after preirrigation and lowest following the cropping season in October after crops have extracted a portion of the shallow groundwater.
FLOW AND SALT MODELING
Numeric models have been developed to understand and predict groundwater levels and flow on the West Side of the San Joaquin Valley. These models provide a tool by which the effects of future changes in water use and management might affect groundwater levels. However, current models don't integrate water salinity data with flow to determine components of a salt budget for the west side of the Valley. In 1990, the United States Geological Survey created a three-dimensional groundwater flow model that was calibrated for a portion of the Valley4. This model was used to evaluate alternative management approaches over a 50-year period. The model evaluated groundwater responses to: land retirement; reduced recharge; increased groundwater pumping; and simultaneous reductions in recharge and increases in groundwater pumping. Results from the model showed that land retirement was an effective management tool on a local scale but not on a regional scale and that management of the semi-confined aquifer as a salt sink could be maintained from 40 to 275 years. This model represented one of the first comprehensive, calibrated attempt to characterize the hydrology of the Valley.
Following the Belitz and Phillips model, the USBR completed the Central Valley Groundwater and Surface Water Model (CVGSM). CVGSM is a specific application of the Integrated Groundwater and Surface Water Model (IGSMi, The CVGSM model simulates water inflow and outflow using various specific parameters including crop type, soil type, rainfall, applied irrigation water, potential ET, and irrigation efficiency. Additionally, stream-flow, stream-aquifer interactions, and unsaturated flow are also simulated. However, the model does not consider salt transport or loading. Presently CVGSM is being updated and improved as the WESTSIM model and will include a land use module. However, neither CVGSM nor WESTSIM have been calibrated for large-scale use. WESTSIM is capable of incorporating a salt budget module, but this is not in the current plans. Further development is needed to include salt budgets for future management planning. A number of other hydrologic models have been
developed for use in the Valley but none of them have been sufficiently calibrated or include a salt budget module to allow for salt transport characterization. Most models suffer from a general lack of measured data that is needed for rigorous calibration.
Various attempts at modeling salt budgets in the Valley have been attempted. In 1990 a course salt budget estimate was published by SNDJ»6. These values were
4 Belitz and Phillips, 1992.
5 Montgomery Watson, 1993.