DATA MINING APPROACHES FOR
OUTLIER DETECTION ANALYSIS
Shahrooz Abghari
Blekinge Institute of Technology
Doctoral Dissertation Series No. 2020:09
Outlier detection is studied and applied in many domains. Outliers arise due to different reasons such as fraudulent activities, structural defects, health problems, and mechanical issues. The detec-tion of outliers is a challenging task that can reveal system faults, fraud, and save people’s lives. Out-lier detection techniques are often domain-spe-cific. The main challenge in outlier detection re-lates to modelling the normal behaviour in order to identify abnormalities. The choice of model is important, i.e., an unsuitable data model can lead to poor results. This requires a good understand-ing and interpretation of the data, the constraints, and requirements of the domain problem. Outlier detection is largely an unsupervised problem due to unavailability of labeled data and the fact that labeled data is expensive.
In this thesis, we study and apply a combination of both machine learning and data mining techniques to build data-driven and domain-oriented outlier detection models. We focus on three real-world application domains: maritime surveillance, district heating, and online media and sequence datasets. We show the importance of data preprocessing as well as feature selection in building suitable meth-ods for data modelling. We take advantage of both supervised and unsupervised techniques to create hybrid methods.
More specifically, we propose a rule-based anom-aly detection system using open data for the mar-itime surveillance domain. We exploit sequential pattern mining for identifying contextual and col-lective outliers in online media data. We propose a minimum spanning tree clustering technique for detection of groups of outliers in online media and sequence data. We develop a few higher order mining approaches for identifying manual changes and deviating behaviours in the heating systems at the building level. The proposed approaches are shown to be capable of explaining the underlying properties of the detected outliers. This can facili-tate domain experts in narrowing down the scope of analysis and understanding the reasons of such anomalous behaviours. We also investigate the reproducibility of the proposed models in similar application domains.
T
A MINING
APPR
O
A
CHES FOR OUTLIER DETECTION
ANAL
Y
SIS
Shahr
ooz Abghari
2020:09ABSTRACT
Data Mining Approaches for
Outlier Detection Analysis
Blekinge Institute of Technology Doctoral Dissertation Series
No 2020:09
Data Mining Approaches for
Outlier Detection Analysis
Shahrooz Abghari
Doctoral Dissertation in
Computer Science
Department of Computer Science
Blekinge Institute of Technology
Publisher: Blekinge Institute of Technology
SE-371 79 Karlskrona, Sweden
Printed by Exakta Group, Sweden, 2020
ISBN: 978-91-7295-409-0
ISSN: 1653-2090
urn:nbn:se:bth-20454
“The more I learn, the more I realize how much I don’t know.” Albert Einstein
Abstract
Outlier detection is studied and applied in many domains. Outliers arise due to different reasons such as fraudulent activities, structural defects, health problems, and mechanical issues. The detection of outliers is a challenging task that can reveal system faults, fraud, and save people’s lives. Outlier detection techniques are often domain-specific. The main challenge in outlier detection relates to modelling the normal behaviour in order to identify abnormalities. The choice of model is important, i.e., an unsuitable data model can lead to poor results. This requires a good understanding and interpretation of the data, the constraints, and requirements of the domain problem. Outlier detection is largely an unsupervised problem due to unavailability of labeled data and the fact that labeled data is expensive.
In this thesis, we study and apply a combination of both machine learning and data mining techniques to build data-driven and domain-oriented outlier detection models. We focus on three real-world application domains: maritime surveillance, district heating, and online media and sequence datasets. We show the importance of data preprocessing as well as feature selection in building suitable methods for data modelling. We take advantage of both supervised and unsupervised techniques to create hybrid methods.
More specifically, we propose a rule-based anomaly detection system using open data for the maritime surveillance domain. We exploit sequential pattern mining for identifying contextual and collective outliers in online media data. We propose a minimum spanning tree clustering technique for detection of groups of outliers in online media and sequence data. We develop a few higher order mining approaches for identifying manual changes and deviating behaviours in the heating systems at the building level. The proposed approaches are shown to be capable of explaining the underlying properties of the detected outliers. This can facilitate domain experts in narrowing down the scope of analysis and understanding the reasons of such anomalous behaviours. We also investigate the reproducibility of the proposed models in similar application domains.
Preface
Included Papers
This thesis consists of seven papers. In Paper I, the author has been one of the main drivers. While in the next six papers, he has been the main driver. The studies in all papers have been developed and designed under the guidance of the supervisors and domain experts. The formatting of the published papers included in this thesis has been changed to achieve a consistent style.
Paper I Kazemi, S., Abghari, S., Lavesson, N., Johnson, H., & Ryman, P. "Open data for anomaly detection in maritime surveillance". Expert Systems with Ap-plications, (40)14 (2013), pp. 5719-5729. DOI: 10.1016/J.ESWA.2013.04.029
Paper II Abghari, S., Boeva, V., Lavesson, N., Grahn, H., Gustafsson, J., & Shaikh, J. "Outlier detection for video session data using sequential pattern mining". In Association for Computing Machinery’s Special Inter-est Group on Knowledge Discovery and Data Mining: Workshop On Outlier Detection De-constructed, 2018,
London, UK.
Paper III Abghari, S., Boeva, V., Lavesson, N., Grahn, H., Ickin, S., & Gustafsson, J. "A minimum spanning tree cluster-ing approach for outlier detection in event sequences". In 2018 17th IEEE International Conference on Ma-chine Learning and Applications (pp. 1123-1130). DOI: 10.1109/ICMLA.2018.00182.
matically identify heat program changes". En-ergy Procedia, 116 (2017), pp. 407-415. DOI: 10.1016/J.EGYPRO.2017.05.088, The paper was pre-sented at the 2016 15th International Symposium on District Heating and Cooling, Seoul, Korea.
Paper V Abghari, S., Boeva, V., Brage, J., & Johansson, C. "District heating substation behaviour modelling for
annotating the performance". In Cellier P., Driessens K. (eds) Machine Learning and Knowledge Discovery in Databases. ECML PKDD 2019. Communications in Computer and Information Science, vol 1168. Springer,
Cham. DOI: 10.1007/978-3-030-43887-6_1
Paper VI Abghari,S., Boeva, V., Brage, J., & Grahn, H. "Multi-view clustering analyses for district heating substa-tions". In 2020 9th International Conference on Data Science, Technology and Applications. (pp. 158-168). DOI: 10.5220/0009780001580168
Paper VII Abghari, S., Boeva, V., Brage, J., & Grahn, H. "Higher order mining approach for analysis of real-world
datasets". The paper is an extension of Paper VIII. (Submitted for journal publication)
Other research contributions that are related to this thesis but are not in-cluded:
Abstract I Abghari, S., Boeva, V., Lavesson, Gustafsson, J., Shaikh, J., & Grahn, H. "Anomaly detection in video session data". In 2017 5th Swedish Workshop on Data Science.
Abstract II Abghari, S., Boeva, V., Lavesson, N., Grahn, H., Ickin, S., & Gustafsson, J. "A minimum spanning tree clus-tering approach for mining sequence datasets". In 2018 6th Swedish Workshop on Data Science.
Paper VIII Abghari,S., Boeva, V., Brage, J., Johansson, C., Grahn, H., & Lavesson, N. "Higher order mining for monitoring district heating substations". In 2019 6th IEEE Inter-national Conference on Data Science and Advanced An-alytics (pp. 382-391). DOI: 10.1109/DSAA.2019.00053 Paper IX Abghari,S., Boeva, V., Brage, J., Johansson, C., Grahn, H., & Lavesson, N. "Monitoring district heating substa-tions via clustering analysis". In 2019 31st Swedish AI Society Workshop.
Paper X Eghbalian, A., Abghari, S., Boeva, V., Basiri, F. "Multi-view data mining approach for behaviour analysis of smart control valve". In 2020 19th IEEE International Conference on Machine Learning and Applications,
Acknowledgements
I would like to thank the people who have supported me to make this thesis possible. First and foremost, I would like to thank my supervisors Professor Niklas Lavesson, Professor Håkan Grahn, and Professor Veselka Boeva for their trust, patience, guidance, and valuable feedback. I appreciate the opportunities you provided for me to learn and grow both professionally and personally. Thanks to all my friends and colleagues who have supported me by having discussions and commenting on my work all these years. In particular, I would like to say thank you to my friend, Dr. Eva García-Martín, for her positive energy, supportive attitude and being someone that I can trust. Thank you Christian Nordahl and Johan Silvander for all the discussions we had that gave me hope and positive energies during times that were tough.
I would like to say thanks to the Swedish Knowledge Foundation for funding my research within the project “Scalable resource-efficient systems for big data analytics” under grant 20140032. Furthermore, I would like to extend my gratitude to Jörgen Gustafsson, the Research Manager at Ericsson Research Stockholm, and his team for their time, support and guidance. I also appreciate Christian Johansson, the CEO of NODA Intelligent Systems AB, and Jens Brage, Head of Research and Innovation at NODA, for providing resources and the opportunity for joint research collaborations.
Last but not least, I would like to say thanks to my family who have always been supportive. I would like to thank my loving girlfriend Amber Gray for her patience, understanding me and always being there.
Karlskrona, Sweden October 2020
Contents
Abstract . . . i Preface . . . iii Acknowledgements . . . vii 1 Introduction 1 1.1 Research Problem . . . 2 1.2 Outline . . . 4 2 Background 5 2.1 Machine Learning . . . 5 2.2 Clustering Analysis . . . 6 2.3 Data Mining . . . 7 2.4 Pattern Mining . . . 9 2.5 Outlier Detection . . . 11 2.6 Related Work . . . 133 Closed Data vs. Open Data 25 4 Research Methodology 29 4.1 Research Method . . . 29 4.2 Datasets . . . 31 4.3 Evaluation Measures . . . 33 4.4 Similarity Measures . . . 34 4.5 Validity Threats . . . 37 5 Results 39 5.1 Open Data for Anomaly Detection . . . 39
5.4 Summary . . . 49
6 Conclusions and Future Work 53 Bibliography 55 7 Open data for anomaly detection in maritime surveillance 69 Samira Kazemi, Shahrooz Abghari, Niklas Lavesson, Henric John-son, Peter Ryman 7.1 Introduction . . . 69
7.2 Background . . . 71
7.3 Open Data in Maritime Surveillance . . . 76
7.4 Case Study . . . 76 7.5 Framework Design . . . 79 7.6 Implementation . . . 81 7.7 System Verification . . . 83 7.8 System Validity . . . 85 7.9 Discussion . . . 89
7.10 Conclusion and Future Work . . . 92
References . . . 93
Appendix . . . 97
8 Outlier Detection for Video Session Data Using Sequen-tial Pattern Mining 107 Shahrooz Abghari, Veselka Boeva, Niklas Lavesson, Håkan Grahn, Jörgen Gustafsson, Junaid Shaikh 8.1 Introduction . . . 107
8.2 Background . . . 108
8.3 Related Work . . . 111
8.4 Methods and Technical Solutions . . . 111
8.5 Proposed Approach . . . 116
8.7 Results and Analysis . . . 120
8.8 Discussion . . . 124
8.9 Conclusion and Future Work . . . 125
References . . . 126
9 A Minimum Spanning Tree Clustering Approach for Out-lier Detection in Event Sequences 129 Shahrooz Abghari, Veselka Boeva, Niklas Lavesson, Håkan Grahn, Selim Ickin, Jörgen Gustafsson 9.1 Introduction . . . 129
9.2 Background and Related Work . . . 131
9.3 Methods and Techniques . . . 133
9.4 Experimental Methodology . . . 136
9.5 Results and Discussion . . . 138
9.6 Conclusion . . . 145
References . . . 146
10 Trend Analysis to Automatically Identify Heat Program Changes 151 Shahrooz Abghari, Eva Garcia-Martina, Christian Johansson, Niklas Lavesson, Håkan Grahn 10.1 Introduction . . . 151
10.2 Background and Related Work . . . 153
10.3 Detection of Changes in Trends by Using Regression Methods 155 10.4 Research Method . . . 157
10.5 Results . . . 160
10.6 Discussion . . . 161
10.7 Conclusion . . . 162
References . . . 163
11 District Heating Substation Behaviour Modelling for An-notating the Performance 167 Shahrooz Abghari, Veselka Boeva, Jens Brage, Christian Johansson 11.1 Introduction . . . 167
11.4 Results and Discussion . . . 174
11.5 Conclusion and Future Work . . . 176
References . . . 177
12 Multi-view Clustering Analyses for District Heating Sub-stations 179 Shahrooz Abghari, Veselka Boeva, Jens Brage, Håkan Grahn 12.1 Introduction . . . 180
12.2 Related Work . . . 181
12.3 Problem Formalization . . . 183
12.4 Methods . . . 183
12.5 Proposed Approach . . . 186
12.6 Experiments and Evaluation . . . 188
12.7 Results and Discussion . . . 191
12.8 Conclusions . . . 196
References . . . 198
13 Higher Order Mining Approach for Analysis of Real-world Datasets 201 Shahrooz Abghari, Veselka Boeva, Jens Brage, Håkan Grahn 13.1 Introduction . . . 201
13.2 Related work . . . 203
13.3 Methods and Techniques . . . 206
13.4 Proposed Method . . . 209
13.5 Real-world Case Study . . . 211
13.6 Experimental Design . . . 212
13.7 Results and Discussion . . . 217
13.8 Conclusion and Future Work . . . 227
1
Introduction
Outlier detection is studied and applied in different fields to detect anoma-lous behaviours. An outlier is a data point which is significantly different from other surrounding data [1–3]. Outliers can happen due to different reasons such as human errors, fraudulent behaviour, mechanical faults, and instrument errors. Regardless of the source of the outliers, their detection can reveal system faults, frauds, and interesting patterns in the data. The detected outliers can assist domain experts in narrowing down the scope of analysis and understanding the root cause(s) of such anomalous behaviours in order to respond to them accordingly.
Almost all outlier detection techniques create a model representing the normal patterns in the data1 to be able to detect whether a given data point is an outlier or not. There are several factors such as the nature of the input data, availability of the labeled data together with the constraints, and the requirements of the outlier detection problem at hand, that make data modelling challenging and domain specific [1].
This thesis explores data modelling of the outlier detection problem in three different application domains. Each of the studied domains have unique constraints and requirements, which demand validation with different experimental setups and scenarios. Outlier detection techniques are domain-dependent and are usually developed for certain problem formulations. However, similar domains may be able to adopt the same solution with some modifications. We initially investigate the importance of data modelling for outlier detection techniques in surveillance, fault detection, and trend
1
There are some studies that model abnormalities of the data [4–8]. Some authors referred to this technique as novelty detection. It can be considered as a semi-supervised task since the algorithm is taught the normal class, although it learns to recognize abnormality [1, 2].
analysis. In addition, the reproducibility of the proposed approaches in similar domains are investigated.
The nature of the input data affects the choice of data model, which makes the outlier detection problem data-specific. In this thesis, two different sources of data are used. The majority of data used in our experiments is provided by companies involved in the conducted studies. Such data is referred to as closed data, which is not publicly available. The other source, on the other hand, relates to open data, which can be freely accessed, used, re-used, and shared by anyone for any purpose. Therefore, the thesis also investigates the application of open data as a complimentary source to closed data for surveillance purposes in the maritime domain.
1.1
Research Problem
This thesis focuses on studying and developing data models for outlier detection problems. Understanding and modelling the available data are the core components of any outlier detection system. The main challenge in outlier detection problems relates to the definition of normal behaviour. In general, defining a normal region that represents every possible normal behaviour is very difficult [1]. Moreover, due to unavailability of the labeled data for training and validating, outlier detection is often categorized as an unsupervised learning problem.
In order to address these challenges and limitations, we design and develop a set of hybrid approaches that use a combination of machine learning and data mining techniques. The proposed approaches are applied to real-world use cases for identifying abnormal activities, deviating behaviours, and faults.
The main research questions we aim to address in this thesis are:
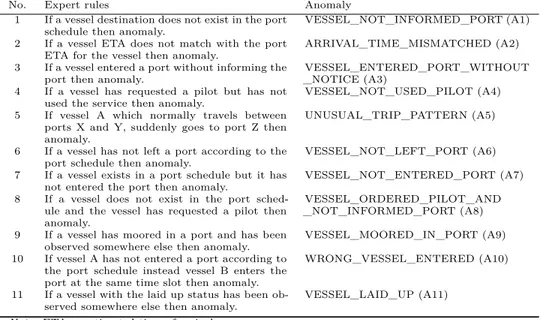
RQ 1. How accurate and valid are the results of an anomaly detection system that exploits open data as a complement to the available closed data? We address this research question in Chapter 7, where we investigate the potential of using open data as a freely accessible source of informa-tion for identifying anomalous behaviours in the maritime surveillance domain. Maritime authorities in each country only have overall infor-mation of maritime activities in their surveillance area. Exchanging
1.1. Research Problem
information, between different countries is often a complicated proce-dure because of the diverse regulation of data protection in each land. Therefore, using data sources that are free from legislative procedures can be a good solution for providing information that belongs to the regions outside the land territory. Furthermore, all the information about maritime activities is not recorded in the authorities’ databases or reported to them. On the other hand, there are numerous open data sources consisting of different websites, blogs and social networks that can be useful for observing the hidden aspects of the maritime activities.
RQ 2. How can contextual dependencies of the data instances be used to facilitate the detection of collective outliers?
We address this research question in Chapter 8 and 10. Chapter 8 aims to answer this research question through applying sequential pattern mining and clustering analysis for identifying anomalous patterns, in sequence data. In Chapter 10, we investigate an application of trend analysis for identifying manual changes in heating systems at the building level.
RQ 3. How can group outlier detection be used for identifying deviating be-haviour?
We address this research question in Chapter 9, in which we use a minimum spanning tree to identify a group(s) of outlying patterns in sequence data. Additionally, in Chapter 11, we propose a higher order mining method for modelling district heating substations’ behaviour with regards to different performance indicators. In Chapter 12, we propose a multi-view clustering approach for monitoring district heat-ing substations, which includes geographical information for identifyheat-ing neighbouring substations. In Chapter 13, we propose a higher order mining approach that consists of several different data analysis tech-niques for monitoring and identifying deviating operational behaviour of the studied phenomenon.
1.2
Outline
The remainder of this thesis is organized as follows:
Chapter 2: Background In this chapter, we explain the necessary
back-ground knowledge including variety of machine learning and data mining techniques that are used in the thesis. The section concludes with a discus-sion on related work performed in different domains to address the outlier detection problem.
Chapter 3: Closed Data vs. Open Data In this chapter, we provide
the required terminologies and definitions regarding closed and open data sources.
Chapter 4: Research Methodology This chapter presents the research
methodology that is used in this thesis to conduct the studies. In addition, it discusses the validity threats and limitations of the results.
Chapter 5: Results In this chapter, we summarize the results of the seven
studies included in the thesis, which are conducted to answer the research questions.
Chapter 6: Conclusions and Future Work This chapter concludes
the thesis by summarizing contributions and by discussing possible future directions.
2
Background
2.1
Machine Learning
Machine learning (ML) is a branch of artificial intelligence (AI), which is born from pattern recognition and computational learning theory. The term machine learning is first introduced by Arthur L. Samuel [9] in his famous paper “Some studies in machine learning using the game of checkers” in 1959. He defines ML as the “field of study that gives computers the ability to learn without being explicitly programmed”. A more precise definition is proposed by Tom Mitchell in his book “Machine Learning” in 1997 [10]: “A computer program is said to learn from experience E with respect to some task T and some performance measure P, if its performance on T, as measured by P, improves with experience E ”. In this definition, T refers to the class of tasks, P the measure of performance to be improved, and E the source of experiences, i.e., the training data. Thus, the primary goal in ML is to allow computer programs to learn automatically by identifying hidden patterns in data without human intervention and to adjust actions accordingly while improving their learning over time.
ML methods can be divided into two main categories based on the availability of labeled training data to a learning algorithm as follows:
• Supervised Learning Techniques In the presence of labeled exam-ples, such as input where the target class is known, supervised learning techniques is applied. In supervised learning, the goal is to learn a general rule on how to map inputs to outputs. Typical supervised learning tasks are classification and regression. Supervised learning can be divided further into three sub-categories when labeled data is partially available, or when the learning process is restricted to special feedback. These three sub-categories are as follows:
– Semi-supervised learning is used for the same applications as
supervised learning. However, both labeled data (in a small portion) and unlabeled data are used for training. The main reason relates to the fact that providing labeled training data is time consuming and requires experts’ knowledge which makes the process of data labeling expensive.
– Active learning is focused on learning algorithms that have the ability to select their own training examples from provided datasets and ask from an oracle or a labeling source to label them.
– Reinforcement learning includes learning algorithms that discover
which actions can maximize the expected rewards through trial and error over a given period of time [11].
• Unsupervised Learning Techniques In the absence of labeled training data, a learning algorithm requires on its own to explore the input data in order to find some structures such as discovering hidden patterns [11]. Clustering analysis is an example of an unsu-pervised learning technique that is applied in this thesis. Clustering analysis is explained in Section 2.2
2.2
Clustering Analysis
The task of partitioning a set of objects into groups of similar objects such that the objects within each group are similar to each other but dissimilar to the objects in neighboring groups, is referred to as clustering analysis [11, 12]. Traditional clustering algorithms can be grouped into five categories, namely partitioning, hierarchical, model-based, density-based, and grid-based methods. Due to the limitations of the traditional clustering algorithms in handling massive amounts of data in applications such as data stream mining, incremental clustering methods are proposed. These clustering methods are capable of analysing data instances one at a time and assigning them to the existing clusters. Detailed surveys of clustering methods can be found in [13–15].
In this thesis, we mainly use the affinity propagation (AP) algorithm [16] for clustering analysis. AP is able to choose the number of clusters from the input data and is suitable for use cases with uneven cluster sizes and specific shapes. In addition, the exemplars (the representative patterns) of
2.3. Data Mining
the built clustering model created by AP are real data points. In Paper II and Paper IV, we apply k-means [17] algorithm due to its simplicity. Both AP and k-means belong to the partitioning algorithms category.
Consensus Clustering Gionis et al. [18] propose an approach for clustering
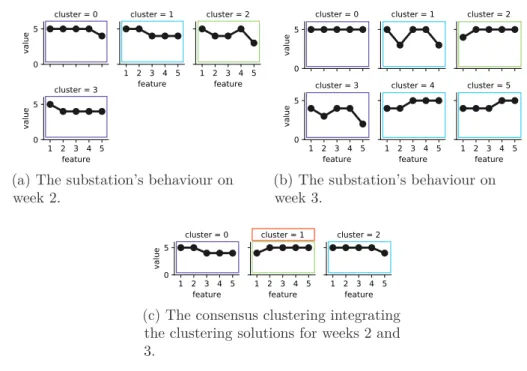
that is based on the concept of aggregation, in which a number of different clustering solutions are given for some datasets of elements. The objective is to produce a single clustering of the elements that agrees as much as possible with the given clustering solutions. Consensus clustering algorithms deal with problems similar to those treated by clustering aggregation techniques. Namely, such algorithms try to reconcile clustering information about the same data phenomenon coming from different sources [19] or different runs of the same algorithm [20]. In this thesis, we use the consensus clustering algorithm proposed in [19] in order to integrate the clustering solutions produced on the datasets collected for two consecutive time periods in Paper V and Paper VII. This is performed by considering the exemplars of the produced clustering solutions and dividing them into k groups (clusters) according to the degree of their similarity, by applying AP algorithm.
Multi-view Clustering Multi-view datasets consist of multiple data
rep-resentations or views, where each view may consist of several features [21]. Multi-view learning is a semi-supervised approach with the goal to ob-tain a better performance by applying the relationships between different views rather than one to facilitate the difficulty of a learning problem [22– 24]. Due to availability of inexpensive unlabeled data in many application domains, multi-view unsupervised learning and specifically multi-view clus-tering (MVC) attracts great attention [21]. The goal of multi-view clusclus-tering is to find groups of similar objects based on multiple data representations. In Paper VI, we propose an MVC approach for mining and analysing multi-view network datasets.
2.3
Data Mining
Data mining (DM) refers to the discovery of models for data [25] and knowledge extraction from large amounts of data [12]. A model can be one of several types. The most important directions in modelling are the followings [25]:
• Statistical Modelling The term data mining is first used by statisti-cians. Originally, DM has a negative meaning and refers to extracting information that is not supported by the data. Today, statisticians ap-ply DM to construct statistical models to further study the underlying distribution of data.
• Machine Learning DM is often used interchangeably with ML. How-ever, ML methods are used to understand the structure of the data. DM, instead, applies different ML algorithms to identify previously unknown patterns and extract insights from data.
• Computational Approaches to Modelling Such modelling is look-ing at DM as an algorithmic problem, i.e., the model of the data can simply explain complex queries about it. Summarization and feature extraction are two examples of such modelling. The aim of summa-rization is to provide a clear and approximate synopsis of the data. Regarding feature extraction, we can refer to frequent itemsets mining and sequential pattern mining that are explained in Section 2.4.
Higher Order Mining(HOM) A form of DM and a sub-field of knowledge
discovery that is applied on non-primary, derived data, or patterns to provide human-consumable results is referred to as HOM [26]. Majority of the proposed (hybrid) approaches in this thesis belong to the HOM paradigm, where varieties of ML and DM techniques are combined to provide results and patterns with semantics to facilitate experts in outlier detection and fault inspection in different real-world case studies.
Minimum Spanning Tree (MST) Given an undirected graph G = (V, E),
a spanning tree of the graph G is a connected sub-graph with no cycles that includes all vertices. An MST of an edge-weighted graph (G, w), where G = (V, E) is a graph and w : E → R is a weight function, is a spanning tree that the sum of the weights of its edges is minimum among all the spanning trees. Prime’s [27] and Kruskal’s [28] algorithms are two examples of greedy algorithms developed for identifying such a spanning tree. The MST has direct applications in network design such as computer networks and telecommunication networks. It is also used for cluster analysis and outlier detection [29–33]. In this thesis, we apply an MST for identifying groups of outlying patterns in sequence data and district heating data.
2.4. Pattern Mining
Euclidean Minimum Spanning Tree (EMST) The general idea with an
EMST is to consider k nearest neighbours of each point for building an MST rather than the entire set of edges in a complete graph 1. The EMST of a set of n points, P ⊂ R2, is a subset of the Delaunay Triangulation (DT) of those points. DT (P ) is a triangulation in which the circumcircle of every triangle is an empty circle, i.e., there is no point from P in its interior. DT has a number of interesting properties such as maximizing the smallest angle among all triangulations of P . This means, DT avoids narrow triangles, which makes it suitable for terrain modelling and surface analysis [35]. In Paper VI, we apply an EMST for identifying neighbouring substations for monitoring purposes.
2.4
Pattern Mining
Frequent Itemset Mining The application of frequent itemset mining for
market-basket analysis is first introduced by Agrawal et al. [36] in 1993. The aim of such analysis is to reveal customers’ shopping habits and to find out which sets of products are frequently bought together. The frequent itemset mining can be formulated as follows: let I = {i1, i2, ..., in} be a set of all
items and T = {t1, t2, ..., tj, ..., tm} a transaction database, where tj is a set
of items that is bought by a customer (tj ⊆ I). The aim is to find those sets
of items that occur frequently in most of the shopping baskets considering s, the user-specified support threshold.
The support for a k-itemset X, which consists of k items from I, is the number of transactions that contain X as a subset, i.e.,ST(X) = |{tj|X ⊆
tj∧ tj ∈ T }|. Note that the support of X can also be defined as the relative
support which is the ratio of the number of transactions containing X to the total number of transactions in the database T , i.e., RelST(X) = ST|T |(X),
such X is frequent if and only if its support is equal or greater than s.
Sequential Pattern Mining Originally in frequent itemset mining, the
order of items in the itemsets is unimportant. The goal of market-basket analysis is to identify frequent sets of items that are bought together. How-ever, there are some situations in which the order of items inside the itemset is important such as sequence databases. A sequence database consists
1
The computational complexity of Kruslkal’s [28] and Prim’s [27] MST algorithms are O(E log V ) and O(E + V log V ), respectively, on a graph with V vertices and E edges. The EMST on the other hand, has a computational complexity of O(V log V ) [34].
of ordered sequences of items listed with or without a concrete notion of time [37]. Sequential pattern mining, the problem of finding interesting frequent ordered patterns, is first introduced in 1995 [38].
Let I = {i1, i2, ..., in} be a set of all items. A sequence α is defined as
ha1, a2, ..., aj, ..., ami, where aj is an itemset. Each itemset aj represents a set
of items that are happened at the same time. A sequence α is a subsequence of β = hb1, b2, ..., bni if and only if there exist integers 1 ≤ i1 < i2 < ... <
in≤ m and a1⊆ bi1, a2⊆ bi2, ..., am⊆ bim [38]. Given a sequence database
T = {s1, s2, ..., sn}, the support for α is the number of sequences in T that
contain α as a subsequence. Consequently, α is a frequent sequential pattern if its support is equal or greater than the user-specified support threshold.
Mining frequent patterns in a large database can lead to generating a huge number of patterns that satisfy the user-specified support threshold. This is due to the fact that if a pattern is frequent, its sub-patterns are also frequent. To mitigate this problem, closed and maximal frequent pattern mining are proposed [37]. A frequent pattern α is called [37, 39]:
1. a closed frequent pattern in the database T if and only if none of its super-patterns have the same support as α,
2. a maximal frequent pattern in the database T if and only if none of its super-patterns is frequent.
Sequential Pattern Mining Algorithms Since the introduction of
fre-quent itemset mining and the Apriori algorithm [36], several extensions of this algorithm are developed for both frequent itemset mining and sequential pattern mining. In general, there are two main categories of algorithms suitable for frequent pattern mining: 1) Apriori-based algorithms and 2) Pattern-growth algorithms. Additionally, from a frequent pattern mining point of view, a sequence database can represent the data either in a horizon-tal data format or vertical data format [40]. Therefore, based on these two data formats Apriori-based algorithms can be expanded to: 1) horizontal data format algorithms such as AprioriAll [38] and GSP [41] and 2) vertical data format algorithms such as SPADE [42] and SPAM [43]. Apriori-based algorithms generate large sets of candidates and repeatedly scan the database for mining sequential patterns which require a lot of memory [44]. In or-der to solve this problem, pattern-growth approaches, as extensions of the
2.5. Outlier Detection
FP-growth algorithm [44], are proposed. Pattern-growth algorithms such as FreeSpan [45] and PrefixSpan [46] work in a divide-and-conquer fashion and repeatedly divide the database into a set of smaller projected databases and mine them recursively. We use PrefixSpan for pattern mining in Paper II, Paper III, Paper V, and Paper VII.
2.5
Outlier Detection
According to Grubbs [47], an outlier is an observation that deviates signif-icantly from other members of the sample in which it occurs. A similar definition is provided by Barnett and Lewis [48], stating that an outlier observation is the one which appears to be inconsistent with the remainder of that set of data. Hawkins [49] defines an outlier as a distinct observation that is seemed to be generated by a different mechanism. The detection of outliers requires an expert’s knowledge for modelling the normal behaviours (patterns) in data.
The problem of finding patterns that are distinct from the majority of the data is called outlier detection. These distinct patterns are often referred to as outliers or anomalies2. Outlier detection is related but distinct of noise detection. Noise can appear as attribute noise (implicit errors and missing values introduced by the measurement tools), class noise (mislabeled instances), or a combination of both. Errors and exceptions that occur during data collection and data preprocessing phases represent noise which should be repaired or eliminated from the data [50]. Outliers, on the other hand, can be considered as interesting and/or unknown patterns hidden in data which may lead to new insights, the discovery of system faults, or fraudulent activities. While some works do not separate noise and outliers [2], others refer to noise and anomalies as weak and strong outliers, respectively [3]. Figure 2.1 illustrates the data spectrum from normal data to noise, and anomalies. In Paper V, Paper VI, and Paper VII, we apply a Hampel filter [51] which is a median absolute deviation based estimation to detect and smooth out extreme values as a result of faults in measurement tools. The filter belongs to the three-sigma rules and robust against noises.
2
Outliers are also referred to as aberrations, contaminants, deviations, discordant observa-tions, error, excepobserva-tions, noise, novelty, peculiarities, or surprises in different domains [1, 2].
Normal data Noise Anomalies Weak and Strong Outliers
Figure 2.1: The spectrum of data from normal data to outliers (Adopted from [3].) Outlierness score from left to right is increasing.
Outliers can be classified into three categories [1, 12, 52]:
• Point Outliers An individual data instance that is distinct from the entirety of the dataset can be considered as a point (global) outlier. This is the simplest type of outlier.
• Contextual Outliers A data instance that deviates significantly with respect to a specific context or condition is referred to as a contextual or a conditional outlier. In a contextual outlier, the data instances are evaluated by considering two groups of attributes: 1) Contextual
attributes define the context or neighborhood for an instance. For
example in time series data the notion of time for each instance repre-sents its position 2) Behavioural attributes define the non-contextual characteristics of the instance, such as the measured value for each data point in time series data.
• Collective Outliers A collection (sequence) of related data instances that deviates significantly from the entire dataset. In a collective outlier, each individual data instance in the sequence may or may not be an outlier by itself, instead their occurrence together make them special.
Outlier detection techniques can be classified into three groups based on the availability of the labeled data [1, 2]: 1) In the absence of prior knowledge of the data, unsupervised learning methods are used to determine outliers. The initial assumption is that normal data represents a significant portion of the data and is distinguishable from noise or error, 2) In the presence of labeled data, both normality and abnormality are modeled. This approach refers to supervised learning, and 3) Define what is normal and only model normality. This approach is known as semi-supervised learning since the
2.6. Related Work
algorithm is trained by labeled normal data, however, it is able to detect outliers or abnormalities. Semi-supervised outlier detection techniques are more widely used compared to supervised techniques due to an imbalanced number of normal and abnormal labeled data.
The output of an outlier detection is one of the following two types [1–3]:
Scores: Outlier detection techniques that belong to this category provide a
score quantifying the degree to which each data point is considered as an outlier. Such techniques create a ranked list of outliers, which assist domain experts to analyse the top few outliers or define a domain-specific threshold to select the outliers. Labels: This category of techniques assign a binary label to each data point indicating whether it is an outlier or not.
Fault Detection Fault is an abnormal state within the system that may
cause a failure or a malfunction. Fault detection is the identification of an unacceptable deviation of at least one feature of the system from the expected or usual behaviour. The main objective of a fault detection and diagnosis (FDD) system is early detection of faults and diagnoses of their causes to reduce the maintenance cost and excessive damage to other parts of the system [53, 54].
FDD methods can fall into model-based methods and data-driven methods categories. The model-based methods require a priori knowledge of the system and can use either quantitative or qualitative models. Quantitative models are sets of mathematical relationships mainly based on physical properties, processes or models of the system. Qualitative models, on the other hand, use qualitative knowledge, e.g., including domain expert’s experience as a set of rules for identifying proper and faulty operations. Data-driven methods use historical data coming from a system to build models, i.e., they are system-specific. These methods become more and more popular in the recent years. Data-driven methods are easy to develop and do not require explicit knowledge of the system, which makes them suitable for domains with uncertainty [55, 56].
2.6
Related Work
Outlier detection techniques are studied and successfully applied in different domains. There exists a considerable number of studies that provide a comprehensive and structured overview of the state-of-the-art methods and
applications for outlier detection [1, 2, 57, 58]. In this thesis, we focus on three different domains, namely maritime surveillance, online media and sequence datasets, and district heating. Outlier detection techniques are domain-specific. This relates mainly to the nature of the data, availability of the labeled data, and type of outliers that should be detected. These factors are determined by the application domain and their identifications by the domain experts can lead to choosing a suitable data modelling.
Maritime Surveillance Domain
Maritime surveillance is the effective understanding of all maritime activities that can impact the security, safety, economy or environment3. Maritime transport handles over 80% of the volume of the global trade4. Along with the development of the maritime transport system, the threats to maritime security such as illegal fishing and pollution, terrorism, smuggling activities, and illegal immigration are increasing correspondingly.
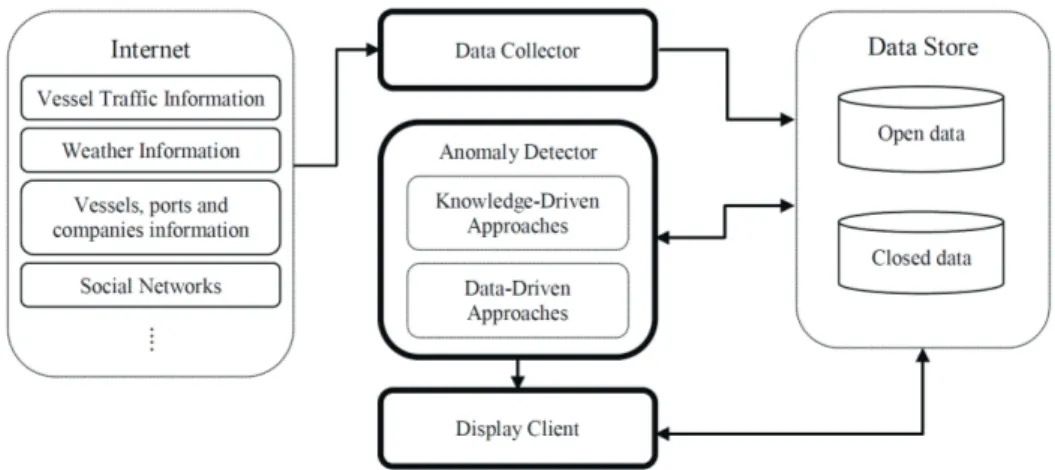
In recent years, the number of studies that address the use of anomaly detection in the maritime surveillance domain is increasingly growing. The anomaly detection techniques can be divided into two groups, namely data-driven and knowledge-data-driven approaches. There are a couple of works that propose knowledge-based anomaly detection systems with different represen-tation techniques and reasoning paradigms such as rule-based, description logic, and case-based reasoning [59–61]. A prototype for a rule-based expert system based on the maritime domain ontologies is developed by Edlund et al. [62]. The proposed prototype can detect some of the anomalies regarding the spatial and kinematic relation between objects such as simple scenarios for hijacking, piloting, and smuggling. Another rule-based prototype is developed by Defence R&D Canada [63, 64]. The aforementioned proto-type employs various maritime situational facts about both the kinematic data and the static data in the domain to make a rule-based automated reasoning engine for finding anomalies. One of the popular data-driven anomaly detection approaches is the Bayesian network [65–67]. Johansson and Falkman [66] use the kinematic data for creating the network; however,
3Integrating Maritime Surveillance, common information sharing environment, https:
//www.ec.europa.eu/maritimeaffairs/policy/integrated_maritime_surveillance/ documents/integrating_maritime_surveillance_en.pdf
4United Nations Conference on Trade and Development (UNCTAD), Review of Maritime
2.6. Related Work
in the work that is performed by Fooladvandi et al. [65] expert’s knowledge as well as the kinematic data are used in the detection process. Lane et al. [67] present the detection approaches for five unusual vessel behaviours, where the estimation of the overall threat is performed by using a Bayesian network. Unsupervised learning techniques are widely used for data-driven anomaly detection such as trajectory clustering [68], self organizing map [69] and fuzzy ARTMAP neural network [70]. Some statistical approaches, such as Gaussian mixture model [71], hidden Markov model [72], adaptive kernel density estimator [73] and precise/imprecise state-based anomaly detec-tion [68] are used in this context. The majority of the works that are done in the context of anomaly detection only used transponder data from the automatic identification system (AIS).
There are a number of studies that employ data fusion techniques to fuse data from different sensors in anomaly detection systems [74–77]. In these studies, the surveillance area is restricted to the coastal regions and the combination of data from AIS, synthetic aperture radar, infra-red sensors, video, and other types of radar are used in the fusion process to obtain the vessel tracks. Furthermore, there are some other works that focus on the fusion of both sensor and non-sensor data, e.g., expert’s knowledge [65, 78–82]. Riveiro and Falkman [82] introduce a normal model of vessel behaviour based on AIS data by using a self organizing map and a Gaussian mixture model. According to the model, the expert’s knowledge about the common characteristic of the maritime traffic is captured as if-then rules and the anomaly detection procedure is supposed to find the deviation from the expected value in the data. Lefebvre and Helleur [80] use radar data with user’s knowledge about the vessels of interests. The sensor data is modelled as track and the non-sensor data is modelled as templates. The track-template association is done by defining mathematical models for tracks and using fuzzy membership functions for association possibilities. Mano [81] proposes a prototype for the maritime surveillance system that can collect data from different types of sensors and databases and regroup them for each vessel. Sensors like AIS, high frequency surface wave radar and classical radars and databases such as environmental database, Lloyd’s Insurance and TF2000 Vessel database are additionally included in this prototype. By using multi-agent technology an agent is assigned to each vessel and anomalies can be detected by employing a rule-based inference engine. When the combination of anomalies exceeded a threshold, vessel
status is reported to the user as an anomaly. Ding et al. [79] propose an architecture of a centralized integrated maritime surveillance system for the Canadian coasts. Sensors and databases included in this architecture are high frequency surface wave radar, automatic dependant surveillance reports, visual reports, information sources, microwave radar, and radar sat. A common data structure is defined for storing data that are collected from different sensors. Andler et al. [78], also describe a conceptual maritime surveillance system that integrate all available information such as databases and sensor systems (AIS, long-range identification and tracking, intelligence reports, registers/databases of vessels, harbours, and crews) to help users to detect and visualize anomalies in the vessel traffic data on a worldwide scale. Furthermore, the authors suggest using open data in addition to other resources in the fusion process.
Online Media Domain and Sequence Datasets
The Internet is transformed almost every aspect of human society by enabling a wide range of applications and services such as online video streaming. Subscribers of such services spend a substantial amount of time online to watch movies and TV shows. This is required online video service providers (OVSPs) to continuously improve their services and equipment to satisfy subscribers’ high expectation. According to a study that is performed by Krishnan and Sitaraman [83], a 2-second delay in starting an online video program causes the viewers to start abandoning the video. For each extra second delay beyond that, the viewers’ drop-off rate will be increased by 5.8%. Thus, in order for OVSPs to address subscribers’ needs it is important to monitor, detect, and resolve any issues or anomalies that can significantly affect the viewers when watching requested video programs. Analysing massive amounts of video sessions for identifying such abnormal behaviours is similar to finding a needle in a haystack.
Barbará et al. [84] propose an intrusion detection system that applies a frequent itemset technique to discover sets of items that are available in most data chunks. Using a clustering algorithm, these items that are considered as attack-free traffic, are divided into different groups based on their similarities. After creating the clusters, an outlier detection technique is applied to all the data points, checking each instance against the set of clusters. Instances that do not belong to any clusters are presumed to be attacks. Recently, Rossi et al. [85] propose an anomaly detection system
2.6. Related Work
for the smart grid domain similar to the one that is considered in [84]. The proposed method by Rossi et al. uses frequent itemset mining on different event types collected from smart meters to separate normal and potential anomalous data points. For further evaluation, a clustering technique with SI analysis is applied to detect anomalies.
Hoque et al. [86] develop an anomaly detection system for monitoring daily in-home activities of elderly people called Holmes. The proposed system learns a resident’s normal behaviour by considering variability of daily activities based on their occurrence time (e.g., day, weekdays, weekends) and applying a context-aware hierarchical clustering algorithm. Moreover, Holmes learns temporal relationships between multiple activities with the help of both sequential pattern mining and itemset mining algorithms. New scenarios can be added based on residents’ and experts’ feedback to increase the accuracy of the system.
There are several clustering algorithms capable of detecting noise and eliminating it from the clustering solution such as DBSCAN [87], CRUE [88], ROCK [89], and SNN [90]. Even though such techniques can be used to detect outliers, the main aim for the clustering algorithm is to perform the partitioning task rather than identifying outliers. This leads to proposing clustering-based techniques that are capable of detecting: 1) single-point outliers such as the application of self organizing maps for clustering normal samples and identifying anomalous samples [91], and expectation maximiza-tion [92] for identifying the performance problems in distributed systems or 2) groups of outliers such as the proposed intrusion detection by [93].
The application of an MST is studied by researchers in different fields including cluster analysis and outlier detection [30–33, 94]. A two-phase clustering algorithm is introduced for detecting outliers by Jiang et al. [30]. In the first phase, a modified version of the k-means algorithm is used for partitioning the data. The modified k-means creates k + i clusters, i.e., if a new data point is far enough from all clusters (k, number of clusters defined by the user), it will be considered as a new cluster (the (k + i)th cluster where, i > 0). In the second phase, an MST is built where, the tree’s nodes represent the center of each cluster and edges show the distance between nodes. In order to detect outliers, the longest edge of the tree is removed. The sub-trees with a few number of clusters and/or smaller clusters are selected as outliers. Wang et al. [32] develop an outlier detection by
modifying k-means for constructing a spanning tree similar to an MST. The longest edges of the tree are removed to form the clusters. The small clusters are regarded as potential outliers and ranked by calculating a density-based outlying factor.
A spatio-temporal outlier detection for early detection of critical events such as flood through monitoring a set of meteorological stations is introduced in [94]. Using geographical information of the data, a Delaunay triangulation network of the stations is created. The following step limits the connection of nodes to their closest neighbors while preventing far nodes from being linked directly. In the next step, an MST is constructed out of the created graph. In the final step, the outliers are detected by applying two statistical methods to detect exactly one or multiple outliers.
Districts Heating Domain
A district heating (DH) system is a centralized system with the aim of producing space heating and domestic hot water (DHW) for consumers based on their demand within a limited geographic area. A DH system consists of three main parts: 1) production units, 2) distribution network, and 3) consumers. The heat is produced at a production unit and circulated through a distribution network to reach the consumers. This part of the system is referred to as primary side. The consumer unit consists of a heat exchanger, a circulation network, and radiators for space heating in the rooms. This part of the system is called the secondary side. The provided heat and DHW produced at the primary side are transferred through a substation into the consumer unit, the secondary side. The substation makes the water temperature and pressure at the primary side suitable for the secondary side.
In the DH domain, energy companies need to address several conflicting goals such as satisfying consumers’ heat demand including DHW while minimizing production and distribution costs. In addition, domain experts can consider different features and characteristics of the DH system for their analyses. Such complexity demands heat load forecasting and fault detection and root cause analysis techniques for identification of deviating behaviours and faults. Note that heat load forecasting at the building level can also be used as a fault detection.
2.6. Related Work
Heat load forecasting in a long term can minimize the operational cost and pollution by considering consumers’ demand and producing just the necessary amount of heat. However, modelling the heat demand forecasting is a challenging task, since water does not move fast. In some situations, the distribution of heated water can take several hours. Moreover, there are a number of factors that affect the forecast accuracy and need to be considered before any plan for production units can be constructed. Some of these factors include [95, 96]:
1. Weather condition, mainly the outdoor temperature 2. Social behaviour of the consumers
3. Irregular days such as holidays
4. Periodic changes in conditions of heat demand such as seasonal, weekly and day-night
Fumo [97] points out in his review two commonly used techniques for energy demand estimation, namely; forward (classical) and data-driven (in-verse) techniques. The first approach describes the behaviour of systems by applying mathematical equations and known inputs to predict the out-puts. In contrast, data-driven techniques use ML methods to learn the system’s behaviour by building a model with training data in order to make predictions.
Dotzauer [96] introduces a very simple model for forecasting heat demand based on outdoor temperature and social behaviour. The predictions of the model are shown to be comparable with complicated models such as autoregressive moving average model (ARMA). The author concludes that better predictions can be achieved by improving the weather forecasts instead of developing complicated heat demand forecasting models.
In general, different ML methods and techniques are used to predict the heat demand. Some of the most popular prediction models are autore-gressive moving average (ARMA) [98], support vector regression (SVR) [99, 100], multiple linear regression (MLR) [101], and artificial neural network (ANN) [102, 103]. In [100], the authors compare four supervised ML methods for building short-term forecasting models. The models are used to predict heat demand for multi-family apartment buildings with different horizon
values between 1 to 24 hours ahead. The authors conclude that SVR achieves the best performance followed by MLR in comparison to feed forward neural networks (FFNN), and regression trees methods. Recently, Provatas et al. [104], propose the usage of on-line ML algorithms in combination with decision tree-based ML algorithms for heat load forecasting in a DH system. The authors investigate the impact of two different approaches for heat load aggregation. The results of the study show that the proposed algorithm has a good prediction result. In another study [105], the authors show the application of a context vector (CV) based approach for forecasting energy consumption of single family houses. The proposed method is compared with linear regression, K-nearest neighbors (KNN), and SVR methods. The results of the experiment show that CV performed better in most cases followed by KNN and SVR. The authors conclude that the proposed solution can help DH companies to improve their schedule and reduce operational costs.
There are a number of studies that focus on the application of decision support (DS) systems in domains such as DH and mainly related to advanced energy management [106–111]. In these studies, the main focus is on forecasting and optimization methods that facilitate and support the decision-making processes to increase the energy management quality and bring considerable savings. Furthermore, there are some other works that focused on DH network design [112, 113]. Bordin et al. [112] present a mathematical model to support DH system network planning by selecting an optimal set of new users to be connected to a thermal network that maximizes revenues and minimizes infrastructure and operational costs.
A DH substation involves several components, each a potential source of faults. For example, a fault can consist of a stuck valve, a fouled heat exchanger, less than optimal temperature transmitters, a poorly calibrated control system, and many more [114, 115]. Gadd and Werner [116] classify the possible faults of substations and secondary systems into three categories as follows: 1) Faults resulting in comfort problems such as insufficient heating, or physical issues such as water leakage, 2) Faults with a known cause but unsolved due to cost, and 3) Faults that require advanced fault detection techniques for their discovery, which also includes faults caused by humans, such as unsuitable settings in building operating systems. Undetected faults can lead to underlying problems, which in return can increase the maintenance cost and reduce the consumers’ satisfaction.
2.6. Related Work
When it comes to monitoring of a DH network, the domain experts often analyse substations individually or in a group with regard to one specific feature or a combination of features. While this provides useful information for the whole network it does not take into account the location of the substations along the distribution network and their neighbouring substations automatically. In other words, the operational behaviours of the DH substations need to be assessed jointly with surrounding substations within a limited geographical distance. Due to the nature of the data and the fact that different data representations can be used, the process of monitoring and identifying faults and deviating behaviours of the DH system and substations can be treated as a multi-view data analysis problem. Multi-view datasets consist of multiple data representations or views, where each one may contain several features [21]. Due to availability of inexpensive unlabeled data in many application domains, multi-view unsupervised learning and specifically multi-view clustering (MVC) attract great attention [21]. The goal of multi-view clustering is to find groups of similar objects based on multiple data representations. MVC algorithms are proposed based on different frameworks and approaches such as k-means variants [117–119], matrix factorization [120, 121], spectral methods [122, 123] and exemplar-based approaches [124, 125].
Bickel and Scheffers [117] propose extensions to different partitioning and agglomerative MVC algorithm. The study can probably be recognized as one of the earliest works where an extension of k-means algorithm for two-view document clustering is proposed. In another study [118], the authors develop a large-scale MVC algorithm based on k-means with a strategy for weighting views. The proposed method is based on the `2,1 norm, where the `1 norm is enforced on data points to reduce the effect of outlier data and
the `2 norm is applied on the features. In a recent study, Jiang et al. [119]
propose an extension of k-means with a strategy for weighting both views and features. Each feature within each view is given bi-level weights to express its importance both at the feature level and the view level.
Liu et al. [120] propose an MVC algorithm based on joint non-negative matrix factorization (NMF). The developed algorithm incorporates separate matrix factorizations to achieve similar coefficient matrices and further meaningful and comparable clustering solution across all views. In a recent study, Zong et al. [121] propose an extension of NMF for MVC that is based on manifold regularization. The proposed framework maintains the locally
geometrical structure of multi-view data by including consensus manifold and consensus coefficient matrix with multi-manifold regularization.
Kumar and Daumé [122] propose an MVC algorithm for two-view data by combining co-training and spectral clustering. The approach is based on learning the clustering in one view to label the data and modify the similarity matrix of the other view. The modification of the similarity matrices are performed using discriminative eigenvectors. Wang et al. [123] propose a variant of spectral MVC method for situations where there are disagreements between data views using Pareto optimization as a means of relaxation of the agreement assumption.
Meng et al. [124] propose an MVC algorithm based on affinity propagation (AP) for scientific journal clustering where the similarity matrices of the two views (text view and citations view) are integrated as a weighted average similarity matrix. In another study, Wang et al. [125] propose a variant of AP where an MVC model consists of two components for measuring 1) the within-view clustering quality and 2) the explicit clustering consistency across different views.
FDD is an active field of research and is studied in different application domains. Isermann [53, 54] provides a general review for FDD. Katipamula and Brambley [55, 56] conduct an extensive review in two parts on fault detection and diagnosis for building systems. Fontes and Pereira [126] propose a fault detection for gas turbines using pattern recognition in multivariate time series. In another study [127], the authors propose a general methodology for identifying faults based on time-series models and statistical process control, where faults can be identified as anomalies in the temporal residual signals obtained from the models using statistical process control charts.
In a recent review, Djenouri et al. [128] focus on the usage of machine learning for smart building applications. The authors classify the exist-ing solutions into two main categories: 1) occupancy monitorexist-ing and 2) energy/device-centric. These categories are further divided into a number of sub-categories where the classified solutions in each group are discussed and compared.
Gadd and Werner [116] show that hourly meter readings can be used for detecting faults at DH substations. The authors identify three fault groups:
2.6. Related Work
1) Low average annual temperature difference, 2) Poor substation control, and 3) Unsuitable heat load patterns. The results of the study show that low average annual temperature differences are the most important issues, and that addressing them can improve the efficiency of the DH systems. However, solving unsuitable heat load patterns is probably the easiest and the most cost-effective fault category to be considered. Sandin et al. [129] use probabilistic methods and heuristics for automated detection and ranking of faults in large-scale district energy systems. The authors study a set of methods ranging from limit-checking and basic model to more sophisticated approaches such as regression modelling and clustering analysis on hourly energy metering. Calikus et al. [130] propose an approach for automatically discovering heat load patterns in DH systems. Heat load patterns reflect yearly heat usage in an individual building and their discovery is crucial for effective DH operations and managements. The authors apply k-shape clustering [131] on smart meter data to group buildings with similar heat load profiles. Additionally, the proposed method is shown to be capable of identifying buildings with abnormal heat profiles and unsuitable control strategies.
Xue et al. [132] apply clustering analysis and association rule mining to detect faults in substations with and without return-water pressure pumps. Clustering analysis is applied in two steps to 1) partition the substations based on monthly historical heat load variations and 2) identify daily heat variation using hourly data. The result of the clustering analysis is used for feature discretization and preparation for association rule mining. The results of the study show that the proposed method can discover useful knowledge to improve the energy performance of the substations. However, for temporal knowledge discovery, advanced DM techniques are required. Capozzoli et al. [133] propose a statistical pattern recognition techniques in combination of artificial neural ensemble network and outlier detection methods to detect real abnormal energy consumption in a cluster of eight smart office buildings. The results of the study show the usefulness of the proposed approach in automatic fault detection and it ability in reducing the number of false alarms. Månsson et al. [115] propose a method based on gradient boosting regression to predict an hourly mass flow of a well performing substation using only a few number of features. The built model is tested by manipulating the well performing substation data to simulate two scenarios: communication problems and a drifting meter fault.
The model prediction performance is evaluated by calculating the hourly residual of the actual and the predicted values on the original and the faulty datasets. Additionally, cumulative sums of residuals using a rolling window that contains residuals from the last 24 hours are calculated. The results of the study show that the proposed model can be used for continued fault detection.
3
Closed Data vs. Open Data
According to the Open Data Institute (ODI), data is closed if it can only be accessed by its subject, owner, or holder. This includes data that is only available to an individual, a group of people, or within an organization for specific reasons. Closed data should not be shared either for security reasons or as it contains personal information.
The Open Definition1 defines the term open as follows: “Open means
anyone can freely access, use, modify, and share for any purpose
(subject, at most, to requirements that preserve provenance and openness)”. That is, open data can be freely accessed, used, re-used, and shared by anyone for any purpose. More specifically, open data has to be 1) legally open and available under an open license that permits anyone to access, use, and share it, 2) technically open and usable through no more than the cost of reproduction and in a machine-readable format.
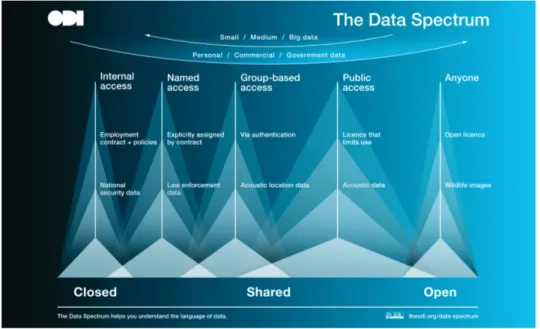
Apart from closed data and open data, there is a third category that is referred to as shared data. According to ODI, shared data is available to:
• Named people or organizations (Named access)
• Specific groups who meet certain criteria (Group-based access) • Anyone under terms and conditions that are not open (Public access)
Figure 3.1 shows the data spectrum provided by ODI ranges from closed to shared to open data.
The idea behind open data is established for a long time. Open data can be used in a variety of domains and obtained from any resource. The
1
Figure 3.1: The ODI data spectrum (Reproduced from ODI.)
two major sources of open data are scientific communities and governmental sectors. One of the outcomes of the open data movement in science is the availability of large number of scientific online datasets for the public by different organizations. As well as the open data movement in science, governments for over a decade attempt to publish governmental data online and make it publicly accessible, readily available, understandable, and usable [134]. The sharing of governmental data with the public can provide openness and transparency to citizens. It can also improve the degree of participation in societal activities, the efficiency and effectiveness of the government services, and the operations within government and between different governmental organizations or sectors [135].
In Paper I, the application of open data in the maritime surveillance domain is studied. The majority of the studies that are performed in the context of anomaly detection in this domain used sensor data and mainly the automatic identification system (AIS) data to find anomalies in coastal regions. Detection of some suspicious activities such as smuggling requires vessel traffic data beyond the coastal region. Maritime authorities in each country have overall information of maritime activities in their surveillance area. However, exchanging information among different countries
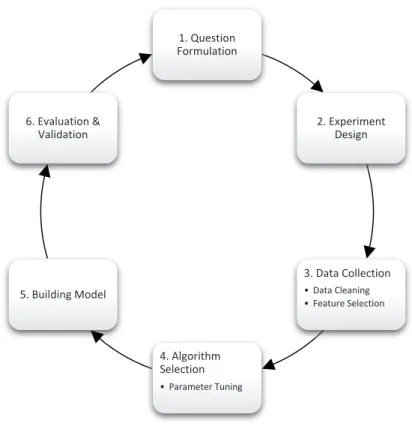
![Figure 4.1: Constructing an outlier detection technique (Adopted from [136]).](https://thumb-eu.123doks.com/thumbv2/5dokorg/4273589.94889/48.744.161.566.557.853/figure-constructing-outlier-detection-technique-adopted.webp)