A study of regional Human Capital’s
effect on commuting in Sweden
BACHELOR THESIS WITHIN: Economics
NUMBER OF CREDITS: 15 ECTS
PROGRAMME OF STUDY: International Economics
TUTOR: Michael Olsson Emma Lappi
AUTHOR: Johanna Carlson 910129 Hanna Malmfors 950209
JÖNKÖPING May, 2018
Gender Differences in
Commuting over
i
Bachelor Thesis in Economics
Title: Gender Differences in Commuting over Municipality Borders: A Study of Regional Human Capital’s effect on commuting in Sweden.
Authors: Johanna Carlson Hanna Malmfors Tutor: Michael Olsson
Emma Lappi
Date: May, 2018
Key terms: Commuting, Gender Equality, Human Capital, Geographical differences, Labor market
Abstract
Gender equality has increased over time, and the question of how it progresses is highly important. Commuting behavior is an essential theme in Economic research since it, for example, affects the market structure, the distribution of labor, and economic growth. The purpose is to investigate how human capital impacts individuals’ commuting to work, and especially if human capital has different effects on women and men. To con-struct our model, we present several factors of interest that affect commuting, where hu-man capital is the main variable investigated. Previous research show that women’s com-muting behavior differs from men’s. By analyzing data from 2016, we aim to study the difference between women and men, by investigating the factors that impact their com-muting for work over municipality borders in Sweden. The contribution of this paper is to increase the understanding of commuting within regional economics and gender stud-ies. Our result show that human capital affects net outgoing commuting for both women and men, but the extent of the effect differs. Women are less affected by the level of human capital, and they still commute less than men although more women obtain higher human capital, in terms of education.
ii
Table of Contents
1.
Introduction ... 1
2.
Theory and Literature Review ... 4
2.1 Commuting ... 4
2.2 Gender Equality ... 5
2.3 Previous Research on Commuting and Gender Equality ... 6
2.4 Factors Affecting Commuting ... 8
Human Capital ... 8
Amenities ... 9
Job Opportunities ... 10
Geographical Variation in Transportation Networks ... 12
3.
Variables and Data... 14
3.1 Variables ... 14
The dependent variable ... 14
Independent Variables ... 17
3.2 Expected signs ... 19
3.3 Descriptive Statistics ... 20
3.4 Correlation Analysis ... 22
4.
Empirical Model and Results ... 24
4.1 Econometric Model ... 24
4.2 Regression Analysis... 24
Initial Regression ... 25
Regression Excluding Highly Correlated Variables ... 27
Robustness check ... 29
5.
Conclusion ... 30
6.
References ... 33
1
1. Introduction
Market conditions are constantly changing, due to for example alterations in international trade agreements, consumption patterns, and rapid improvements in technology. An es-sential part of adjusting to these new market conditions is to secure movement in the labor market, which includes moving and commuting between and within municipalities for work. Due to globalization, the labor market is demanding a more flexible workforce, which, with the help of the governments’ policy changes, the workers are responding to accordingly. In the attempt to achieve a lower unemployment rate, the effectiveness of matching vacancies and job-seekers is vital. (Finansdepartementet, 2007).
Stimulating the movement in the labor force, for instance by commuting possibilities, has been one of the key elements for the Swedish labor policymakers for a long time. During the 1940s, the Rehn-Meidner model was implemented. The model suggests that for the government to be able to reach the optimum level of employment, they must enforce policies for increased mobility in the labor market. According to Rehn, mobility increases the individual's freedom and power against corporations (Erixon, 2008). In times of low unemployment and high demand for labor, the government continuously tries to improve the conditions for individuals in the labor force to better match job seekers with jobs. Through commuting, areas of high unemployment and few vacancies could be offset by areas of low unemployment and many vacancies (Finansdepartementet, 2007).
However, there are differences of opinion concerning whether increased commuting is good or bad. Commuting can have a negative effect on the housing market (Finansdepar-tementet, 2007) and if the commuting is by car or public transportation systems, it in-creases CO2 emissions (Naturvårdsverket, 2018). Also, an individuals’ health can be harmed by lack of exercise and social interaction when a lot of time is spent on commut-ing (Hansson, Mattisson, Björk & Jakobsson, 2011).
Several factors determine an individual’s responsiveness to commuting. For instance, the geographical variation in the labor market, in the number of amenities, and of the human capital level affecting one’s decision regarding commuting (Finansdepartementet, 2007). If an individual does not want to commute, he or she may have to find a different job or move to another location closer to the workplace. Commuting long distances is most often not regarded as a long-term solution (Sandow & Westin, 2010). Studies have shown that
2
increased commuting is related to higher levels of human capital (VINNOVA, 2010). This might be explained by the fact that having a higher education often generates higher wage, which in turn is associated with occupations where commuting is common. Alt-hough women to a larger extent than men obtain a higher education, women still earn less than men. (Swedish Institute, 2018). The correlation between human capital and commut-ing, and the difference across genders is, therefore, an interesting topic.
The purpose is to investigate how human capital impact workers commuting to another municipality than they live in, i.e., outgoing commuting, and especially if human capital has different effects on women and men, in Sweden today. As mentioned, several factors determine commuting patterns, and the primary factor emphasized in this thesis is human capital. Previous studies in gender inequality of commuting show a clear trend in men commuting further to work than women in the last century (Finansdepartementet, 2007; Håkansson, 2010; Wyly, 1998).
As gender inequality continues to be one of Sweden’s most debated topics within eco-nomics, this study tries to map out the current commuting situation in Sweden. Since commuting is a reflection of the level of human capital and wages, it should in practice have the same correlation for women and men. Some other factors that affect ones com-muting are distance, access to school, job opportunities, closeness to relatives and socio-logical factors such as household responsibilities. Measuring human capital can be done in several ways, we have decided to measure it by the share of people with a post-second-ary education for three years or more. Since women in Sweden nowadays obtain a higher level of human capital than men, one would expect to see more equal wages and com-muting behavior than historically. Therefore our research question will be: Does the level
of human capital in a municipality affect the commuting for work over the municipality border of women and men in the same way?
We hope that, with this paper, increase the understanding of human capital’s effect on commuting, more specifically commuting over the municipality border for work. This topic is of high importance since commuting is a reflection of gender equality in the sense that those who commute are given more work opportunities, and access to different kinds of jobs. We want to highlight that, although women today obtain higher human capital, they commute and earn less than men. With this paper we want to highlight the fact that
3
commuting patterns is a sign of gender equality. This will be done by using the ordinary least square method, with data conducted from Statistics Sweden, the Swedish Public Employment Service and Hui Research. We conduct a cross sectional study by investi-gating all the 290 municipalities in Sweden for the year 2016.
4
2. Theory and Literature Review
To give a broader understanding regarding patterns of commuting and gender equality, this section will provide background and previous research, and explain the current situ-ation in Sweden. Also, some factors which affect commuting, human capital, amenities, job opportunities and the geographical variation and infrastructure in Sweden, are further discussed.
2.1
CommutingWhile the average time spent on commuting to work has had a fairly steady increase, the daily range has increased drastically due to improvements in the infrastructure and tech-nological development of means of transportation. In some regions in Sweden, the daily range increased by more than ten times during the last century. It is not only the condition of the regional labor market that affects commuting, but also the individual's situation and experience of that specific market. Often workers decide between commuting to work or moving closer to the workplace. Whether workers choose to commute depends on a va-riety of factors, such as the level of education, the population density, and the job oppor-tunities in the residential municipality (Finansdepartementet, 2007). Previous research shows that women on average commute less than men, some reasons being the choice of occupation and household responsibilities (Finansdepartementet, 2007; Håkansson, 2010; Wyly, 1998).
The number of workers that commute is increasing (Håkansson, 2010), and, as explained by Finansdepartementet (2007), the patterns of commuters are changing. Håkansson (2010) states that, because of technological development and more opportunities to com-mute, workers commute longer distances now than previously which has led to the labor market in Sweden becoming more integrated. Statistics Sweden has grouped municipali-ties in what it labels as local labor markets to demonstrate regions which in practice have a common labor market. Two or more municipalities are considered having a common labor market if a significant proportion of individuals living in one of these works in another. The largest local labor market in terms of workers is called Stockholm-Solna, consisting of Stockholm, Solna and all their surrounding municipalities. As workers com-muting between municipalities is increasing, the number of local labor markets decreases
5
(Håkansson, 2010). Data collected by Statistics Sweden (2018) shows an increase of al-most a fourth in workers commuting from one municipality to another between the years 2006 and 2016 in Sweden. During the same years, there was a decline in numbers of local labor markets, decreasing from 79 in 2006 to 71 in 2016 (Statistics Sweden, 2018).
Whether increased commuting is good or bad has been debated. The possibility of com-muting elsewhere should, in theory, make it easier for people to find jobs wherever they choose to live, by getting access to a larger amount of vacancies. Additionally, it should make structural changes less challenging for smaller municipalities, in the sense that workers may start commuting to other municipalities rather than move away. Moreover, by choosing to commute rather than move to more densely populated areas, one can take advantage of the already existing housing capital (Finansdepartementet, 2007). Negative spillovers from commuting regarding health have been found, including the lack of time for physical activities, leisure and participation in social events. Studies also show that the amount of sick leave correlates with the amount of commuting (Hansson et al., 2011).
Previously, an individual's utility of commuting has been studied from a financial aspect rather than the being of an individual. In recent years, however, a person’s well-being has been taken into account. Active commuting, also referred to as human-powered transportation, increases a human's well-being (Hansson et al., 2011) and is beneficial from an environmental aspect, while commuting by car or public transportation has a negative impact in terms of CO2 emissions (Naturvårdsverket, 2018). The increased num-bers of workers commuting may also be seen as a sign of a non-functioning housing mar-ket. A municipality with a high number of vacancies will attract people, which in turn will trigger the housing prices. As a result, people will move to another municipality nearby, where one can afford housing and commute to work instead (Finansdeparte-mentet, 2007). An example of a non-functioning housing market is the city center of Stockholm, which has the most volatile housing market in Sweden. In 2006, the price per square meter was 45,000 SEK, and in 2017, it had increased to more than 90,000 SEK (Svensk Fastighetsförmedling, 2018).
2.2
Gender EqualityGender equality means that everyone has the same opportunities and rights, both privately and in the work life. Sweden, along with many other countries, is striving to obtain gender
6
equality. The Global Gender Gap Report, which analyzes and rank countries depending on the level of the gender equality in politics, economics, health, and education, has never ranked Sweden lower than fifth place since the report started in 2006. Although Sweden has come a long way regarding equality, there are still differences between women and men, especially in the workplace. Women earn less than men, on average women earn 88 percent of men’s salary. Men are overrepresented in the highest positions in private cor-porations; in 2016, only six percent of the CEO positions were held by women in listed companies. Sweden has laws to regulate inequality, which obligates employers to obtain gender equality at work and to take actions against any discrimination or harassment. One of the explanations for wage differences is the choice of occupation. (Swedish Institute, 2018). Women and men chose to work in different fields and generally the fields that are overrepresented by men have higher average wages (JämO, 2018). The differences are smaller in the public sector, especially in blue-collar jobs (Swedish Institute, 2018).
Although different occupations explain some of the wage differences, there is no expla-nation for wage differences within the same profession. According to the Swedish Insti-tute for Labor Market and Education Policy Evaluation (IFAU), the first child has a neg-ative impact on the expansion of a woman’s salary. After the first 15 years as parents, the wage difference increases to about 32 percent between the parents. Women are also less likely to get a CEO position after they have their first child. In addition to the family situation, women are often over-educated for their position, which is another explanation for being underpaid. (IFAU, 2018).
2.3
Previous Research on Commuting and Gender EqualityPrevious research, conducted in Spain by Sanchez and Gonzalez (2016) and in the U.S. by Wyly (1998), found that there is a difference in the extent of commuting to work be-tween women and men. As is the case for Sweden, where the gap is present with fewer women than men commuting for work in a different municipality than they live in. In 2016, the shares of outgoing commuters to total labor force were 0.24 for women and 0.29 for men (Statistics Sweden, 2018). The difference in commuting patterns might be a sign of gender inequality, according to Sanchez and Gonzalez (2016), who also concluded that women are more sensitive to changing commuting patterns.
7
Wyly (1998) explains that differences in commuting length for women and men might come from their differing levels of human capital. Wyly also found that, in the U.S. hav-ing a higher education increased the commuthav-ing time for women while it did not have same effect on men. In the same study, Wyly presented that women commuted one-sixth of the commuting time compared to men in 1996. While Wyly (1998) argued that higher education led to an increased commuting time for women, Olsson (2002) claims there is no relationship between having a higher level of education and increased commuting time for women, in Sweden. However, Olsson states that as the level of education increases for men, their commuting time increases as well.
According to Wyly (1998), the accessibility of work for women must increase for the occupational sex segregation to decrease. Håkansson (2010) explains that one reason for commuting patterns differing between genders in Sweden could be that more women than men work in the public sector. All municipalities offer jobs in preschools, schools and health clinics, which are a part of the public sector, making it possible for women in those fields to work in the same municipality as they live. Only 24 percent of women working in the public sector commuted outside their municipality in 2008 (Håkansson, 2010).
Another explanation for women commuting less than men could be due to women more frequently take on household responsibilities, as stated by the Household Responsibility Hypothesis (HRH). When studying women and men with equal education level, income level, preferences and household commitment, one would expect the commuting behavior to be the same (Duarte, Neto, Páez, 2015). According to Turner and Niemeier (1997), the disparities in commuting it will exist as long as there is gender inequality. Turner and Niemeier’sideas are supported by previous research conducted by White (1977), who explained that the reasoning behind the disparities are more sociologically grounded than economically. This means that commuting is based on the society’s norms of allocation of a family’s resources rather than the monetary benefits of commuting, i.e increasing the wage for the family. White suggested that married women are more likely to work in the suburbs and that women in general commute shorter distance than men. (White, 1977). In conclusion, commuting leads to gender inequality if women continue to commute less excessively than men (Statens bostadskreditnämnd, 2008).
8
2.4
Factors Affecting CommutingStated below are the factors affecting commuting that we found most prominent in previ-ous studies. As the main focus in this thesis is human capital, it is explained first.
Human Capital
Two of the main reasons for commuting to a workplace outside the place of residence are the urge to increase one's human capital and raise one's earnings (Wyly, 1998; Rouwendal & Nijkamp, 2004). Human capital is the amount of skills, knowledge, and abilities that determine an individual's labor productivity. The concept was developed to be able to explain and measure the value of knowledge (Becker, 1994). The level of human capital increases with the level of education and on-work training (Becker, 1994; Black, Hash-imzade & Myles, 2017).
Geographical movement for work is partly determined by its accessibility, meaning the potential of diverse opportunities for interaction. In general, accessibility is viewed as the effortlessness in which one can access economic activities from a location (Song, 1990). Multiple opportunities increase the possibilities of interaction across municipality bor-ders. The opportunity of employment at one point is determined by the summation of the accessibility to the municipalities surrounding this location. If surrounding areas have a lot of job opportunities, the accessibility of work will increase at our specific point (Han-sen, 1959).
The level of obtained education, meaning the level of human capital, differs across Swe-den. In more population dense areas, the education level is higher whereas it is lower in less population dense areas (Statistics Sweden, 2018). The concentration of human capital in denser cities affects the labor market, as it gives incentives to companies on where to locate. Because higher human capital increases productivity and specialization skilled la-bor, it attracts companies. Previously, it has been argued that human capital is also a local public good, as it comes with positive externalities for the society (Becker, 1994; Schultz, 1988). According to Schultz (1988), these externalities may include, but not be limited to, increase in the productivity of political and economic institutions.
For individuals, there are significant benefits of obtaining an education of higher level. The majority of people with a degree have higher incomes than those without a degree.
9
Education does not only have positive monetary effects on an individual's income, studies have also found that it leads to raised awareness of one's health. With the rapid techno-logical development in the 21st century, it is crucial to stay updated, leading to the im-portance of higher education and continuous training. (Becker, 1994). Whether educated or not, people who have started commuting usually have a higher salary than average, and this is especially true for women (Finansdepartementet, 2007).
Today, more women than men are educated in Sweden. It is especially evident in the ages 25 to 34, where more than one-third of women have studied for three or more years of postsecondary education. Comparing this to men in the same ages, only one-fifth have the same level of education (Statistics Sweden, 2018). Although women obtain higher education today to a larger extent, which should be correlated with them commuting more on average (Wyly, 1998), they commute less and shorter distances to work than men (Håkansson, 2010; Finansdepartementet, 2007).
Women have not always had the chance to obtain an education; it was not until 1927 that women got access to Sweden’s general curricula, including secondary and post-secondary education. Since then, there has been a shift in the distribution of those with higher edu-cation. In 1977, women reached the majority in enrollment in Swedish universities and colleges. Women have been in majority since then (Swedish Higher Education Authority, 2017). In conclusion, we expect that women’s commuting for work will be less affected by their level of human capital, although women obtain a higher level of human capital than men.
Amenities
Amenities are anything that brings individuals more quality of life. What one qualifies as amenities differs between individuals, although essential amenities, such as hot water and fresh air, are the same (Cambridge Dictionary, 2018). The quality of life is useful for firms to analyze when deciding where to locate, as amenities attract labor. Since this paper focuses on individuals’ choice of location, we will view amenities from individual’s point of view rather than firms’ point of view.
10
Where individuals choose to settle down is partly determined by their preference in ities. Glaeser, Kolko and Saiz (2001) argue that there are four categories of urban amen-ities. The first one is the existence of consumer goods and services, the second aesthetics and physical location, the third public services such as educational institutions, and the fourth, the ease which one can get to work and other services. In their study, they empha-size the role of the consumer demands in the society and the city as centers of consump-tion, rather than just production.
In Sweden, the access to nature, restaurants and public transportation systems are signif-icantly valued when families choose where to settle down. In addition, the access to school is relevant, and most municipalities have access to schooling from preschool to upper secondary school (SBAB, 2014). However, there are only 13 universities and 31 colleges in Sweden (Studera Vidare, 2018). As universities and colleges are big employ-ers, municipalities with these educational institutions should have higher levels of incom-ing commuters. Municipalities with universities should also expect the average level of education to be higher (Rauch, 1991), also indicating that the level of commuting should be higher in these municipalities.
The number of amenities in a municipality may lead to people settling down in a different municipality than the location of their work, leading to increased commuting over mu-nicipality borders (Finansdepartementet, 2007). According to Gil Solá (2013), amenities such as good schools and activities for children are more important to women than to men when choosing where to live. Women also prefer to work close to their children's school (Gil Solá, 2013). Therefore, we can expect that fewer women commute from a munici-pality with many amenities.
Job Opportunities
The growth of Sweden's economy has led to an increased demand for labor, and it is now at a relatively high level due to Sweden’s current prosperous economy. The demand for labor is the amount of employed and number of vacancies in relation to the total popula-tion (Arbetsförmedlingen, 2017). Vacancies are unoccupied posts that an employer aims to fill as soon as he or she finds an appropriate candidate (Black et al., 2017). The rate at which vacancies are filled is closely related to the commuting opportunities to access them. For vacancies to be filled, the worker must find a suitable place to live that is within
11
commuting distance. If the commuting distance is too extensive, the vacancies do not fill as quickly, as workers will look for job opportunities that are closer to their residence (Rouwendal & Nijkamp, 2004). We expect that a large amount of vacancies in a munici-pality will lead to less commuting from that municimunici-pality since it has more job opportu-nities.
According to Arbetsförmedlingen (2017), the efforts in improving the matching in the labor force differ immensely between municipalities. While some municipalities have well-established programs to match vacancies with the unemployed, others have less de-veloped programs (Arbetsförmedlingen, 2017). This can be verified further by studying the unemployment rates back in time. Such studies demonstrate that the regions which had a high unemployment rate in the 1980s are still suffering from it today (Finansdepar-tementet, 2007). For better matching to occur, it is crucial to adjust the education pro-grams to the employees' needs so that the job seeker can be more prepared for the future workplace. In larger cities and regions, where the population density is higher, the unem-ployment rate has decreased more than in smaller cities and regions. One explanation could be the service sector's recent growth, while another could be the differences in the efficiency in matching unemployed with vacancies. (Arbetsförmedlingen, 2017).
To gain a deeper understanding of the labor market it is important to analyze the urban structure of an economy. According to Brueckner (2011), economists claim that it is the concentrations of jobs that lead to denser areas of population since people locate close to their work. The spatial concentration of jobs is explained by two main things, agglomer-ation economies and scale economies. Agglomeragglomer-ation economy explains that companies benefit from locating close to other businesses and or in population dense areas. Scale economies are concentrated to specific business enterprises, meaning that an industry be-comes more effective if it is large in scales of operation. Thus, it is favorable to have large enterprises and concentration of employment (Brueckner, 2011). Nilsson (2011) enhance that, not all industries are suitable for all areas, some industries will only locate in large functional regions. This is one reason why companies locate in more dense areas, result-ing in fewer work opportunities in less dense areas and the effect might be that one has to commute to another municipality for work. Therefore, we expect that workers will commute in to a dense municipality to access more jobs.
12
As previously mentioned, women are more likely than men to work in the public sector (Arbetsgivarverket, 2018; Håkansson, 2010). Jobs in the public sector are usually at mu-nicipality level or county councils level, for example, school and healthcare. The private sector consists of companies that are privately owned, with profitability as one of their main objectives (Håkansson, 2010). However, there are privately-owned companies which are non-profitable as well. In the scope of this paper, the focus is on the profit organizations, as it is assumed that a higher wage often contributes to commuting. In Sweden, 29 percent of workers work in the public sector, while 71 percent work in the private sector (Arbetsgivarverket, 2018). Since women are more likely to work in the public sector, we expect that there will be fewer women commuting from a municipality with a high rate of jobs in the public sector.
Geographical Variation in Transportation Networks
Sweden’s population is distributed on a relatively large geographical area, and the density of municipalities differs greatly between the north and south of Sweden. Denser munici-palities usually have a higher number of vacancies, which makes it easier for people to find jobs, indicating that they have a large number of in-commuters (Statics Sweden, 2018). In addition, denser municipalities are in greater need of a well-functioning infra-structure, to obtain labor mobility. The capital, Stockholm, is one of the densest munici-palities in the country and has the largest amount of vacancies combined with the largest labor market in terms of workers and employers. Stockholm is therefore highly dependent on a well-functioning infrastructure (Sveriges Riksdag, 2018). Gothenburg and Malmö, Sweden's second and third largest cities are also population dense and depend on a func-tioning infrastructure (Statistics Sweden, 2018). Sweden’s infrastructure rates above av-erage compared to the other countries in the European Union (European Commission, 2018).
Although the infrastructure in Sweden is of relatively good quality, the development of new transportation systems is slow. Today, there is a conflict between making commuting easier through development in the infrastructure and Sweden's environmental targets. From the 1st of April 2018, Sweden has a new flight tax. The Government's goal is that airlines should bear more of its climate costs (Finansdepartementet, 2017). The result is that people feel more restricted to fly, especially affecting the population in the north of
13
Sweden, where distance is more extensive. The government-owned and controlled train operator SJ also follows the environmental targets. It aims to operate sustainably by tak-ing their responsibilities economically and socially (SJ, 2018). SJ desires that people will choose to take the train over flying, not only for SJ’s profits but also caring for the envi-ronment. As of today, taking the train is time-consuming and even more expensive than taking the plane. As mentioned earlier, the question whether or not commuting is good or bad is complex. The ambition of Sweden's infrastructure is to provide a system that is both environmentally friendly and socioeconomically beneficial (Regeringskansliet, 2018).
According to Gil Solá (2013), women are more dependent on a functioning public trans-portation system. An example of this is that in a situation where a family only has one car, men are more likely to use it. Overall men are given more opportunities to be mobile. To summarize this, we expect women to be more mobile in cities where there are well-developed public transportation systems.
14
3. Variables and Data
Based on the previous studies, we have decided to include eight independent variables, to be able to observe human capital’s impact on commuting patterns. While the majority of the data was collected from Statistics Sweden, the data of vacancies was gathered from the Swedish Public Employment Service and the data for amenities from Hui Research. All data was gathered for the year 2016 for all 290 municipalities in Sweden.
3.1
VariablesIn this section, we provide a short explanation of how we have constructed the varia-bles. An explanation of how the independent variables are expected to affect the de-pendent variable will follow.
The dependent variable
The data for the dependent variable was collected for both genders together, and sepa-rately for men and women. The Net share of outgoing commuters is computed by the following equation:
𝑁𝑁𝑁𝑁𝑁𝑁 𝑠𝑠ℎ𝑎𝑎𝑎𝑎𝑁𝑁 𝑜𝑜𝑜𝑜 𝑂𝑂𝑂𝑂𝑁𝑁𝑂𝑂𝑜𝑜𝑂𝑂𝑂𝑂𝑂𝑂 𝐶𝐶𝑜𝑜𝐶𝐶𝐶𝐶𝑂𝑂𝑁𝑁𝑁𝑁𝑎𝑎𝑠𝑠𝑖𝑖 =𝑂𝑂𝑂𝑂𝑂𝑂 𝐶𝐶𝐶𝐶𝐶𝐶𝑊𝑊𝐶𝐶𝑊𝑊𝑊𝑊 𝑃𝑃𝐶𝐶𝑃𝑃𝑖𝑖−𝐼𝐼𝐼𝐼 𝐶𝐶𝐶𝐶𝐶𝐶𝑖𝑖 𝑖𝑖 (1)
where Out Com is the number of workers commuting out from a municipality, In Com is the number of workers commuting in to a municipality and Work Pop is the people in working age, namely 25 to 69 years old, living in a municipality. Choosing this age group, we include people who have had the opportunity to obtain a post-secondary education for three years or more, and those who retire later than the legally established retirement age of 64. Workers who commute within a municipality are not taken into account.
A negative number implies that more workers are commuting in to than commuting out from a municipality. In contrast, a positive number indicates that more workers are com-muting out from than comcom-muting in to a municipality. The Net share of Outgoing
Com-muters is initially calculated for both women and men together, then separately, to be able
15
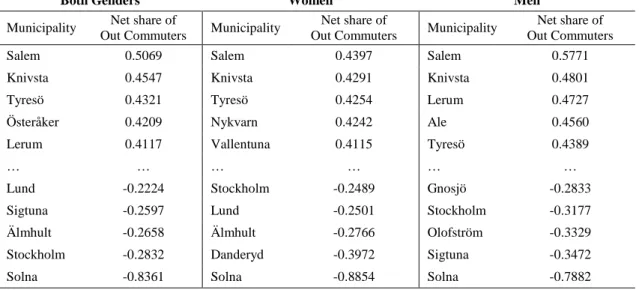
As expected, the values of the Net share of Outgoing Commuters differ significantly across municipalities. The great variation can be seen in Table 1.
Table 1. Highest and lowest Net share of Outgoing Commuters
Both Genders Women Men
Municipality Net share of
Out Commuters Municipality
Net share of
Out Commuters Municipality
Net share of Out Commuters
Salem 0.5069 Salem 0.4397 Salem 0.5771
Knivsta 0.4547 Knivsta 0.4291 Knivsta 0.4801
Tyresö 0.4321 Tyresö 0.4254 Lerum 0.4727
Österåker 0.4209 Nykvarn 0.4242 Ale 0.4560
Lerum 0.4117 Vallentuna 0.4115 Tyresö 0.4389
… … … …
Lund -0.2224 Stockholm -0.2489 Gnosjö -0.2833
Sigtuna -0.2597 Lund -0.2501 Stockholm -0.3177
Älmhult -0.2658 Älmhult -0.2766 Olofström -0.3329
Stockholm -0.2832 Danderyd -0.3972 Sigtuna -0.3472
Solna -0.8361 Solna -0.8854 Solna -0.7882
N=290
Source: Statistics Sweden (2018)
By observing the table, one can note that the municipalities with the highest values for
Net share of Outgoing Commuters are all located around Sweden’s two largest cities,
Stockholm and Gothenburg. As expected, the majority of the municipalities on the other side of the spectrum, with low values for Net share of Outgoing Commuters, are more densely populated areas. According to theory, this should be the case since workers in municipalities with lower density most often commute to municipalities with higher den-sity since companies often locate in denser areas, creating more jobs.
Some municipalities appearing in the table are surprising. Gnosjö, for instance, is not a population dense municipality and appear as one of the lowest values for men, meaning that it has considerably more in-commuters than out-commuters. This can be explained by Gnosjö being one of Sweden’s most industrialized municipalities with companies such as Thule Group and Garo AB, attracting more men (Gnosjö kommun, 2018). For all three categories, both genders, women and men, Solna takes on extreme negative values, indi-cating that there is substantially more in-commuters than out-commuters. Therefore, we will run a regression without Solna to see if the extreme value effects our results.
16
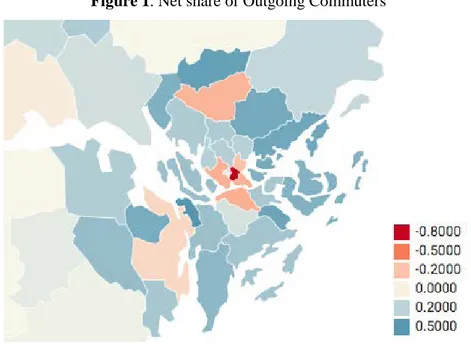
Figure 1. Net share of Outgoing Commuters
Source: Statistics Sweden (2018)
To give a visual example, figure 1 provides an overview of the Net share of Outgoing
Commuters in and around the area of Stockholm. The municipalities surrounding
Stock-holm have some of the highest values for Net share of Outgoing Commuters. Meaning that there are a lot of people commuting for work in another municipality in this region. The dark red area is our outlier Solna, which has the most significant share of in-com-muters in relation to out-comin-com-muters. Some reasons for the extreme value of Solna are the geographical location, the urban structure and the wide range of public transportation systems, making it an attractive location for companies (Solna stad, 2018). Hence, the negative extreme value of Net share of Outgoing Commuters is not surprising, as people commute towards work opportunities.
17
Independent Variables
Human Capital Share
The following equation determines the human capital share in a municipality:
𝐻𝐻𝑂𝑂𝐶𝐶𝑎𝑎𝑂𝑂 𝐶𝐶𝑎𝑎𝐶𝐶𝑂𝑂𝑁𝑁𝑎𝑎𝐶𝐶 𝑆𝑆ℎ𝑎𝑎𝑎𝑎𝑁𝑁𝑖𝑖=𝑊𝑊𝐶𝐶𝑊𝑊𝑊𝑊 𝑃𝑃𝐶𝐶𝑃𝑃𝐻𝐻𝑂𝑂𝐶𝐶 𝐶𝐶𝐶𝐶𝑃𝑃𝑖𝑖𝑖𝑖 (2)
where Hum Capi is the number of people having three or more years of postsecondary education in a municipality. We expect that the net share of outgoing commuters will be higher if a municipality has a relatively high human capital share. This is based on previ-ously mentioned studies that suggest that high human capital increases the possibilities of obtaining a higher wage and being more mobile, i.e. commute more. Earning more can also give workers the possibility to move closer to the workplace rather than commuting. However, we base our interpretation on previous studies suggesting that people with higher wages commute more.
Vacancy Share
The share of vacancies in a municipality is described as follows:
𝑉𝑉𝑎𝑎𝑉𝑉𝑎𝑎𝑂𝑂𝑉𝑉𝑉𝑉 𝑠𝑠ℎ𝑎𝑎𝑎𝑎𝑁𝑁𝑖𝑖=𝑊𝑊𝐶𝐶𝑊𝑊𝑊𝑊 𝑃𝑃𝐶𝐶𝑃𝑃𝑉𝑉𝐶𝐶𝑉𝑉𝑖𝑖 𝑖𝑖 (3)
where Vaci is the number of new vacancies during the year in a municipality. We expect that the net share of outgoing commuters will be lower if a municipality has a relatively high vacancy share.
Share of Jobs in the Public Sector
The share of jobs in the public sector in a municipality is described as follows:
𝑆𝑆ℎ𝑎𝑎𝑎𝑎𝑁𝑁 𝑜𝑜𝑜𝑜 𝐽𝐽𝑜𝑜𝐽𝐽𝑠𝑠 𝑂𝑂𝑂𝑂 𝑁𝑁ℎ𝑁𝑁 𝑃𝑃𝑂𝑂𝐽𝐽𝐶𝐶𝑂𝑂𝑉𝑉 𝑠𝑠𝑁𝑁𝑉𝑉𝑁𝑁𝑜𝑜𝑎𝑎𝑖𝑖= 𝑃𝑃𝑂𝑂𝑃𝑃 𝐽𝐽𝐶𝐶𝑃𝑃𝐽𝐽𝑇𝑇𝐶𝐶𝑂𝑂 𝐽𝐽𝐶𝐶𝑃𝑃𝐽𝐽𝑖𝑖𝑖𝑖 (4)
where Pub Jobsi indicates the amount of jobs in the public sector in a municipality and
Tot Jobsi indicates the amount of total jobs in a municipality. Given the data we have access to, we can observe the number of workers employed in each sector which gives us an indication of the number of jobs in each sector. We expect that the net share of out-going commuters will be lower if a municipality has a relatively high share of jobs in the public sector, since the majority of jobs in the public sector locate in the municipality.
18 Average Wage Index
The average wage in a municipality is earned by those who work in that specific munici-pality and not necessarily by those who live there. Given the data we have access to, the following index is constructed to give us a normalized indication of the average wage level in each municipality. The wage index is constructed as follows:
𝐴𝐴𝐴𝐴𝑁𝑁𝑎𝑎𝑎𝑎𝑂𝑂𝑁𝑁 𝑊𝑊𝑎𝑎𝑂𝑂𝑁𝑁 𝑂𝑂𝑂𝑂𝑖𝑖𝑁𝑁𝑖𝑖𝑖𝑖 = 1 𝐴𝐴𝐴𝐴 𝑊𝑊𝐶𝐶𝑊𝑊𝑊𝑊𝑖𝑖 289(∑𝑗𝑗≠𝑖𝑖 𝐴𝐴𝐴𝐴 𝑊𝑊𝐶𝐶𝑊𝑊𝑊𝑊𝑗𝑗)
(5)
where Av Wagei is the average wage in municipalityi and Av Wagej is the average wage in municipality j, in thousands of SEK. We expect that the net share of outgoing commut-ers will be higher if a municipality has a high wage index since, according to previous studies, people who have a higher wage commute more. Our interpretation of this is that a municipality with a high Average Wage index also reflects the type of residents there are in the municipality, i.e if a municipality has a high Average Wage index there should be residents with higher wages as well. Therefore, we expect that workers in these mu-nicipalities will commute more.
Population Density
The population density is measuring the number of individuals per square kilometer living in a municipality. We expect that the net share of outgoing commuters will be lower if a municipality has a relatively high population density since there are more work opportu-nities in a dense municipality.
Amenities Dummy
The dummy variable ‘Amenities’ states if a municipality has a city center1 or not. A city center indicates that there is a high level of cultural amenities, such as restaurants, theatres and sports facilities. If the municipality has a city center, the dummy will take on value one, and zero if not. We expect that the net share of outgoing commuters will be lower if a municipality has a city center, since people who value amenities want to work close to home.
1 According to Hui Research, when determining if a municipality has a city center, a generalized assumption
19 University Dummy
The dummy variable ‘University’ states if a municipality has a university or not. We have included both universities and colleges in the university dummy. The variable will be one if the municipality has at least one university, and zero if it does not. We expect that the net share of outgoing commuters will be lower if a municipality takes on value one be-cause a university is a large employer.
Largest Cities Dummy
The dummy variable ‘Largest Cities Dummy’ is created to control for the potential ex-treme values that the three largest cities in Sweden may show. Stockholm, Gothenburg and Malmö take on value one and the rest take on value zero. We expect that the net share of outgoing commuters will be lower in Stockholm, Gothenburg and Malmö as many companies are located in these municipalities.
3.2
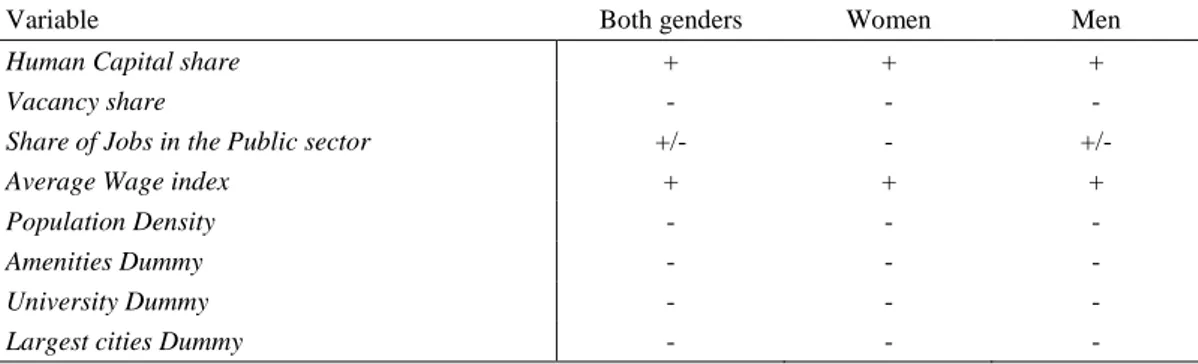
Expected signsThe following table is constructed to clarify the results we expect to see. We expect that most variables should have the same signs for both women and men. The one that we are uncertain about is the variable Share of Jobs in the Public Sector. Statistics and previous research show that women are more likely to work in the public sector, and these jobs are most often located in the municipality. When the share of public jobs in relation to private jobs is larger in a municipality, more women will stay within that municipality and fewer will commute out from it. Therefore, the Share of Jobs in the Public sector should have a negative effect on women’s Net share of Outgoing Commuters. We are uncertain of the effect Share of Jobs in the Public Sector has on men’s Net Share of Outgoing commuters since we have not found any study on this.
Table 2. Expected signs
Variable Both genders Women Men
Human Capital share + + +
Vacancy share - - -
Share of Jobs in the Public sector +/- - +/-
Average Wage index + + +
Population Density - - -
Amenities Dummy - - -
University Dummy - - -
20
Although we expect the same signs for human capital across genders, we predict that it will have a smaller effect on the commuting for women than on the commuting for men. As more women than men are educated, i.e. have higher human capital, one could expect that an increase of Human Capital share in a municipality should lead to a higher effect on women’s Net share of Outgoing Commuters than for men’s. However, this contradicts with previous studies, as mentioned earlier. Women commute less than men even though they have higher human capital and some reasons may be that women take jobs in the public sector and that they take on more household responsibilities. Therefore, it is diffi-cult to determine which factors affect women’s commuting the most, higher education or sociological factors. We base our expected sign regarding human capital from previous studies suggesting that women commute less despite the level of human capital. The in-terpretation of this is that increasing the level of human capital affects women’s out-com-muting less than men’s.
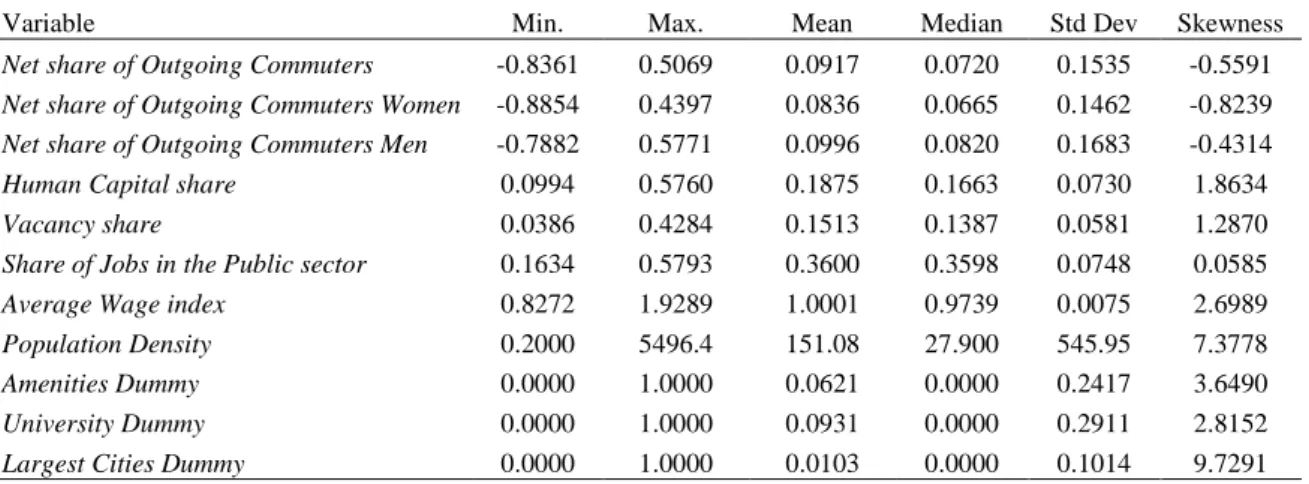
3.3
Descriptive StatisticsAs previously mentioned, the data shows a wide range between minimum and maximum values, see Table 1, meaning that there is a great variation between municipalities in Swe-den. Out of the 290 municipalities, 216 municipalities had positive values for the Net
share of Outgoing Commuters Women and 217 for the Net share of Outgoing Commuters Men. This indicates that the majority of municipalities have a larger number of
out-com-muters than in-comout-com-muters, which corresponds with the positive median value.
Table 3. Descriptive statistics
Variable Min. Max. Mean Median Std Dev Skewness
Net share of Outgoing Commuters -0.8361 0.5069 0.0917 0.0720 0.1535 -0.5591 Net share of Outgoing Commuters Women -0.8854 0.4397 0.0836 0.0665 0.1462 -0.8239 Net share of Outgoing Commuters Men -0.7882 0.5771 0.0996 0.0820 0.1683 -0.4314
Human Capital share 0.0994 0.5760 0.1875 0.1663 0.0730 1.8634
Vacancy share 0.0386 0.4284 0.1513 0.1387 0.0581 1.2870
Share of Jobs in the Public sector 0.1634 0.5793 0.3600 0.3598 0.0748 0.0585
Average Wage index 0.8272 1.9289 1.0001 0.9739 0.0075 2.6989
Population Density 0.2000 5496.4 151.08 27.900 545.95 7.3778
Amenities Dummy 0.0000 1.0000 0.0621 0.0000 0.2417 3.6490
University Dummy 0.0000 1.0000 0.0931 0.0000 0.2911 2.8152
Largest Cities Dummy 0.0000 1.0000 0.0103 0.0000 0.1014 9.7291
N=290
21
By observing the table, one can see that the Net share of Outgoing Commuters differs between women and men. Women have a lower value than men, which is supported by previous studies that women commute less than men. For all three categories, the mini-mum value for Net share of Outgoing Commuters lies far from the mean. These outliers are values for the municipality Solna, seen in table 1.
The minimum and maximum values for Human Capital share lie rather far away from the mean value, which indicates that there is a wide range in the level of human capital across municipalities. This indicates that people with the same level of human capital locate in the same municipalities. Danderyd has the highest value (0.5760) of Human
Capital share, while Eda has the lowest value (0.0994). According to theory, individuals
with higher human capital often locate in denser municipalities. This is confirmed when looking at Danderyd which has a density of 1,236 people per square kilometer and Eda which only has 10.
Notably, the maximum value of Vacancy share, is Stockholm. As it is the capital and also the second densest municipality in Sweden, it contains a great amount of employers and there is a lot of mobility in the labor force, hence the value is expected. The observations for the variable Share of Jobs in the Public sector show quite large variations, ranging from 0.1634 to 0.5793. The extremes of the Average Wage index, 0.8272 and 1.9289, display the varying wages across Sweden. Danderyd has the highest value of the index and Borgholm the lowest.
The substantial variation between minimum and maximum in Population Density illus-trates Sweden’s unequally distributed population. The densest municipality Sundbyberg has the number 5,496, indicating that there are 5,496 people per square kilometer and the least dense municipality is Arjeplog with a number of 0.200 meaning that there is just one person per five square kilometers. As the variable is so skewed, we log the variable when running the regressions, to get values that are closer to a normal distribution.
When observing the mean value for our dummies, we can see that the number of munic-ipalities that contains our dummy variable are quite few. The Amenities Dummy shows that out of all 290 municipalities only six percent were considered to have a city center in 2016, the measuring of city centers are constantly changing according to Hui Research (2018) and this might explain the relatively low percentage. By looking at the University
22
Dummy, only approximately nine percent have at least one university or college. The low
number might seem odd, one has to consider that for example, Stockholm has several universities and colleges. As the last dummy, Largest Cities Dummy, takes on value 1 for only the three largest cities in Sweden, the mean value is very low, as expected.
3.4
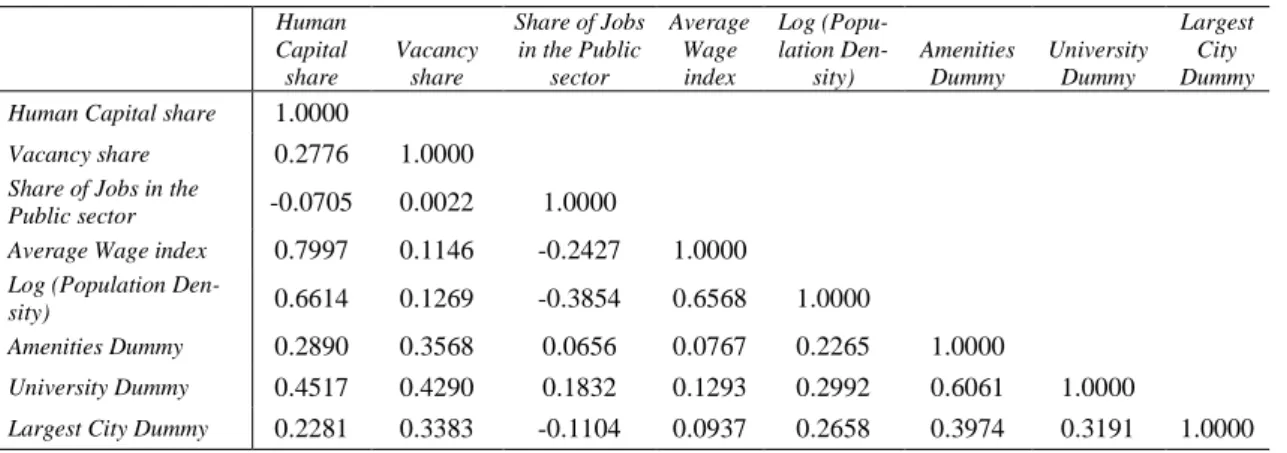
Correlation AnalysisThe computed correlation matrix provides an overview of the correlation between our independent variables. Several of the variables are correlated, however, none of them are perfectly correlated.
Table 3. Correlation matrix of the Independent Variables
Human Capital share Vacancy share Share of Jobs in the Public sector Average Wage index Log (Popu-lation Den-sity) Amenities Dummy University Dummy Largest City Dummy Human Capital share 1.0000
Vacancy share 0.2776 1.0000
Share of Jobs in the
Public sector -0.0705 0.0022 1.0000
Average Wage index 0.7997 0.1146 -0.2427 1.0000
Log (Population
Den-sity) 0.6614 0.1269 -0.3854 0.6568 1.0000
Amenities Dummy 0.2890 0.3568 0.0656 0.0767 0.2265 1.0000
University Dummy 0.4517 0.4290 0.1832 0.1293 0.2992 0.6061 1.0000
Largest City Dummy 0.2281 0.3383 -0.1104 0.0937 0.2658 0.3974 0.3191 1.0000 N=290
Source: Statistics Sweden (2018), Swedish Public Employment Service (2018) and Hui Research (2018).
Both the Average Wage index and the Population Density variables are correlated with the variable Human Capital share. The most substantial correlation can be found between
Human Capital share and Average Wage index, a positive correlation of 0.7997, meaning
that if Human Capital share increases by one unit the Average Wage index increases by 0.7997. As previous studies suggest, individuals with higher human capital often earn more and individuals with higher human capital often live in areas that are denser. Fur-ther, Average wage index correlates, by 0.6568, with Population Density, which is ex-pected since higher paid jobs often are located in more dense cities. Since there is a high correlation between these three variables, a regression excluding two of the variables,
Average Wage index and the Population Density, will be run to minimize the risk of
mul-ticollinearity and having biased estimators. By keeping the variable Human Capital
share, we should get relevant results since this variable to some extent also captures
23
As predicted, the University Dummy and the Amenities Dummy are correlated. The
Amen-ities Dummy is determined by which municipalAmen-ities are considered to have a city center,
and universities generally locate in city centers. Although correlated by 0.6061, we choose to keep these variables because they capture different things that might explain commuting.
24
4. Empirical Model and Results
We have collected secondary data for all of our variables from 2016 for all Swedish mu-nicipalities. To determine if there is a difference between women and men we have con-structed a model which we first run for both genders, and secondly, for women and men separately. Observing one year across municipalities gives us cross-sectional data.
4.1
Econometric ModelThe independent variable has a linear relationship to the dependent variable when plotting the data in a scatterplot, which is why we find the ordinary least square (OLS) appropriate. Further, seen in the appendix, our residuals have a bell-shaped distribution. The first ver-sion of our OLS regresver-sion is constructed as follows:
𝑁𝑁𝑁𝑁𝑁𝑁 𝑠𝑠ℎ𝑎𝑎𝑎𝑎𝑁𝑁 𝑜𝑜𝑜𝑜 𝑂𝑂𝑂𝑂𝑁𝑁𝑂𝑂𝑜𝑜𝑂𝑂𝑂𝑂𝑂𝑂 𝐶𝐶𝑜𝑜𝐶𝐶𝐶𝐶𝑂𝑂𝑁𝑁𝑁𝑁𝑎𝑎𝑠𝑠𝑖𝑖= 𝛼𝛼0+ 𝛽𝛽1(𝐻𝐻𝑂𝑂𝐶𝐶𝑎𝑎𝑂𝑂 𝐶𝐶𝑎𝑎𝐶𝐶𝑂𝑂𝑁𝑁𝑎𝑎𝐶𝐶)𝑖𝑖+
𝛽𝛽2(𝑉𝑉𝑎𝑎𝑉𝑉𝑎𝑎𝑂𝑂𝑉𝑉𝑉𝑉)𝑖𝑖+ 𝛽𝛽3( 𝑃𝑃𝑂𝑂𝐽𝐽𝐶𝐶𝑂𝑂𝑉𝑉 𝐽𝐽𝑜𝑜𝐽𝐽𝑠𝑠)𝑖𝑖+ 𝛽𝛽4(𝑊𝑊𝑎𝑎𝑂𝑂𝑁𝑁)𝑖𝑖+ 𝛽𝛽5𝐶𝐶𝑂𝑂(𝑃𝑃𝑜𝑜𝐶𝐶𝑂𝑂𝐶𝐶𝑎𝑎𝑁𝑁𝑂𝑂𝑜𝑜𝑂𝑂 𝐷𝐷𝑁𝑁𝑂𝑂𝑠𝑠𝑂𝑂𝑁𝑁𝑉𝑉)𝑖𝑖+
∝1(𝐴𝐴𝐶𝐶𝑁𝑁𝑂𝑂𝑂𝑂𝑁𝑁𝑂𝑂𝑁𝑁𝑠𝑠)𝑖𝑖+∝2(𝑈𝑈𝑂𝑂𝑂𝑂𝐴𝐴𝑁𝑁𝑎𝑎𝑠𝑠𝑂𝑂𝑁𝑁𝑉𝑉)𝑖𝑖+∝3 (𝐿𝐿𝑎𝑎𝑎𝑎𝑂𝑂𝑁𝑁𝑠𝑠𝑁𝑁 𝐶𝐶𝑂𝑂𝑁𝑁𝑂𝑂𝑁𝑁𝑠𝑠)𝑖𝑖+ε𝑖𝑖 (6)
The second version is constructed to avoid multicollinearity. This is done by excluding two of the three highly correlated variables, Average Wage index and the Population
Den-sity.
𝑁𝑁𝑁𝑁𝑁𝑁 𝑠𝑠ℎ𝑎𝑎𝑎𝑎𝑁𝑁 𝑜𝑜𝑜𝑜 𝑂𝑂𝑂𝑂𝑁𝑁𝑂𝑂𝑜𝑜𝑂𝑂𝑂𝑂𝑂𝑂 𝐶𝐶𝑜𝑜𝐶𝐶𝐶𝐶𝑂𝑂𝑁𝑁𝑁𝑁𝑎𝑎𝑠𝑠𝑖𝑖= 𝛼𝛼0+ 𝛽𝛽1(𝐻𝐻𝑂𝑂𝐶𝐶𝑎𝑎𝑂𝑂 𝐶𝐶𝑎𝑎𝐶𝐶𝑂𝑂𝑁𝑁𝑎𝑎𝐶𝐶)𝑖𝑖+
𝛽𝛽2(𝑉𝑉𝑎𝑎𝑉𝑉𝑎𝑎𝑂𝑂𝑉𝑉𝑉𝑉)𝑖𝑖+ 𝛽𝛽3( 𝑃𝑃𝑂𝑂𝐽𝐽𝐶𝐶𝑂𝑂𝑉𝑉 𝐽𝐽𝑜𝑜𝐽𝐽𝑠𝑠)𝑖𝑖+∝1(𝐴𝐴𝐶𝐶𝑁𝑁𝑂𝑂𝑂𝑂𝑁𝑁𝑂𝑂𝑁𝑁𝑠𝑠)𝑖𝑖+∝2(𝑈𝑈𝑂𝑂𝑂𝑂𝐴𝐴𝑁𝑁𝑎𝑎𝑠𝑠𝑂𝑂𝑁𝑁𝑉𝑉)𝑖𝑖+
∝3 (𝐿𝐿𝑎𝑎𝑎𝑎𝑂𝑂𝑁𝑁𝑠𝑠𝑁𝑁 𝐶𝐶𝑂𝑂𝑁𝑁𝑂𝑂𝑁𝑁𝑠𝑠)𝑖𝑖+ε𝑖𝑖 (7)
4.2
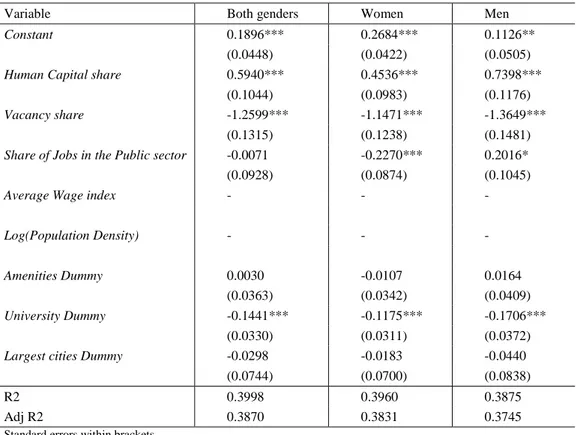
Regression AnalysisThe following tables show the results obtained from the different OLS regressions. In Table 3, all municipalities are included as well as all variables. In Table 4 all municipal-ities are included, and the variables Average Wage index and Population density are ex-cluded. The regression without the outlier Solna is discussed in section 4.2.3 and the ta-bles are provided in the appendix. Variance inflation factor is also tested for and provided in the appendix.
25
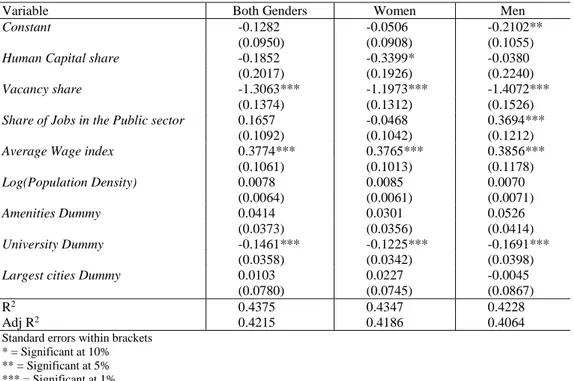
Initial Regression
We examine the Net share of Outgoing Commuters, by running equation 6, including all municipalities and all independent variables. As the correlated variables are included as well, we get several coefficient estimates which are not significant which can be seen in Table 3.
Table 3. Regression equations
Variable Both Genders Women Men
Constant -0.1282 -0.0506 -0.2102**
(0.0950) (0.0908) (0.1055)
Human Capital share -0.1852 -0.3399* -0.0380
(0.2017) (0.1926) (0.2240)
Vacancy share -1.3063*** -1.1973*** -1.4072***
(0.1374) (0.1312) (0.1526)
Share of Jobs in the Public sector 0.1657 -0.0468 0.3694***
(0.1092) (0.1042) (0.1212)
Average Wage index 0.3774*** 0.3765*** 0.3856***
(0.1061) (0.1013) (0.1178) Log(Population Density) 0.0078 0.0085 0.0070 (0.0064) (0.0061) (0.0071) Amenities Dummy 0.0414 0.0301 0.0526 (0.0373) (0.0356) (0.0414) University Dummy -0.1461*** -0.1225*** -0.1691*** (0.0358) (0.0342) (0.0398)
Largest cities Dummy 0.0103 0.0227 -0.0045
(0.0780) (0.0745) (0.0867)
R2 0.4375 0.4347 0.4228
Adj R2 0.4215 0.4186 0.4064
Standard errors within brackets * = Significant at 10% ** = Significant at 5% *** = Significant at 1% N=290
Source: Statistics Sweden (2018), Swedish Public Employment Service (2018) and Hui Research (2018)
For the initial regression, the coefficient estimates that are significant at a one percent significance level for both genders are Vacancy share, Average Wage Index and the
Uni-versity Dummy. This also holds for the regressions for women and men separately. The
coefficient estimate for the variable Human Capital share is only significant for women, and merely at a ten percent level. Also it shows a negative sign which was not expected. The insignificance of the variable increases the risk of accepting a result that is not true. In our case, stating that Human Capital share impacts Net share of Outgoing Commuters negatively might not be true. Although the signs are as expected for the coefficient esti-mates of Share of Jobs in the Public sector, they are only significant for men. One reason for the insignificance could be the high correlation between some independent variables.
26
By examining the coefficient estimates that are significant, one can note that the results are in line with the expected signs stated previously. However, the Human Capital share coefficient estimate for women shows the opposite sign. As it is only significant at the ten percent level, we cannot entirely rely on the result.
The coefficient estimates for Vacancy share are -1.1973 for women and -1.4072 for men. Thus, women’s Net share of Outgoing Commuters is affected less than men’s. One can conclude that municipalities with a higher Vacancy share, have a lower Net share of
Out-going Commuters, i.e., a higher rate of in-commuters. Further, the coefficient estimates
for Average wage index is 0.3765 for women and 0.3856 for men. Hence, where the
Av-erage wage index is higher, the Net share of Outgoing Commuters is higher. The values
for the University Dummy are -0.1225 for women and -0.1691 for men. A negative value indicates that municipalities with universities have fewer out-commuters and more in-commuters.
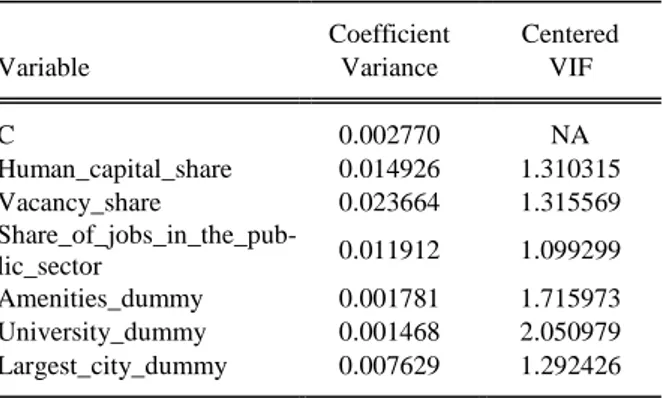
The R2 has a value of approximately 0.4 for all three categories, which indicates that the independent variables explain about 40 percent of the variations in the dependent varia-ble. Further, when testing for multicollinearity, we obtain Variance Inflation Factors (VIF) values lower than five for all variables (see table 1 in the appendix). Although relatively low values of VIF, we still have quite high correlation between Average Wage
27
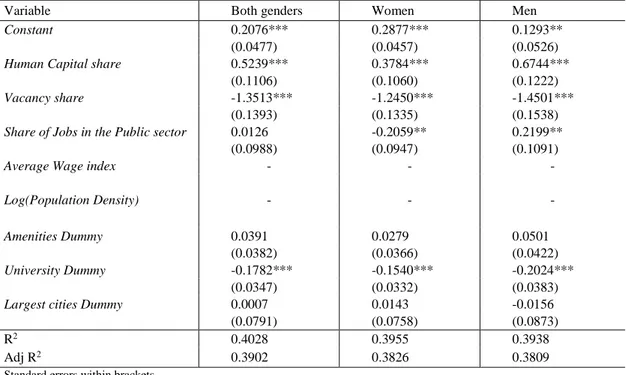
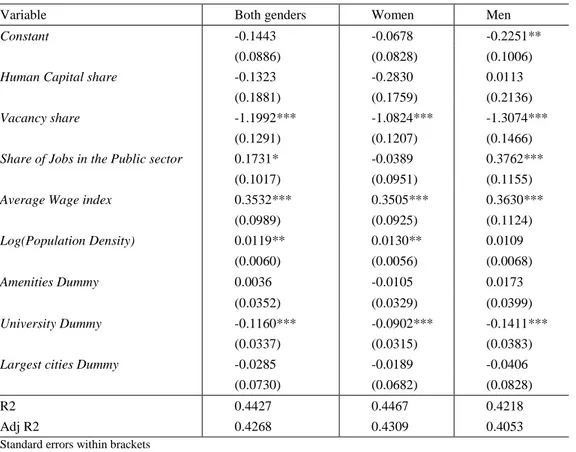
Regression Excluding Highly Correlated Variables
To obtain correct estimates, we run the regression for equation 7, excluding the two highly correlated variables, Average Wage index and the Population Density. We receive more significant coefficient estimates, as can be seen in Table 4, and therefore this is our pre-ferred regression equation.
Table 4. Regression Equations
Variable Both genders Women Men
Constant 0.2076*** 0.2877*** 0.1293**
(0.0477) (0.0457) (0.0526)
Human Capital share 0.5239*** 0.3784*** 0.6744***
(0.1106) (0.1060) (0.1222)
Vacancy share -1.3513*** -1.2450*** -1.4501***
(0.1393) (0.1335) (0.1538)
Share of Jobs in the Public sector 0.0126 -0.2059** 0.2199**
(0.0988) (0.0947) (0.1091)
Average Wage index - - -
Log(Population Density) - - - Amenities Dummy 0.0391 0.0279 0.0501 (0.0382) (0.0366) (0.0422) University Dummy -0.1782*** -0.1540*** -0.2024*** (0.0347) (0.0332) (0.0383)
Largest cities Dummy 0.0007 0.0143 -0.0156
(0.0791) (0.0758) (0.0873)
R2 0.4028 0.3955 0.3938
Adj R2 0.3902 0.3826 0.3809
Standard errors within brackets * = Significant at 10% ** = Significant at 5% *** = Significant at 1% N=290
Source: Statistics Sweden (2018), Swedish Public Employment Service (2018) and Hui Research (2018)
The coefficient estimates for the variables Human Capital share, Vacancy share and
Uni-versity Dummy are significant at a one percent significance level for all three categories.
The Share of Jobs in the Public sector is not significant for the regression for both gen-ders, but for women and men separately, they are significant at the five percent level. By examining the coefficient estimates that are significant, we can conclude that all signs are as previously predicted. Also, as we expected, the level of Human Capital share affects men's commuting behavior more heavily than women's.
The coefficient estimates for Human Capital share are 0.3784 for women and 0.6744 for men. Thus, municipalities with higher levels of Human Capital share have a higher Net
28
(2010), which stated that increased commuting is related to higher levels of human capi-tal. Our result for women contradicts the study by Olsson (2002), who claimed that the level of human capital does not have a significant impact on increasing women’s com-muting. For men, however, our results are in line with Olsson’s, who stated that there is a positive relation between men’s amount of commuting and level of higher education. Despite excluding Average Wage index and Population Density, the variable Human
Cap-ital share still captures the wages and density of a municipality to some extent. In addition Human Capital share captures the level of education, which affect commuting.
Further, the coefficient estimates for Vacancy share are -1.2450 for women and -1.4501 for men. Municipalities with higher Vacancy share have a lower Net share of Outgoing
Commuters. For the variable Share of Jobs in the Public sector, there are reverse signs
for women and men, as predicted. For Share of Jobs in the Public sector, the coefficient estimates are -0.2059 for women and 0.2199 for men. Hence, it has a negative effect on the Net share of Outgoing Commuters for women while it has a positive effect for men. As stated by Arbetsgivarverket (2018) and Håkansson (2010), women are more likely to work in the public sector. If a municipality has a lot of jobs in the public sector women’s work opportunities in that municipality are greater. This results in women not having to commute from the municipality and women’s Net share of Outgoing Commuters decreas-ing. We have not found any research on the effect the Share of Jobs in the Public sector has on men’s commuting, making it difficult for us to draw a conclusion based on theory regarding the positive sign. However, based on equation 4, if the amount of jobs in the public sector is larger than the amount of jobs in the private sector in a municipality, we believe that men might look for jobs in other municipalities, as men work in the private sector to a larger extent. The coefficients of the University Dummy show that a munici-pality with a university has a lower Net share of Outgoing Commuters. Women are less impacted, -0.1540, than men, -0.2024.
The R2s have slightly lower values compared to the initial regression, still around or just below 0.4. The reason for obtaining a lower R2 is that excluding two variables leads to a smaller part of our dependent variable being explained. Since we obtained three variables that where highly correlated we choose to keep one, Human Capital because it still cap-tures most of the feacap-tures from the excluded variables and it is the variable of interest.
29
When testing for multicollinearity, we get VIF values below 2.5 (see table 2 in the appen-dix) for all variables. This is lower than in the initial model, i.e. lower risk of obtaining multicollinearity.
Robustness check
As mentioned previously, we also run equation 6 and 7 excluding the outlier Solna. The reasoning behind this is that an outlier affects the mean value and the standard deviation, and thus may give unreliable results.
The results can be seen in table 3 and 4 in the appendix. There is a slight increase in R2 in equation 6 compared to the initial regression including Solna. The other values are rather similar to the results ran for both equation 6 and 7. Therefore, we conclude that the extreme value of Solna does not affect our result significantly and therefore we choose to not exclude Solna in our regressions.
We found that when running equation 6, excluding our most correlated variables, Average
Wage Index and Population Density, we obtain the most accurate result. Although
some-what lower values of R2,we prefer this model since we attain more coefficient estimates that are significant.
Our choice of model, ordinary least square, seem to fit our collected data. The values for R2 seems reasonable given the parameters we have included. Expecting that our model could explain more than approximately 40 percent would be surprising since we have aggregate data at a municipality level rather than individual data. To see if our R2 is reli-able we conducted a Wald-Test to obtain F-statistics, which showed a probability of zero, indicating that our R2 is reliable and that our independent variables do not have betas of zero. By choosing to include all municipalities and obtaining cross-sectional data we can see patterns for all of Sweden.
30
5. Conclusion
The main purpose of the thesis was to answer the question “Does the level of human
capital in a municipality affect the commuting for work over the municipality border of women and men in the same way?”
According to Wyly (1998), Sanchez & Gonzalez (2016) and Håkansson (2010), there is a difference in commuting behaviors between women and men. Previous studies regard-ing human capital’s effect on commutregard-ing are contradictive. While Olsson (2002) states that there is no clear relationship for women obtaining a higher education and increased commuting distance, Wyly (1998) states that women obtaining a higher education com-mutes longer distances. The geographical aspects and urban structure are important to analyze when studying commuting behavior since people often commute towards job op-portunities that often are located in denser areas (Statistics Sweden, 2018). Knowing that the population of Sweden is not normally distributed we expected to see different com-muting patterns across the country. Since most of the densest cities are located in the south of Sweden we expected more people to commute over municipality borders there. By analyzing our dependent variable, we saw that this was true. Also, the theory states that the level of human capital is higher in denser municipalities (Statistics Sweden, 2018), which also indicates a higher number of in-commuters as that is where the jobs are located.
The results of our regression show that there is a positive relationship between Human
Capital share and Net share of Outgoing Commuters. There is a slight difference in
hu-man capital’s effect on commuting patterns between women and men. The level of huhu-man capital in a municipality affects the men’s net share of out-commuting more heavily than the women’s. Even though women in Sweden have a higher share of human capital on average, women still commute less. According to White (1977) and Turner and Neimeier (1997), the reason for this might be the sociological differences, with women continuing to take more responsibilities in the household. Gender equality is an emerging subject, and Sweden is rated a fifth place (Swedish Institute, 2018) in politics, economics, health and education, but Sweden has still not managed to obtain gender equality. We expected to see a difference in the effect from Share of Jobs in the Public sector for women and men, however, we were surprised that the difference was as substantial. Sweden has come
31
a long way regarding gender equality, but there are still differences. When analyzing our data, we can see that women earn less and commute less although obtaining higher human capital. To reach gender equality we believe that there has to be regulations controlling for inequalities in the workplace, which should be combined with regulations that encour-age both genders to take on equal responsibility in the household, for example splitting the parental leave.
Despite observing clear differences, it is difficult to determine why these differences ex-ist. The main limitation in our study is that we do not have individual data, thus individual preferences are not included in this paper, nor is their marital status or if they have chil-dren or not, which might impact the commuting over municipality borders. If we did not have a limited amount of time writing this thesis, we would have liked to come up with variables that measure sociological differences between women and men on a municipal level. These variables might include parameters such as parental-leave, number of house-holds and amount of children, sick-leave and the amount of full-time workers. Further-more, when considering parental-leave for instance, it is important to be aware of that the counties might have different regulations, which impacts the results.
Women and men invest in human capital differently in terms of education, which is not taken into account in this study. More women obtain post-secondary education, however, the fields that women choose to study in differs from men (Swedish Higher Education Authority, 2016). The choice of education leads to different occupations, which is one of the explanations for wage differences and commuting patterns. By only measuring human capital in terms of people who obtain three years or more of postsecondary education, we omit factors that might give us a more accurate and extensive explanation of human cap-ital’s effect on net share of outgoing commuters. Variables that could have been included to explain the human capital level even more is years of employment, years in vocational universities and the amount of an individual’s certifications. Despite not investigating the fields of education, individuals who have a higher level of education tend to be more well-informed regarding health, politics, social science and culture. This could make them more open to changes, and they strive to obtain knowledge and work experience to a larger extent, leading them to be less resistant to commute.