J
Ö N K Ö P I NI
N T E R N A T I O N A LB
U S I N E S SS
C H O O L JÖNKÖPING UNIVERSITYSERVICE QUALITY IN
HIGHER EDUCATION
An Empirical Study at the Jönköping International Business School
Master thesis in Business Administration Authors: Martin Gustafsson Johan Larsson Supervisor: Per Davidsson Jönköping September 1997
Abstract
Problem: There is a lack of adequate models for measuring service quality in gen-eral as well as for the topical service area, higher education. With higher education we refer to education at university colleges and universities.
Purpose: The purpose of this thesis is to develop a model to asses perceived ser-vice quality in higher education. The model will be based on the serser-vice quality frame-works and formed through an empirical study on students at JIBS.
Method: We have used a quantitative approach in our collection of empirical data. The investigation is carried out as a survey on students at JIBS, students that were se-lected through a convenience sampling procedure. We based the design of the survey questionnaire on the service quality framework. The analysis has been carried out in three steps. First we ran a factor analysis (rotated Varimax) and extracted factors that we tested in a reliability test (Cronbach’s Alpha). The created factors were then used in the second step that was a regression analysis in which they served as independent vari-ables with a quality index as the dependent variable. Our last step of the analysis was to investigate if there were any differences for the subpopulations regarding the total qual-ity perception. This part of the analysis includes more qualitative interpretations of the survey material and is presented in a separate chapter.
Conclusions: Our instrument / model was tested in a survey conducted on students at
JIBS. The results from the investigation show that we have fulfilled our purpose to de-sign a model for measuring service quality in higher education. Our model consist of six factors that all are strong and have a high reliability. Three of the factors represents what we call the core service: Interaction, Education and Flexibility. The remaining three represent the supporting services of higher education namely: Premises, Reputa-tion and Library. The results of the regression analysis was also good. We got a high R2 (,666) and strong Beta values. In our analysis the factors representing core services got higher Beta values than the ones representing supporting services, a difference we be-lieve is valid for higher education in general.
Date: September 1997
Level: Masters Degree in Business Administration Authors: BSc Martin Gustafsson
BSc Johan Larsson
Tutor and examinator: Professor Per Davidsson
Co. Examinator: PhD Tomas Müllern
Title: SERVICE QUALITY IN HIGHER EDUCATION
An Empirical Study at the Jönköping International Business School
Table of Contents
1 Introduction ... 5
1.1 Problem Discussion ... 5 1.2 Problem ... 6 1.3 Purpose ... 6 1.4 Delimitations ... 6 1.5 Disposition ... 62 Framework ... 8
2.1 Services Versus Goods ... 8
2.2 Service Quality ... 10
2.3 The Service Concept ... 10
2.4 Service in Higher Education ... 11
2.5 Total Quality Models ... 11
2.5.1 The Total Perceived Quality Model ... 11
2.5.2 The Grönroos´- Gummesson´s Quality Model ... 11
2.6 Different Methods of Measuring Service Quality ... 12
2.7 SERVQUAL ... 13
2.7.1 A description of SERVQUAL ... 13
2.7.2 Operationalisations of SERVQUAL ... 14
2.7.3 Critique and Evaluation on SERVQUAL ... 16
2.8 Grönroos’ six Criteria of Good Perceived Service Quality ... 17
3 Methodology ... 18
3.1 Methodological Approach ... 18
3.2 Empirical Approach ... 18
3.3 Sample ... 19
3.4 Survey Design ... 19
3.5 Statistical Methods used in the Analysis ... 21
3.6 Response Rate and Non-response ... 21
3.7 A Critique of the Methodology ... 22
3.7.1 Validity ... 22 3.7.2 Reliability ... 22
4 Results ... 23
4.1 Factor Analysis ... 23 4.2 Reliability Analysis ... 24 4.3 Regression Analysis ... 255 Result Discussion ... 27
5.1 Different Factors’ Importance for the Total Quality Perception ... 27
5.2 Different Subpopulations' Perception of the Total Quality ... 28
6 Conclusions and Suggestions ... 29
6.1 Conclusions ... 29
6.2 Recommendations for Future Use of the Model ... 30
6.3 Suggestions for Additional Research ... 30
Appendix A Different Column Formats of SERVQUAL ... 33
Appendix B Survey Questionnaires ... 35
Appendix C Summary Descriptives ... 42
Appendix D Factor Analysis ... 43
Appendix E Subpopulation Analyses ... 45
Figures
Figure 1 Disposition of the thesis ... 7Figure 2 Goods/Services Continuum (Gross et al 1993) ... 9
Figure 3 Model of the service concept (Edvardsson 1996, p6) ... 10
Figure 4 The Total Perceived Quality (Grönroos 1990, p41) ... 11
Figure 5 The Grönroos´ - Gummesson´s Quality Model (Grönroos 1990, p66) 12 Figure 6 (Parasuraman, 1995) ... 14
Figure 7 Two Levels of Expectations (Parasuraman, 1993) ... 14
Figure 8 Survey example ... 20
Figure 9 Core and supporting services forming the factors for higher education27
Tables
Table 1 Differences between manufacturing and services (Norman 1991) ... 8Table 2 Answer rate and falling off ... 22
Table 3 Factors ... 23
Table 4 Alpha scores ... 24
1 Introduction
In the Introduction chapter the authors discuss the problem area, formulate the purpose of the thesis and describe the delimitations. The chapter is concluded with a disposition of the thesis.
1.1 Problem Discussion
Service management as a research area in business administration is still very young. The subject has previously been looked upon as a marketing subdiscipline but has over the years grown in importance and is now a discipline of its own. For a closer descrip-tion of the subject’s development see Fisk et al (1993).
The great importance of customer satisfaction and customer loyalty for successful com-panies has been clarified in several studies during the past decade, see for instance Heskett et al (1994).
One of the key factors to get satisfied customers is to provide high service quality. Since quality is what the customer experiences, to identify customer needs and wants has be-come more and more important in the competition of today.
The development of the service quality research has been described by Grönroos as a three phase evolution. The first phase (1980-1985) contained the development of a foundation for understanding service quality, including models like Total Perceived Quality (Grönroos 1994) and Gap Analysis Model (Berry & Parasuraman 1991). These models are static, describing variables and contexts which have to be taken into account when attempting to understand how service quality is perceived and how service quality should be managed. In the second phase (1986-1992) models were developed to identify how well the customer expectations are fulfilled by a service i.e. measure service qual-ity, e.g. SERVQUAL, SERVPERF. These models build on the static models of the first phase and strive for high service quality by reducing the gaps between expected and perceived quality as much as possible. In the third phase (1993-onwards) when service quality research increasingly will turn to developing more refined measurement models, dynamic models of service quality have to be developed and the measurement models further refined.
In today’s society there has been a lot of talk about universities and among other things the reports necessary to get a study place on the most popular education’s. This is a re-sult of demand and supply that has driven up the average report for some educations. For the universities this development is necessary to follow, because all universities want to compete for the best students, as they together with education, research, and lec-turers etc. will form the image of the university. As a student you look at several factors when evaluating an education among which the status is one. One other very important factor is the study quality. How good is the service quality given? This is a question that friends quite often get from people choosing an education. This means that all students at a school will act as ambassadors for the education given. Since the competition be-tween universities is hard it would be of great value to a university to be able to monitor the service quality as perceived by the students.
What has interested us is the e third phase of Grönroos description. We believe that for a satisfactory study of a certain service, the measuring model or tool needs to be
matched with the topical line of business, e.g., in this case students at JIBS and the over all higher educational sector.
1.2 Problem
Refering to the third phase of Grönroos, there is a lack of adequate models for measur-ing service quality in general as well as for the topical service area, higher education. With higher education we refer to education at university colleges and universities.
1.3 Purpose
The purpose of this thesis is to develop a model to monitor perceived service quality in higher education. The model will be based on the service quality frameworks and tested through an empirical study on students at JIBS.
1.4 Delimitations
Delimitations are used to increase the efficiency of a study and one can distinguish be-tween three kinds of delimitations: geographic delimitations, delimitations for time- and costs reasons and objective delimitations (Lekvall & Wahlbin 1993).
Since we both live and study in Jönköping there has been no need for a geographic de-limitation. However we have done an objective demarcation and limited the study to the students that major in business administration (both program students and detached courses), to get a homogenous population. This demarcation is also made due to time- and cost reasons. The size of the total population is about 240 students.
1.5 Disposition
The thesis is divided into 6 chapters. Following this first chapter the servicequality framework is presented. The framework is used as a basis for the survey design and in the analysis.
The method used in the thesis is presented in chapter 3.
In chapters 4 and 5 results of the study is presented and analysed.
In the last chapter the conclusions of the thesis is presented. In figure 1 the disposition of the thesis is summarised.
CHAPTER 1 INTRODUCTION CHAPTER 3 METHOD CHAPTER 2 FRAMEWORK Problemdiscussion Problem Purpose Delimitations
Method- & empirical approach
Sample
Survey design & methodcritcs Theory CHAPTER 4 RESULTS Empirical results Analysis CHAPTER 5 RESULT DISCUSSION
Deeper analysis of the result Disposition
CHAPTER 6 CONCLUSIONS
Conclusions and suggestions for additional research
Chapter 2 is used in the method and in the analysis of the empirical study Chapter 6 answers the purpose of the thesis Chapters 4 and 5 form the conclusions of the thesis
2 Framework
In the framework chapter the authors describe the theoretical framework of the problem area.
2.1
Services Versus Goods
Traditional marketing deals mostly with manufactured goods and is developed for goods marketing purposes. Since manufacturing and services are different in several re-spects, traditional marketing cannot be applied to a full extent when marketing services. To better understand the nature of services we examined the characteristics of both manufacturing and services. Norman has listed some differences between manufactur-ing and services (1991, p15)
Table Error! Unknown switch argument. Differences between manufacturing and services (Norman 1991)
Manufacturing Services
The product is generally concrete The service is intangible
Ownership is transferred when a purchase is made
Ownership is not generally transferred
The product can be resold The product cannot be resold
The product can be demonstrated The product cannot usually be effectively demonstrated (it does not exist before
pur-chase)
The product can be stored by sellers and buyers
The product cannot be stored
Consumption is preceded by production Production and consumption generally co-incide
Production, selling and consumption are lo-cally differentiated
Production, consumption and often even selling are spatially united
The product can be transported The product cannot be transported (though ‘producers’ often can)
The seller produces The buyer/client takes part directly in the production
Indirect contact is possible between com-pany and client
In most cases direct contact is necessary
Can be exported The service cannot normally be exported, but the service delivery system can
As stated in table 1 there are lots of differences between manufacturing and services. Differences that must be recognised for marketing purposes. All business however in-volve services to at least some extent. Gross et al (1993, p381) give some examples of how the service extent varies between different activities in a company, see figure 2.
Pure Good Pure Service Industrial wiping cloths Equipment leasing Machine brokerage Waste management Advertising agency Management consulting
Plant security Personnel
recruitment Cash mgt & payroll Equipment purchase Uniform rental
Plant & office landscaping Software design Consulting engineering Personell training Laboratory product testing Marketing research Industrial design
Figure Error! Unknown switch argument. Goods/Services Continuum (Gross et al 1993)
There is not a single definition of what a service is. Several authors, however, have tried to give a clear definition of the term service1. Among these definitions we have chosen two. Firstly Evert Gummesson defines services:
”Services are something which can be bought and sold but which you cannot drop on your foot” (Gummesson 1987, p22)
And secondly a definition given by Christian Grönroos:
”A service is an activity or series of activities of more or less intangible nature that normally, but not necessarily, take place in interactions be-tween the customer and service employees and/or physical resources or goods and/or systems of the service provider, which are provided as so-lutions to customer problems.” (Grönroos 1993, p27)
These quotations summarise as we see it the contents of table 1 in a good way. After this description we hope that the reader has obtained a deeper understanding of the ser-vice concept.
1
2.2 Service
Quality
In order to monitor service quality we have to define quality itself. As with the service concept there is not just one valid definition of the concept.
The International Standardisation Organisation (ISO) provides quality standards for companies in various industries over the world. ISO’s definition of quality reads as fol-lows: ”The totality of features and characteristics of a product or a service that bear on its ability to satisfy stated and implied needs.” (ISO 1990, p6) This definition is well thought through but it does not convey with the complexity of the quality phenomenon (Gummesson 1992, p183).
As we previously have shown services are very complex and that goes for the service quality concept as well. To get a somewhat clearer picture one can distinguish between product based quality and user based quality.
To monitor product based quality is fairly simple since one can get exact measurements of performances, size, weight and so on. But since services are not a good but rather a series of processes, service quality cannot be monitored in the same way. User based quality is then a good alternative. User based quality definitions say that quality is what gives satisfaction to the customer in the customers eyes, (Gummesson 1992), which is an approach that most researchers have agreed upon (e.g., Berry & Parasuraman 1991, and Grönroos 1993). We will therefore examine two of the proposed methods to moni-tor service quality, SERVQUAL and Grönroos’ six criteria of good perceived quality.
2.3 The
Service Concept
One way of describing a service is Edvardsson’s (1996) ‘Model of the service concept’, see figure 3. The model consist of two parts, A) Customer needs, and B) Design of the offer. The model views the service from the customer’s point of view. The needs of the customer are divided into two parts, primary needs and secondary needs. Thes are to be met by a core service and a respectively supporting service, the latter refers to the de-sign of the offer.
Primary needs
B. Design of the offer
Core service A. Customer needs Secondary needs Supporting services
2.4
Service in Higher Education
What implications can be seen for higher education as a service? Higher education as a service is a very complex process produced during a number of years and with lots of people involved. Different lecturers use different methods for the education and these methods are of different efficiency for each and every student.
Further, the outcome of the process, an education, is very abstract. The outcome is spe-cific for every single student and his/her participation in the process is of great impor-tance for the quality of the outcome. The alternative cost for education is also high which makes the quality of the outcome is of great importance for the student.
Regarding the service concept, one can identify, if using higher education as an example the primary need of the student (customer) to get a good education and secondary needs are everything from the coffee machines to the university premises. This is met by the school that provides the student with courses but also with supporting services such as the ones mentioned before.
2.5 Total
Quality Models
2.5.1 The Total Perceived Quality Model
Professor Grönroos has developed a model that describes what goes on in the minds of the customer when deciding on how good the quality of a service is. The model is based on two basic quality dimensions, what and how, i.e., the technical quality of the out-come and the functional quality of the process. These two quality dimensions together with the company’s image forms the experienced quality. But the perception of quality is more complicated than that. One must also consider the expected quality that is formed by factors such as market communication, image, word of mouth and, of course, the needs of the customer.
The total perceived quality is therefore a function of both the experienced and the ex-pected quality, see figure 4.
Expected Quality Experienced Quality Technichal Quality: What Functional Quality: How Image •Market Communication •Image •Word of Mouth •Customer Needs Total Percieved Quality
Figure Error! Unknown switch argument. The Total Perceived Quality (Grönroos 1990, p41) 2.5.2 The Grönroos´- Gummesson´s Quality Model
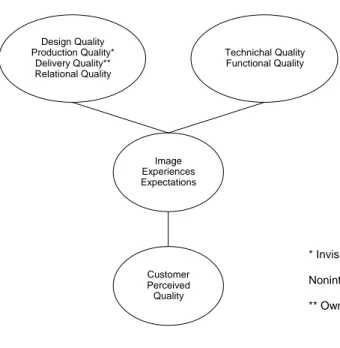
One other total quality model is the one developed together by Grönroos and Gummes-son, see figure 5. The model is based upon Grönroos’ ”Total Perceived Quality model”
(figure 4) and Gummessons’ ”4Q model”. According to Grönroos and Gummesson a company’s image depends on the quality of design, production, delivery and the rela-tions together with technical quality of the outcome (what) and the functional quality of the process (how). These quality factors also creates experiences and formulates expec-tations for the customer. All together they form the customer perceived quality. (Grön-roos 1990) Design Quality Production Quality* Delivery Quality** Relational Quality Technichal Quality Functional Quality Image Experiences Expectations Customer Perceived Quality
Figure Error! Unknown switch argument. The Grönroos´ - Gummesson´s Quality Model (Grönroos 1990, p66)
2.6 Different
Methods
of
Measuring Service Quality
In studies made about the quality of services, different methods of measuring custom-ers’ apprehensions have been used. These methods can, according to Liljander & Strandvik (1992), be divided into two categories depending on when the research is made and how the questions are asked.
1 All measurements are conducted after the experienced service, i.e.
a) you ask directly about the expectations and the experience
b) you ask indirectly about the expectations with a direct question about the divergence between expectations and experience.
2 Expectations are measured before the service and the experiences afterwards.
SERVQUAL, a model that will be further examined below, is used after the service is conducted with direct questions first about the expectations and thereafter about the ex-perienced service.
Carman (1990) suggest a direct question about the divergence between expectations and experience. This, he says, is particularly suited for customers that have good experience
* Invisible/Visible Noninterativ/Interactive ** Own/Subcontracted
of the service from before and have formed their own opinion of how the service should be conducted.
2.7 SERVQUAL
22.7.1 A description of SERVQUAL
Service quality is a measure of how well the service level delivered matches customers’ expectations. Delivering quality service means con-forming to customer expectations on consistent basis. (Lewis & Booms 1983, derived from Parasuraman 1995)
This statement has been supported by a number of researchers within the area of service marketing. Hence service quality has become one of the key elements in the subject.
SERVQUAL is a measurement instrument and the result of the creators’ extensive re-search on service quality. The empirical studies they made in five service establish-ments; a retail bank, a credit card company, a repair and maintenance company, a long distance telephone company and a security brokerage, resulted in the idea of that service quality consists of ten underlying dimensions, determinants of service quality. The SERVQUAL model was created in 1988 and modified in 1991.
The ten original dimensions
1. Tangibles: appearance of physical facilities, equipment, personnel and communica-tion personnel.
2. Reliability: ability to perform the promised service dependably and accurately.
3. Responsiveness: willingness to help customers and provide prompt service.
4. Competence: possession of the required skills and knowledge to perform the service.
5. Courtesy: politeness, respect, consideration and friendliness of contact personnel.
6. Credibility: trustworthiness, believability and honesty.
7. Security: freedom from danger, risk or doubt.
8. Access: approachability and ease of contact
9. Communication: keeping customer informed in language they can understand and listening to them
10.Understanding the customer: making the effort to know the customer and their needs.
The idea of SERVQUAL is to measure the gaps between expected i.e. idealistically provided service and perceived service quality along certain dimensions. These gaps can then be analysed further to determine the strengths and weaknesses of the services pro-vided and the customers total perceived service quality.
The dimensions are initially weighted by the respondent, i.e., how important each dif-ferent feature is for the customer when evaluating the quality of a certain company ser-vice. This weighting is designed by a question where the respondent is asked to allocate a total of 100 points among the dimensions. These weightings are used to get the right proportions to the gaps within the different dimensions, see figure 6.
1.
2.
3.
4.
5.
The appearance of the company’s physical facilities, equipment, personnel and communications material
The ability of the telephone company to perform the promised service dependably and accurately
The willingness of the telephone company to help customers and provide prompt service
The knowledge and courtesy of the telephone company’s employees and their abil-ity to convey trust and confidence
The caring, individualised attention the telephone company provides its customers
TOTAL POINTS ALLOCATED
___ points ___ points ___ points ___ points ___ points 100 points
Figure Error! Unknown switch argument. Factor weightings (Parasuraman, 1995)
The reasoning of SERVQUAL builds on that customers have two different service lev-els that serve as comparison standards in assessing service quality: Desired Service - the level of service representing a blend of what customers believe ‘can be’ and ‘should be’ provided; and Adequate Service - the minimum level of service customers are willing to accept. Separating these two levels is a Zone of Tolerance that represents the range of service performance a customer would consider satisfactory, see figure 7.
Desired Service Zone
of Tolerance Adequate Service
Figure Error! Unknown switch
argument. Two Levels of
Ex-pectations (Parasuraman, 1993)
The original SERVQUAL structure did not capture the
adequate service construct. Therefore the authors in recent
studies regimented and refined SERVQUAL not only to monitor the discrepancy between perceived service and de-sired service - labelled as measure of service superiority (or MSS) but also between perceived service and adequate service - labelled as measure of service adequacy (or MSA).
2.7.2 Operationalisations of SERVQUAL
For the surveys, the orginators use different formats for the questions. These formats are:
• Three-Column Format - This format generates separate ratings of desired, adequate and perceived service with three identical, side-by-side, nine-point scales. It requires
computing differences between ratings to quantify MSS and MSA. (see further ap-pendix A)
• Two-Column Format - This format involves obtaining direct ratings of perceived relative to desired service (MSS), and perceived relative to adequate service (MSA) with two identical, side-by-side, nine-point scales. (see further appendix A)
• One-Column Format - This format generates direct ratings of perceived relative to desired service (MSS) with a single nine-point scale. (see further appendix A)
For the original method the authors constructed the model with two 9-point rating scales, one to measure customers’ expectations in general within the service sector in-vestigated and another to measure customers’ perceptions about a particular company whose service quality was to be assessed. The expectation scale measured the extent to which customer felt the companies in the topical sector should possess a specific service attribute. The corresponding perceptions scale measured the extent to which customer felt a given company did possess the attribute. The attributes were cast in the form of statements with which customer were asked to express their degree of agreement or dis-agreement on the 7-point scale. e.g. The physical facilities at banks should be visually
appealing (expectation statement for tangibles) - The physical facilities at XYZ Bank are visually appealing (perception statement for tangibles). The result of the perception
scale is then reduced by the result of the expectation scale. A positive sum indicates the service to be better than expected and a negative that it is be worse than expected.
In an ongoing process the originators modified the SERVQUAL model. They reduced the number of statements/items under each dimension firstly from a total of 97 to 34 and further to a 22-item instrument and grouping those 22 items into just five general di-mensions. Three of the original dimensions remained the same; tangibles, reliability and responsiveness. The remaining dimensions were combined into assurance and empathy.
The modified dimensions
1. Reliability
2. Responsiveness
3. Assurance: members sense of trust and confidence in the service provider.
4. Empathy: is the way people are treated in the service encounter, friendliness, help-fulness etc..
5. Tangibles
One further modification was to revise all ‘should’ terminology to what customers will expect from companies delivering excellent service. E.g. from ‘banks should provide customers individual attention’ to ‘excellent banks will provide customers individual at-tention. Originally the statements were fifty percent negatively worded and fifty percent positively worded. This seemed to be confusing for the respondents when the standard deviation and reliability were substantially worse for the negatively worded statements, they were therefore all changed to positive statement.
The originators objective for the SERVQUAL-instrument is to be able to:
• assess a company’s service quality along each of the five SERVQUAL dimensions • compute a company’s overall weighted SERVQUAL score.
• track customers expectations and perceptions over time.
• compare a company’s SERVQUAL scores against those of competitors.
• identify and examine customer segments that significantly differ in their assessments of a company’s service performance.
• assess internal service quality e.g. between departments within the same company.
2.7.3 Critique and Evaluation on SERVQUAL
Critique has been raised against SERVQUAL as a measure instrument for service qual-ity. See list below.
• SERVQUAL does not monitor environmental/ecological aspects, the quality is only measured for the final customer not how it is produced.
• The price of the service is not included. • The 'ideal' situation is not cost related.
• It is not clear that there are five fixed quality dimensions (e.g. compare with Grön-roos six dimensions) and they may overlap each other. (Parasuraman 1995)
• The ‘before and after’ approach is not always practicable. Partly because it is diffi-cult to get completed questionnaires before a service encounter, as well as it is prob-lematic for customers to reveal what they expect from a service. (Webster-Hung 1994)
• Completing the expectations and perceptions parts under differing conditions might give misleading results, affecting the validity and reliability. (Ibid.)
• When asking for the expected service quality there is a risk that those expectations are raised subconsciously which affect the reliability of the results. (Ibid.)
• That customer expectations are not static but evolve and are therefore hard to define in a single measurement. (Ibid.)
• The over-all practicability of the questionnaire and the difficulty of greater perceived inconvenience in asking a respondent to complete two questionnaires, even if there is a time interval between the two. (Ibid.)
• The applicability of SERVQUAL across a wide range of services. (Babakus-Boller 1992). SERVQUAL needs to be customised to the service in question in spite of the fact it was originally designed to provide a generic measure that could be applied to any service (Carman 1990).
• Over-all statistical problems; reliability, discriminant validity, variance, with the use of difference scores (Brown et al 1993).
2.8
Grönroos’ six Criteria of Good Perceived Service Quality
Christian Grönroos has developed six criteria of good perceived service quality (Grön-roos 1990, p46-48). His criteria are listed below.
1. Professionalism and Skills: the customers realises that the service provider is compe-tent (Outcome related criteria)
2. Attitudes and Behaviour: the customer feel that the service provider cares about them.(Process related criteria)
3. Accessibility and Flexibility: the customer feels that he easily can get access to the service; locations, opening hours and so on. (Process related criteria)
4. Reliability and Trustworthiness: the customer feels that he can trust the company and it’s promises. (Process related criteria)
5. Recovery: the customer realises that he will be compensated if anything goes wrong. (Process related criteria)
6. Reputation and Credibility: The customer believes that the service provider is reli-able and that he gets good value for his money. (Image related criteria)
These six criteria are not the result of empirical research but derived from professor Grönroos long experience from service marketing research. The Grönroos criteria are closely related to the dimensions given by Parasuraman et al (1991) in the SERVQUAL instrument, see 2.7. The big difference between SERVQUAL’s dimensions and Grön-roos’ criteria is GrönGrön-roos’ recognition of image as an important criterion for good per-ceived quality, a criterion that is overlooked by Berry et al. We believe that image is important for the perceived quality and therefore think that Grönroos’ critera are better than the five dimensions of SERVQUAL.
As the Grönroos’ criteria not are as widely diffused as SERVQUAL there is no written critique against them. However, we have come up with some critique against the six cri-teria:
• They do not measure service quality in relation to the price of the service • The criteria are quite complex
• They are not empirically tested and validated
• They do not deal with environmental aspects of the service
The six criteria of good perceived service quality creates the left part of Grönroos’ model ‘Total Perceived Quality’, see figure 1. The model states that the only quality dimensions the customer values is what he gets and how he gets it (technical and func-tional quality). Grönroos has also included image in his model as a factor that will affect the experienced quality.
Further on he says that the expected quality is dependent on the customers needs, word of mouth, image, and market communication. Good total perceived quality is obtained when the experienced quality meets or exceeds the expected quality.
3 Methodology
In this chapter the authors describes the methodology used in the thesis. The chapter is concluded with a critique of the methodology.
3.1 Methodological Approach
This section is based upon Lekvall & Wahlbin (1993). According to Lekvall & Wahlbin (1993) the two main methodology approaches is the qualitative and the quantitative ap-proach. We will now explain these two approaches briefly and conclude with the impli-cations for our thesis.
A qualitative approach is suitable when one wants to go deeper into a problem and get a better understanding of a small population. To get a good understanding of how the cus-tomer perceives the quality one must go deeper into the case wherefore the qualitative approach can be suitable. The strict qualitative approach however does not enable gen-eral conclusions for the whole population, which is of great value for marketing deci-sions. The purpose of our thesis is to design and evaluate an instrument to monitor ser-vice quality in higher education and therefore a strict qualitative approach cannot be used in our thesis.
With a quantitative approach the data is quantified which means that the data can be analysed statistically. With a large sample the quantitative approach enables general conclusions for the whole population. The existing methods to monitor service quality are mostly quantitative in their approach, e.g., SERVQUAL. Also for the purpose of our thesis we have found the quantitative approach to be suitable and therefore used for the collection of empirical data.
However we would like to stress that these two approaches do not have to be seen as two extremes that automatically exclude each other. As mentioned above both the quali-tative and the quantiquali-tative approach have their strengths and weaknesses. By combining the two methods the weak sides of the methods are at least in some ways compensated. We have used a quantitative approach in the collection of data. We have, however, a thorough understanding of the education system, which ought to give us a better qualita-tive understanding in our analysis of the quantitaqualita-tive data.
3.2 Empirical
Approach
The empirical study is as mentioned before carried out with quantitative approach. The objective of the emperical study is to examine the perceived service quality in higher education and to test the validity and reliability of our developed service quality model.
There are three main types of communication approaches for question methods (Lekvall & Wahlbin 1993, 183-187): personal interviews, telephone interviews and letter inquir-ies. The different approaches can be used separately or combined after the needs and wants of the investigator.
The main advantage with personal interviews is that the possibility to ask various ques-tions is almost unlimited. Also the non-response is very low. The big disadvantage is
that this method is very expensive and therefore only suited for studies of small popula-tions. Therefore we have found this method non suitable for our purposes.
Telephone interviews are cheaper than personal interviews but more expensive than let-ter inquiries. They have however a reasonable cost per investigated unit. The big advan-tages with this method is that it is fast and that the non-response is quite low. You are also quit certain of that it is the right person who answers. The disadvantages with the method is that a telephone interview cannot be to long and therefore cannot be used if you want answers to many questions. Because of that this approach cannot be used in our study.
The big advantage with letter inquiries is the low cost per investigated unit. A cost that in our case is extremely low as we have the opportunity to deliver all inquiry forms per-sonally to the respondents. Letter inquiries are well suited for investigations of large samples and gives the opportunity to ask more questions. We have therefore chosen to use this approach for our study. The big disadvantage is that letter inquiries often gener-ate a large non-response. To reduce the non-response rgener-ate it is of great importance that the questionnaire is not to long and consists of relevant questions.
3.3 Sample
In order to test our model we wanted a least 72 answers (for statistical purposes, see part 4.1). To achieve that we handed out 100 questionnaires. Due to cost reasons we chosen to use a so called convenience sample, selecting our respondents at the school and de-livering the questionnaire personally. This method has the disadvantage that it can twist the results of the investigation (Lekvall & Wahlbin 1993).
There are 240 third and fourth year students who study business administration at JIBS, which means that we approached nearly half the population with our questionnaire. We attended classes and the other rooms for respondents and gave questionnaires to all stu-dents in the population that we found. Since we are stustu-dents at the school ourselves and has studied with almost all students in the population we believe that the risk for a twist of the results is quite small.
3.4 Survey
Design
We have for the survey used the 1 b method according to Liljander & Strandvik (1992), (see 2.6). Since the students have at least two and a half years of continuous experience of JIBS they are well aware of what to expect from the service quality level of higher education. This makes it possible to measure expectations with an indirect question us-age. To use the second method, i.e., measure expectations before the service and percep-tions afterwards would be too complicated and for the topical area inappropriate since we believe that some experience is required even for measuring of expectations.
The questionnaire is based upon the SERVQUAL dimensions and Grönroos’ six criteria of good perceived service quality. According to the third phase of the evolution of ser-vice quality research (see 1.1), we have designed a questionnaire suited for higher edu-cation and the dimensions/criteria have served as guidelines when forming the survey questions.
The questionnaire is designed to measure the students’ perception of the service quality with an indirect comparison to his or her expectations. We use a one column format which we believe facilitates both the respondents participation as well as the analysis.
Unlike SERVQUAL (see 2.6) we use expected instead of desired when comparing the students perceptions of JIBS educational quality. For a service like higher education we believe this change of formulation is necessary. Universities and educations differ, the comparison you can make between ordinary companies is not possible and therefore it is more appropriate to measure what expectations the students had/have on the topical university/education than their desires.
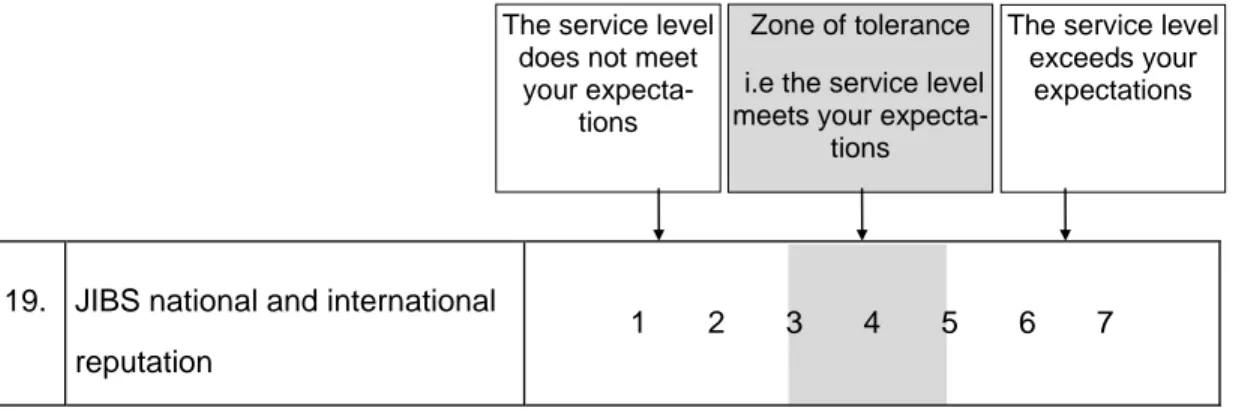
The scale we have used is between one to seven. We believe that a scale with the range of seven provides us with enough information without becoming too complex.
The shaded area between 3.0 and 5.0 represents the zone of tolerance, see 2.7, fig 7. Within this area the respondent/student feels that the service level meets his or hers ex-pectations. In figure 8 an example of a question from the questionnaire is given.
19. JIBS national and international reputation
1 2 3 4 5 6 7
Figure Error! Unknown switch argument. Survey example
We have used neutral formulations for which the students by filling in a certain number shows his or her negative or positive impression. By this we believe we avoid the diffi-culties the creators SERVQUAL originators have had by using positive and negative statements.
The questionnaire was tested on tutors and students before the survey was carried out. Some refinements were made as a result of these tests.
Questions number one and twenty are designed to asses the students’ general impres-sion of the overall service quality at JIBS. These two questions are used as the depend-ent variables later in the analyse.
Questions number two to ten are derived from the professionalism and skills criteria of Grönroos and the tangibles dimension of SERVQUAL. These questions deal with the competence of lecturers and library personnel, the education and examination methods, the university lecture rooms, the library resources and the resources of the computer network.
Questions number eleven to thirteen derive from the attitudes and behaviour criteria of Grönroos and the empathy and responsiveness dimensions of SERVQUAL. The
lectur-The service level does not meet
your expecta-tions
The service level exceeds your
expectations Zone of tolerance
i.e the service level meets your
ers’ and the administrative and library personnel’s commitment, interest and willing-ness to help students are treated in these questions.
Questions number fourteen to sixteen derive from the accessibility and flexibility crite-ria of Grönroos and treat curricula, scheduling of courses, and the student’s ability to form his or hers education after their own preferences.
Question number seventeen derives from the reliability and trustworthiness criteria of Grönroos and the reliability dimension of SERVQUAL. The question asks about the quality of the students course program.
Question number eighteen derives form the recovery criteria of Grönroos and treats the university’s ability to solve problems for the student.
Question number nineteen derives from the reputation and credibility criterion of Grön-roos and asks about the national and international reputation of the university.
Finally questions number twenty-one to twenty-nine are used as background variables and ask for the respondents age, sex, origin, study results, experiences of work life and other universities than JIBS. These questions are later in the analyse used to identify patterns among subpopulations for the answers of questions one and twenty.
In appendix B we have placed the questionnaire in a Swedish and a English version.
3.5 Statistical
Methods
used in the Analysis
The analysis methods used in the analysing of our questionnaires are factor analysis and regression analysis.
A factor analysis is used for datareduction of the material. If there are several variables that seem to be connected to each other and there is a reason to believe that they meas-ure the same phenomenon (factor) the original variables can be replaced by a factor (of-ten a factor score). The technique is very useful when measuring abstract and complex phenomena like for instance perceived quality.
Regression analysis is used to analyse the connection between a dependent variable and several independent variables. The regression analysis aims at finding a mathematical connection between dependent and independent variables according to the formula.
Y = a + b1x1+b2xx...bnxn
The computer calculates the coefficients a and b, in order to find a linear connection be-tween the dependent variable and the indepent variables.
3.6 Response
Rate
and Non-response
We handed out 100 questionnaires during a period of two weeks and got 79 answers. When we started our analysis we discovered that five of the respondents didn’t belong to the target group. They were therefore excluded from the analysis. This gives us an ac-tual response rate of 78%. The response rate and non-response is summarised in table 2.
Table Error! Unknown switch argument. Answer rate and falling off Delivered questionnaires 100
Returned questionnaires 79 not in the target group 5 Analysable questionnaires 74 Non-response for unknown reasons 21
3.7
A Critique of the Methodology
3.7.1 Validity
As we have stated before service quality is not a concrete term that can be measured with a single question. Therefore you must operationalise the term which means trans-lating the abstract term into something concrete and measurable. This operationalisation is carried out through a design of a measurement instrument. We have chosen to de-velop a survey questionnaire in order to measure service quality. Validity is the meas-urement on how well the instrument measures watt it is intended to measure (Körner 1993). High validity implies a lack of systematic errors in the measurement. Lekvall and Wahlbin discuss face validity, which means that the questionnaire is tested on several competent persons and by them considered to make sense (Lekvall & Wahlbin 1993). We have pre-tested our questionnaire on several fellow students, two Ph.D. Candidates and our thesis supervisor, Professor Davidsson, and considering their positive response we believe that our final questionnaire has a good face validity. This is of course not a guarantee for our model to be perfect in any sense. Perceived service quality is an ab-stract term and it is therefore very hard to determine the validity of an instrument like ours. However, several persons have agreed on that the questionnaire seems reasonable and our results make sense so we would like to argue that the validity for our method is high.
3.7.2 Reliability
Reliability is the same thing as the trustworthiness of what we investigate or lack of random measurement errors. The reliability of an investigation can be affected by sev-eral different factors, among them the measurement instrument and the investigated ob-ject (Körner 1993). To obtain a high reliability it is important that the investigation is carried out carefully so that the randomised error is minimised (Lekvall & Wahlbin 1993). In order to minimise the random error we have designed a questionnaire with fixed respons alternatives. We have chosen to statistically measure the reliability of our investigation with the Cronbach’s Alpha test. Cronbach’s Alpha tests the internal con-sistency reliability on for example created factors. By internal concon-sistency is meant how well different items measures the same issue (Litwin 1995).
4 Results
In this chapter we present the results of our investigation. All our analyses are made in the SPSS programme
4.1 Factor
Analysis
For a brief description of what a factor analysis is see 3.5. We designed our survey in order to run a factor analysis on questions 2-19 and then use the extracted factors as in-dependent variables in a regression analysis. The methods used in the factor analysis are extraction, principal components and rotation, Varimax. Varimax rotation minimises the number of variables that have high loading on each factor. We asked the programme to extract factors with Eigenvalue > 1. When creating factors a rule of thumb is to create factors with Eigenvalues > 1 (Aczel 1993). In order to make the factor analysis useful there must be 4-5 respondents per item in the analysis (Hair et al 1992). We got 74 an-swers and since 4*18 = 72 < 74 the material was large enough for the analysis. For summary descriptives see appendix C.
The factors that were created are not identical with the dimensions of SERVQUAL nor the criteria of Grönroos but since we did not use the same question battery this was not to be expected. The factors are created because the questions/variables forming them correlate best within each factor. Since the questions/variables treats higher education, the questions/variables create higher-education-influenced factors. In table 1 we have listed the factors created in the factor analysis and which questions they consist of. For the complete factor analysis see appendix D.
Table Error! Unknown switch argument. Factors
Factor Question
No Name No Name
1 Interaction with student 3 The lecturers pedagogical competence
11 Lecturers commitment and interest for the students
12 The administrative personnel’s willingness to help the students
16 The scheduling of courses
17 The course programme I take at JIBS 2 Library 4 The library personnel competence
10 JIBS´ library and its resources
13 The library personnel’s willingness to help the students 3 Premises 7 Today’s lecture rooms
8 Today’s other premises
9 JIBS´ computer - network resources
4 Flexibility 14 The possibilities to form my education after my own preferences 15 The planning and arrangement of courses
18 JIBS´ ability to solve any practical problems 5 Education 2 The lecturers theoretical competence
5 JIBS´ educational methods 6 JIBS´ examination methods
Interaction with the student: This factor monitors the service level of the different
in-teractions students experience at JIBS. It covers both the pedagogical competence of the lecturers as well as the treatment they experience by them and other personnel. The ‘in-teraction with the student factor’ is closest equivalent to the Empathy dimension of SERVQUAL and the Attitudes and Behaviour criteria of Grönroos.
Library: This factor covers the library at JIBS, how the students value the service
qual-ity regarding the library resources, the competence and service mindedness of the per-sonnel. This factor does not correspond to any specific dimension of SERVQUAL nor to any specific criterion of Grönroos, something we believe depends on the typical im-portance a university library has for higher education.
Premises: This factor covers how lecture rooms and other premises are experienced by
the student at JIBS. This factor is closest equivalent to the Tangible dimension of SERVQUAL and the Accessibility and Flexibility criteria of Grönroos.
Flexibility: This factor covers how the student can manage his or her education, how
the courses are planned and how problems are sorted out by JIBS. This factor is closest equivalent to the Responsiveness dimension of SERVQUAL and the Accessibility /
Flexibility and Recovery criteria of Grönroos.
Education: This factor monitors the service quality of the education at JIBS, as it is
perceived by the students. This factor measure the core service of higher education and includes the competency of the lecturers as well as the educational and examination methods at JIBS. This factor is the closest equivalent to the Reliability dimension of SERVQUAL and Professionalism / Skills and Reliability / Trustworthiness criteria of Grönroos.
Reputation: This factor covers what the students experience to be the national and
in-ternational reputation of JIBS. The reputation factor is most equivalent to Grönroos’
Reputation and Credibility criteria and has some resemblance to the Assurance
dimen-sion of SERVQUAL.
4.2 Reliability
Analysis
The extracted factors makes sense as we see it. However we wanted to test the reliabil-ity of the extracted factors. In order to assess the internal consistency reliabilreliabil-ity of our factors we performed a so called Cronbach’s Alpha test, see 3.7.2. The results of the test indicates that the reliability of the created factors are high. Nunnall (1978) recom-mends an Alpha score of 0,7 or higher, a value that all factors but one exceeds, see table 4.
Table Error! Unknown switch argument. Alpha scores
Factor Alpha score
1 Interaction with student 0,7901
2 Library 0,8115
3 Premises 0,7311
4 Flexibility 0,6319
5 Education 0,7126
-4.3 Regression
Analysis
To get a brief description on the use of a regression analysis see 3.5 The next step in our analysis was to carry out a regression analysis to investigate which of the factors that are most important in order to reach high perceived quality in higher education. As in-dependent variables we chose to use the factors scores extracted in the factor analysis and as dependent variables we formed an index after the formula [(q1+q20)/2]. We also ran an reliability test on this index and got an Alpha score on 0,794, which is a high re-sult. In table 5 we display the results of the regression analysis.
Table Error! Unknown switch argument. Results of the regression analysis. Multiple R R Square Adjusted R Square Standard Error ,816 ,666 ,632 ,519 F = 19,62733 Signif F = ,0000 Variable B SE B Beta INTERACTION ,403 ,064 ,471 LIBRARY ,083 ,064 ,097 PREMISES ,232 ,064 ,271 EDUCATION ,369 ,064 ,431 FLEXIBILITY ,276 ,064 ,323 REPUTATION ,229 ,064 ,267 (Constant) 4,902 ,064
When running a regression analysis the first thing to do is to check if there is regression in the model. To do that we set up two hypothesises: H0: B=0 (no regression)
H1: B≠0 (regression) The Signifi F value ,0000 indicates the probability for H0 to be true and since the prob-ability is extremely low we falsified H0, which also is supported by the high F value (19,62733) that indicates regression. The hypothesis H1 is therefore considered to be true.
The Multiple R value or the correlation coefficient ranges from 0-1 and a small value indicates that there is a little or no linear relationship between the dependent variable (our quality index) and the independent variables (the factors). Our model has a Multi-ple R value on ,81622 which is a clear indication of the accuracy of our linear model. Further more the results of the regression analyses tell us that the created model has a R2 value on ,66622 which is considered to be a high value. R2 or the coefficient of de-termination is a measure of goodness of fit of a linear model. Small values indicate that the model does not fit the data well.
To examine the relative importance that the different factors have for the total perceived quality the B and Beta values were examined. B is the undstandardised coefficient and Beta is the standardised coefficient. The standardised Beta is obtained if you before the regression analysis standardise the variables so that their mean value becomes 0 and their standard deviation 1, a process that is done by SPSS. When examining these vari-ables in the equation closer we notice that the most important factor for perceived ser-vice quality was the factor ‘interaction with student’ with a B value on ,403 and stan-dardised Beta on ,471. This clearly states the importance for the student to feel that the school is doing its best to support them in their studies. For the other factors only the Beta value is given in the text, however the B values are given in table 5.
Of great importance is also the factor ‘education’ that got a Beta value of ,431. This fac-tor has to do with the core service of the education i.e. the theoretical competence of the lecturers which is close related to the educational- and examination methods.
The factor ‘flexibility’ deals with the school’s ability to help the students to form their own education. The factor is of significance to the model and got a Beta value on ,323. Also the ‘premises’ and the ‘reputation’ are important factors ,271 respectively ,267 and of significance to the model.
What did surprise us was the low importance that the factor ‘library’ got, a Beta value at only ,097. We did however run the test without the factor ‘library’ and since we got a lower value on R2 adj we decided to keep it in our model. One explanation to the low Beta value may be that the library is seemed as a supporting service for higher educa-tion. Something that is a part of the overall higher educational service but not of outer-most importance.
5 Result
Discussion
In this chapter the results of the study is presented and discussed.
5.1 Different
Factors’
Importance for the Total Quality
Per-ception
We have in our investigation found that our model creates strong and reasonable factors that affect total perceived quality in higher education. For a description of how the fac-tors were extracted see 4.1.
We have chosen to divide the factors into core and supporting services respectively. The factors we see as core services for higher education are the interaction with the student, the education and the flexibility. The factors we see as supporting services are the prem-ises, the library and the reputation, a delination we feels makes good sense. We believe that figure 9 gives a good overview of the service concept for higher education.
Core service factors Supporting service factors Education Library Flexibility Interaction Premises Reputation
Figure Error! Unknown switch argument. Core and supporting services forming the factors for higher education
The delination of the factors in core and supporting services respectively is also sup-ported in the regression analysis, in which the core services got higher B and Beta val-ues than the supporting services, see 4.3, table 5.
What was ranked as most important for the total quality of higher education was inter-action with the student i.e. the lecturers pedagogical competence, the willingness to help and the commitment lecturers and other personnel show the student, which together with the planning of courses forms the over all perception of the course programme taken.
The second most important factor was the education, i.e. the theoretical competence of the lecturers, the pedagogical and examination methods of the university.
The flexibility, i.e. the planning, scheduling of courses and the ability for the students to form his or her own education was ranked third.
All the supporting services were ranked lower than the core services. The premises were ranked some higher than the reputation factor whereas the library was ranked signifi-cantly lower than all the others regarding the importance for the total quality of higher education.
These results are as we see it valid to at least some extent for higher education as a whole. We can not, however, claim that the ranking between different factors will be the same for all universities due to the fact that our convenience sample hinders us from drawing any general conclusions for a larger population.
5.2
Different Subpopulations' Perception of the Total Quality
We believe that our set of background questions is valid also for similar investigations on other universities. The results in this part however are JIBS specific. The results of the subpopulation analysis is presented in appendix E.
We could not find any particular differences between the sexes regarding the total qual-ity perception of JIBS.
The students originating from Jönköping tend to perceive the total quality lower than student from adjoining districts or other parts of Sweden. We believe this may be ex-plained by the fact that the motives for choosing JIBS are different depending on from where you come. For students originating from Jönköping the financial factors may play in when choosing JIBS, whereas the students from further away more directly choose JIBS for its specific education.
Students with some work experience tend to perceive the total quality of JIBS slightly higher than the students without any work experience.
Students participating the international programme in business administration tend to perceive the total quality higher than students taking the old business administration program and significantly higher than students taking detached courses.
Students with experience of other universities than JIBS tend to rank the total quality some what higher than those with no other experiences.
There is a tendency that students with better study results perceive the total quality of JIBS higher than students with worse results.
The age seems to affect the perception of the total quality. The older the students the higher ranking.
The choice of specialisation affects the perception of the total quality. The students spe-cialising in more than one area rank the total quality highest. Students spespe-cialising in entrepreneurship, marketing and management rank it some lower whereas the ones spe-cialising in statistics, IT and accounting rank it lowest. The students with more than one specialisation have more courses to choose from and feel that they better can form their own education of their own.
6
Conclusions and Suggestions
In this chapter the conclusions of the study is presented. The chapter is concluded with suggestions for further research.
6.1 Conclusions
The purpose of this thesis was to develop a model to monitor perceived service quality in higher education based on the service quality frameworks. In order to test our model we made an empirical study on students at JIBS.
With support from the analysis we would like to state that the model developed monitor perceived service quality in a satisfactory way.
From the survey w conducted six factors were extracted, all with Eigenvalues > 1, see 4.1. All factors make sense as we see it, and they are also supported by high Alpha scores, see 4.2.
The regression analysis indicates that the factors are good predictors for total perceived quality in higher education. The regression analysis gives a high R2 value and high B and Beta values for some of the factors, see 4.3. The relative importance for the differ-ent factors may vary between differdiffer-ent educations and universities but we believe that they all are important for the total quality perception. Below the factors are presented in order of importance (according to the regression analysis) for the total perceived quality at JIBS.
• Interaction with student • Education
• Flexibility • Premises • Reputation • Library
Even though the size of our sample was enough to monitor the perceived service quality for the population as a whole it did not allow us to draw any general conclusions for the subpopulations. Therefore we must admit that it would have been better to have a larger sample and perhaps also investigate the other educations offered by JIBS to see if there are any distinctions between them.
We have found lots of research that has been done in the area of service quality. How-ever, most of the research has been concentrated to the SERVQUAL model and not much research has been done on the service higher education. A gap which we believe our model fills.
6.2 Recommendations for Future Use of the Model
Regarding the questions number 1-20 used in the questionnaire there was no specifi-cally great non-response and therefore we only recommend some minor changes which could improve the validity and reliability.
We have given the factors suitable names. Further research may come up with other names but we believe that the contents of the factors are representative for service qual-ity in higher education.
The factor ‘Reputation’ was formed by the single question (number 19) in the question-naire. Our suggestion is to replace it with two questions, the first asking about the stu-dent’s own perception of the national and international reputation and the second asking about the students beliefs regarding others perception of the national and international reputation. By doing this we believe that the factor ‘Reputation’ will be formed by more than one variable and therefore reduce the uncertainty for this factor, both for the re-spondent as well as for the analyst. This way we hope to improve our reliability even more.
We would further recommend to reformulate question number 10 from ‘JIBS´ library and its resources’ to ‘JIBS´ (or the scool in question) library resources’ in order to minimise the uncertainty of what the question asks about.
Our model can of course be used not only in Jönköping but by all universities / institu-tions offering higher education and than changes have to be made regarding the ques-tions used for respondent identification, i.e. the background quesques-tions.
If the model is used by other universities, the JIBS specific questions must be changed so that they refer to the topical education.
We would like to recommend that future users of the model use a random sample and this avoid a convenience sample that may twist the results.
For future use we also would recommend that the investigators use a larger sample so that subpopulation analysis becomes more meaningful. Also if the sample is large enough it could serve as a foundation for future refinment of the model.
6.3 Suggestions
for
Additional Research
To further corroborate the validity of the model, it should be tested on other university educations. Thereby one could empirically see how well the dimensions generally measure service quality in higher education and how their relative importance is changed.
Since we believe that it would be of interest to examine all the schools at the University of Jönköping, not only JIBS and see if there are any differences between the students perceived quality of the different corporations.
It may also be wise to test the model a few years from now to see how the time and the new premises effect students perception on educational quality at JIBS.
List of References
Aczel, Amir D, (1993), Complete Business Statistics, Boston, Irwin (2ed)
Babakus-Boller ,(1992), An Empirical Assessment of the SERVQUAL Scale, Journal
of Business Research, No 24
Berry, LL & Parasuraman A, (1991), Marketing Services, Competing Through Quality, Free Press
Brown T, Churchill G & Peter P, (1993), Research Note: Improving the Measurement of Service Quality, Journal of Retailing, Vol 69 (Spring)
Carman, (1990), Consumer Perceptions of Service Quality: An Assessment of the SERVQUAL Dimensions, Journal of Retailing, Vol 66 (Spring)
Edvardsson B, (1996), Quality in new service development - key concepts and a frame of reference, International Journal of Production Economics, April
Fisk R, Brown S, Bitner M, (1993, Service Management Literature Overview: A
Ra-tionale for Interdisciplinary Study, in Swartz, Bowen & Brown (eds),
(1993), Advances in Services Marketing and Management, vol 2, JAI Press Inc
Gross A, Banting P, Meredith L & Ford D, (1993), Business Marketing, Houghton Mif-flin Company
Grönroos C, (1993), Toward a third phase in Service Quality Research: Challenges and
Future Directions in Swartz, Bowen & Brown (eds), (1993), Advances in Services Marketing and Management, vol 2, JAI Press Inc
Grönroos, C, (1994), Service Management and Marketing: Managing the Moments of
Truth in Service Competition, McGraw-Hill
Gummesson E, (1987), Lip Services - a neglected area in Services Marketing, Journal
of Services Marketing, No. 1
Gummesson E, (1992), Quality Dimensions: what to measure in service organisations in Swartz, Bowen & Brown (eds), (1992), Advances in Services Marketing
and Management, vol 1, JAI Press Inc
Hair Joseph F, Andersson Ralph, Tatham Ronald & Black William, (1992),
Multivaria-te Data Analysis with Readings, New York, MacMillan Publishing
Compa-ny
Heskett J, Jones T, Loveman G, Sasser E Jr & Schlesinger L, (1994), Putting the Ser-vice-Profit Chain to Work, Harvard Business Review, March- April 1994
ISO, (1990), Quality Management Quality Systems Elements. Part 2: Guidelines for