VTI meddelande 951A • 2004
Traffic safety measures
and observance
Compliance with speed limits, seat belt use
and driver sobriety
VTI meddelande 951A · 2004
Foto: VTI
Traffic safety measures
and observance
Compliance with speed limits, seat belt use
Compliance with speed limits, seat belt use
Compliance with speed limits, seat belt use
Compliance with speed limits, seat belt use
Compliance with speed limits, seat belt use
and driver sobriety
and driver sobriety
and driver sobriety
and driver sobriety
and driver sobriety
Publisher: Publication:
VTI meddelande 951A
Published:
2004
Project code:
50404
SE-581 95 Linköping Sweden
Printed in English 2005
Project:
Traffic safety effects of measures taken in relation to vehicles and drivers.
Author: Sponsor:
Göran Nilsson SIKA (Swedish Institute for Transport and Communications Analysis)
Title:
Traffic safety measures and observance.
Compliance with speed limits, seat belt use and driver sobriety
Abstract
On behalf of the Swedish Institute for Transport and Communications Analysis (SIKA), an estimate has been made of the effect on traffic safety of total compliance with the current speed limits, seat belt use and driver sobriety.
A very high degree of observance of the three measures would mean that the number killed in traffic would be reduced by almost 50%. What is of interest is that observance is not randomly distributed among the three measures. Both the drivers who adjust their driving to the three measures, and those who simultaneously contravene two or all three of the measures, are overrepresented in traffic.
ISSN: Language: No. of pages:
Utgivare: Publikation:
VTI meddelande 951A
Utgivningsår: 2004 Projektnummer: 50404 581 95 Linköping Utgiven på Engelska 2005 Projektnamn: Trafiksäkerhetseffekter av fordonsåtgärder Författare: Uppdragsgivare:
Göran Nilsson SIKA
Titel:
Trafiksäkerhetsåtgärder och efterlevnad.
Hastighetsanpassning, användning av bilbälte och nykter som bilförare
Referat
På uppdrag av Statens institut för kommunikationsanalys (SIKA) har effekten på trafiksäkerheten skattats avseende en total efterlevnad av gällande hastighetsgränser, användning av bilbälte och att vara nykter som bilförare.
En mycket hög efterlevnad av de tre åtgärderna innebär nästan en halvering av antalet dödade i trafiken. Av intresse är att efterlevnaden inte är slumpmässigt fördelad på de tre åtgärderna. Såväl de förare som anpassar sin körning till de tre åtgärderna som de som samtidigt bryter mot två eller samtliga åtgärder är överrepresenterade i trafiken.
ISSN: Språk: Antal sidor:
Foreword
This project was carried out on behalf of the Swedish Institute for Transport and Communications Analysis (SIKA). The contact person and initiator was Roger Pyddoke. Hans Erik Pettersson and Sven Dahlstedt, VTI, scrutinised the manuscript and Anita Carlsson, VTI, was in charge of transcript. I wish to express my thanks to all of them.
Linköping, April 2004
Göran Nilsson
Contents
Summary 5 Sammanfattning 7 1 Background 9 2 Objective 9 3 Speed regulation 104 Seat belt use 13
5 Alcohol and driving 17
6 How is ”full” observance achieved – Is an interlock system
needed? 19 7 Speed control, seat belt use and alcolock 22
8 Relationship between measures – Speeds, seat belt, etc. 28
9 References 30
Traffic safety measures and their observance. Compliance with speed limits, seat belt use and driver sobriety
by Göran Nilsson
Swedish National Road and Transport Research Institute (VTI) SE-581 95 Linköping, Sweden
Summary
On behalf of the Swedish Institute for Transport and Communications Analysis (SIKA), an estimate has been made of the effect on traffic safety of total compliance with the current speed limits, seat belt use and driver sobriety.
Observance varies among the three measures. Observance of speed limits is low, while observance of driver sobriety is high. At the same time, while speeding causes only a moderate deterioration in traffic safety, being intoxicated while driving involves a dramatic rise in risk.
On the whole, the greatest traffic safety problem is violation of the speed limits, and these results in 150–200 fatalities annually. Owing to inadequate observance of the other two measures, 50–100 persons are killed annually. The report does not deal with the matter of how observance should be increased. There are however interlock systems available for increasing observance, as alternatives/ complements to greater surveillance and/or higher fines.
Compared with the death risk of the ”exemplary” driver group, lack of observance more than doubles the death risk.
A very high degree of observance of the three measures would mean that the number killed in traffic would be reduced by almost 50%. What is of interest is that observance is not randomly distributed among the three measures. Both the drivers who adjust their driving to the three measures, and those who simultaneously contravene two or all three of the measures, are overrepresented in traffic.
It is at the same time important that speed reduction reinforces the other traffic safety measures. Estimation of the effect of alcohol is very uncertain, since the permitted alcohol levels vary between countries.
Trafiksäkerhetsåtgärder och efterlevnad. Hastighetsanpassning, användning av bilbälte och nykter som bilförare
av Göran Nilsson
Statens väg- och transportforskningsinstitut (VTI) 581 95 Linköping
Sammanfattning
På uppdrag av Statens Institut för KommunikationsAnalys (SIKA), har effekten på trafiksäkerheten skattats avseende en total efterlevnad av gällande hastighets-gränser, användning av bilbälte och att vara nykter som bilförare.
Efterlevnaden varierar mellan de tre åtgärderna. Sämst är efterlevnaden av hastighetsgränser och bäst är efterlevnaden av att vara nykter som bilförare. Samtidigt innebär överträdelse av hastighetsgränsen en måttlig trafiksäkerhetsför-sämring medan att vara alkoholpåverkad bakom ratten innebär en dramatisk risk-ökning.
Totalt sett är trafiksäkerhetsproblemet av att inte följa hastighetsgränserna störst och resulterar i 150–200 dödsfall per år. Trafiksäkerhetsproblemet när det gäller dödade i trafiken omfattar 50–100 dödsfall årligen till följd av dålig efter-levnad av de båda andra åtgärderna. Rapporten redovisar inte hur efterefter-levnaden skall ökas. Det finns emellertid interlocksystem för att öka efterlevnaden som alternativ/komplement till ökad övervakning och/eller högre böter.
Dödsrisken ökar med mer än det dubbla genom den bristfälliga efterlevnaden jämfört med den ”exemplariska” förargruppens dödsrisk.
En mycket hög efterlevnad av de tre åtgärderna innebär nästan en halvering av antalet dödade i trafiken. Av intresse är att efterlevnaden inte är slumpmässigt fördelad på de tre åtgärderna. Såväl de förare som anpassar sin körning till de tre åtgärderna som de som samtidigt bryter mot två eller samtliga åtgärder är över-representerade i trafiken.
Det är samtidigt viktigt att sänkt hastighet förstärker övriga trafiksäkerhets-åtgärder. Skattning av alkoholens inverkan är mycket osäker eftersom gränserna för vad som är tillåtet är olika i olika länder.
1 Background
The ability of the police to carry out traffic surveillance has an important role as regards the observance of most traffic safety measures, in particular the three that are most important, observance of the current speed limits, use of the seat belt and sobriety as a driver.
In all cases, observance can be influenced through interlock systems, the effect of which is that it is not possible to drive faster than the speed limit, not possible to drive without using the seat belt, and an alcolock that prevents the driver starting the car if he/she is intoxicated. The three interlock systems are at different stages of development at present.
The calculations made below assume that observance is almost 100% as regards the three measures. Whether this is achieved through interlock systems or more effective police surveillance/higher penalties is not dealt with.
Generally speaking, greater observance results in large traffic safety gains. The report does not examine the way observance is to be increased, or show what resources/expenditure this requires.
The reason that the traffic safety potential is so high is that observance of the measures is inadequate. Driving faster than the speed limit slightly increases risk but this transgression is very usual, driving without a seat belt involves risk and is not very common, and driving while under the influence of drink is unusual but dramatically increases risk.
The report consistently uses the term relative death risk, which implies that the relative increase in death risk, as a result of the lack of observance, is estimated. The term death risk generally refers to the number killed in relation to the volume of traffic.
2 Objective
The objective of the report is to demonstrate the potential traffic safety gains that can be achieved if a solution is found to the problem of observance regarding current speed limits, seat belt use and driver sobriety. The report also gives details of different interlock systems, auxiliary measures associated with the vehicle, which increase observance of the three measures.
3 Speed
regulation
A change in speed causes a change in the accident situation. Higher speed causes more, and more severe, accidents while lower speeds result in fewer and less serious accidents. This relationship is evident when urban and rural areas are compared regarding e.g. the death risk of drivers, which is many times higher in the countryside than in towns. Two thirds of vehicular traffic in Sweden is carried out in rural areas, and 90% of all traffic fatalities occur in the countryside.
Assume that ”number of drivers killed in urban areas” is compared with ”the proportion of vehicular traffic in urban areas”, 10%/33%, and that the same is done for the countryside, 90%/67%, which is 0.3 as against 1.35. The death risk, the number killed as a function of the number of vehicle km, is thus 4.5 times higher in the countryside in spite of the fact that the road environment in the countryside is much safer.
Another way is to compare the number killed per injured motorist on motorways with speed limits of 70, 90 and 110 km/h. On motorways with the speed limit of 70 km/h, 1 out of 100 injured motorists dies. On motorways with the speed limit of 90 km/h, 3 out of 100 injured motorists die, and on motorways with the speed limit of 110 km/h, 6 out of 100 injured motorists die.
There are many investigations of changes in speed and their effect on the number killed and injured, and different summaries show the same results.
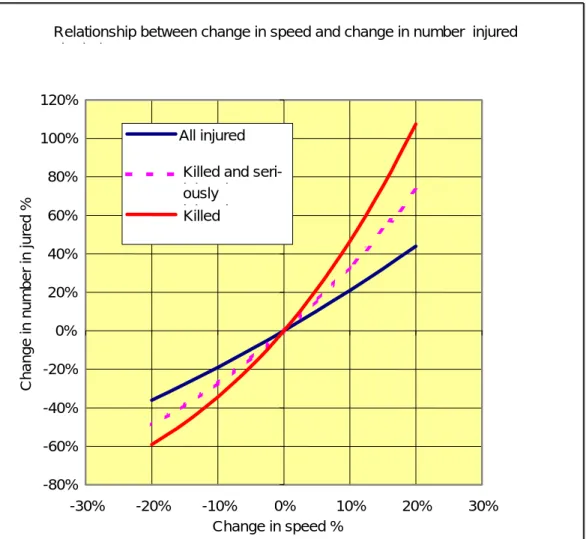
The most comprehensive summary is given in the Norwegian Traffic Safety Manual (Elvik et al., 1997) which shows the relationship between the percentage change in mean speed and the percentage change in the number injured. If the speed changes by 1%, the number of injured changes by 2% and the number of fatalities by 4%.
A similar model is used in the UK, and in Sweden the power model (Nilsson, G, 2000; 2004) has been used. The models produce largely the same results. In the first two models no distinction is made between the number of those injured and the number of injury accidents, while the power model also takes account of the number injured per injury accident. The same applies for the number killed and the number of fatal accidents.
According to the power model, when the speed changes the number of those injured in traffic, irrespective of road user group, changes by the square of the relative change in speed. If the speed drops by 1%, the number of those injured decreases by the factor (1-0.01)2. If the speed increases by 1%, the number of
those injured increases by the factor (1+0.01)2. If the speed changes by 1%, the
probability that an injured person will die also changes by the square of the relative speed, which means that the number of those killed changes by the fourth power of the change in relative speed.
The rule in the UK is that if the speed drops by 1 mph (1.609 km/h), the number of injury accidents decreases by 5%, later modified to 6% in low speed environments, to 4% on ordinary roads in the countryside, and to 3% on high speed roads. This brings the relationship to very close agreement with the power model. The traffic safety effect in the UK, due to the reduction of the speed limit of 30 mph (48 km/h) to 20 mph (32 km/h) in urban areas at the beginning of the 1990s, also agrees with the power model. (Review of traffic calming schemes in 20 mph zones, TRL Report No 215, 1996). An average drop in speed by 37% resulted in a decrease in injury accidents by 58%. According to the estimate by the power model, the reduction in the number of injured is 60%, since (1-0.37)2 =
0.632 = 0.40. For fatal accidents also there is good agreement. The number of fatal
accidents decreased from 8 to 1, which is a reduction of 87.5%. The power model gives (0.63)4 = 0.16, i.e a reduction by 84%! The relationships are also examined
in TRL Report No 511, 2002.
The power model is described below.
Change in traffic safety situation if mean(median) speed is changed from v0 to
v1
Accidents (y) Injured (z)
Fatal accidents Killed
0 4 0 1 1
y
v
v
y
⎟⎟
⎠
⎞
⎜⎜
⎝
⎛
=
(
0 0)
8 0 1 0 4 0 1 1z
y
v
v
y
v
v
z
⎟⎟
−
⎠
⎞
⎜⎜
⎝
⎛
+
⎟⎟
⎠
⎞
⎜⎜
⎝
⎛
=
Fatal and serious injury Killed and seriously accidents injured 0 3 0 1 1
y
v
v
y
⎟⎟
⎠
⎞
⎜⎜
⎝
⎛
=
(
0 0)
6 0 1 0 3 0 1 1z
y
v
v
y
v
v
z
⎟⎟
−
⎠
⎞
⎜⎜
⎝
⎛
+
⎟⎟
⎠
⎞
⎜⎜
⎝
⎛
=
All injury accidents All injured (incl. killed)
0 2 0 1 1
y
v
v
y
⎟⎟
⎠
⎞
⎜⎜
⎝
⎛
=
(
0 0)
4 0 1 0 2 0 1 1z
y
v
v
y
v
v
z
⎟⎟
−
⎠
⎞
⎜⎜
⎝
⎛
+
⎟⎟
⎠
⎞
⎜⎜
⎝
⎛
=
The relationship between the change in speed and the change in the number of injured is illustrated in Fig. 1.
Relationship between change in speed and change in number injured k d d -80% -60% -40% -20% 0% 20% 40% 60% 80% 100% 120% -30% -20% -10% 0% 10% 20% 30% Change in speed % Change in n u mber in jured % All injured Killed and seri- i j d
ously i j d Killed
Figure 1 Illustration of relationship according to the power model between
change in speed and change in the number killed and seriously injured.
In the calculations in Chapter 7 it is assumed that the mean speed is reduced by 10% if the speed limits are observed, and therefore the number of fatal accidents decreases by 34.4%. This means that the number of fatal accidents today is 52% higher than it would be if everybody observed the speed limits.
4
Seat belt use
According to various national laws, seat belts must be installed in the vehicle fleet in most countries. In most of these countries, it is also a legal requirement that the belt must be worn when the vehicle is in motion. This measure has been characterised as the safety measure of the (20th) century, and its effect is stated to be that the risk of being killed is reduced by 50% if the seat belt is worn. Today there are supplementary devices such as air bags etc which make the use of the seat belt even more important. The ”belt effect” is greater for drivers and front seat passengers than for rear seat passengers. The traffic safety effect is also the greater, the lower the speed. Japan is one of the countries that states whether those injured have, or have not, worn the seat belt, and it is also the country where there are few missing data. It is also found that the death risk for injured drivers is 15 times greater for those injured drivers who did not wear a seat belt than for those drivers who did.
A motorist without a belt has a generally greater risk, so that a reduction by 80% in the death risk may be assumed reasonable for drivers, i.e. a driver without a belt has a death risk 5 times higher than a driver who is wearing a belt. It is reasonable to assume that the death risk is 4 times higher for unbelted front seat passengers and 3 times higher for unbelted rear seat passengers. Use in Japan is the same in the front seat as in Sweden. Finnish estimates from their accident investigations show about the same results.
The use of seat belts in Sweden is very high in environments with high speeds, motorways and the countryside, where the actual number of injured in relation to the number of vehicle km is very low, but where a high proportion of those injured die. In urban environments and mainly in housing areas where the protective effect of wearing a seat belt is 100%, belt use is low, perhaps down to 50%. However, the total proportion of vehicle km in housing areas is relatively low. On average, belt use in the front seat is 90%, as shown by VTI measurements (Cedersund, Hans-Åke, 2003) and the annual traffic safety survey of the Swedish Road Administration.
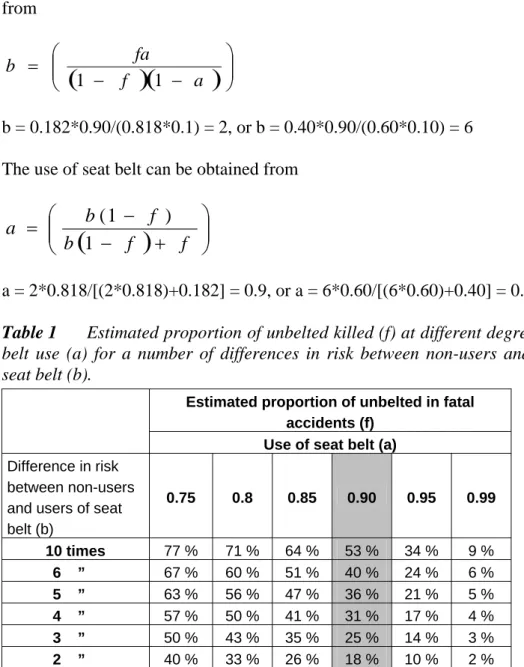
The in-depth studies of fatal accidents made in Sweden show that in about 40% of fatalities in cars the seat belt is not worn. If 10% do not wear a belt, the difference in risk is 40%/10% as against 60%/90%, i.e. 4 as against 0.67, which means that unbelted Swedish motorists run a death risk that is 6 times higher. Danish data show the same results, despite a large proportion of missing data concerning seat belt use. The proportion of motorists who had not worn a seat belt and who are killed is shown below, with reference to the known difference in death risk between those who have worn a seat belt and those who have not.
The proportion of motorists who are killed and are not wearing a seat belt is f where
)
)
0
,
1
(
/(
)
0
,
1
(
a
b
a
a
b
f
=
−
−
+
where a is the proportion who are not wearing a belt and b is the multiplicative increase in death risk if the seat belt is not worn. In Sweden it is assumed that the proportion of motorists who wear the seat belt is 90% (0.9), and that the risk of being killed when not wearing a seat belt is doubled
f = 2(1.0-0.9)/(2(1.0-0.9)+0.9) = 0.2/1.1 = 0.182
If the death risk for unbelted motorists is 6 times greater than for belted motorists,
f = 6(1.0-0.9)/(6(1.0-0.9)+0.9) = 0.6/1.5 = 0.40
which means that 40% of those killed were not wearing a belt.
The effect of wearing a seat belt is probably a little greater than a halving of the death risk. This result originates from periods when the seat belt was introduced. Today, the seat belt has been developed and combined with air bags. It is thus open to discussion whether the death risk increases 2, 3 or 4 times if the seat belt is not worn.
The equation can be derived as follows:
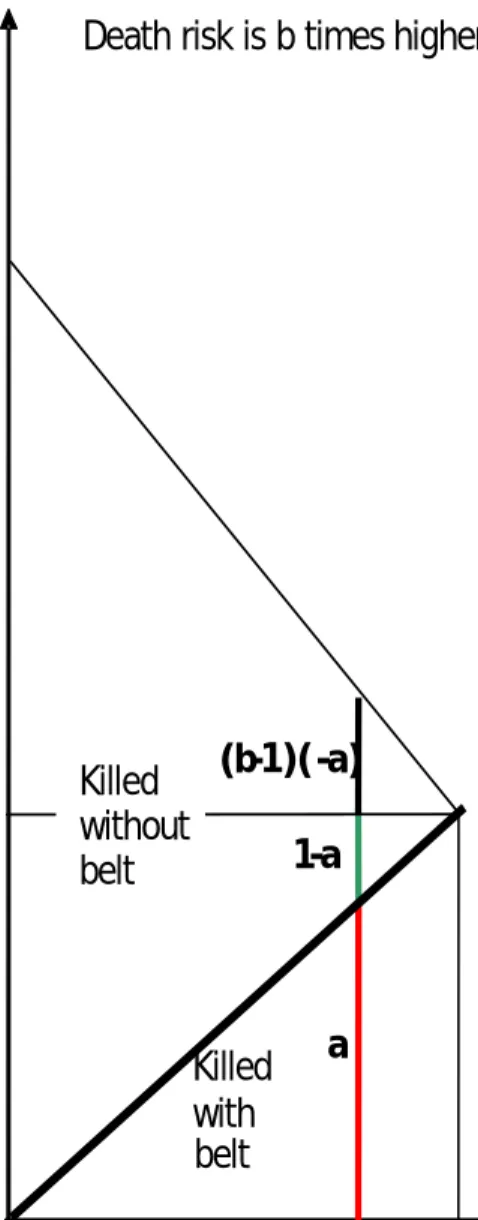
Figure 2 Proportion killed with seat belt and proportion killed without seat belt
when proportion of belt users = a. At level a on the x axis, the line up to the diagonal line represents the number killed with a belt. The continuation of the line to the upper line represents those killed without a belt. The sought death risk for those without a belt is given by the length of the upper segment, 1-a+(b-1)(1-a), divided by the total length of the line, a+1-a+(b-1)(1-a).
a Killed with belt (b-1)(-a) 1-a
Death risk is b times higher for non-users
No of killed motorists if all had worn belt
b
Killed without belt1,0
0
a
1,0
Proportion who wear belt
The increase in death risk if a seat belt is not worn (by b times) can be obtained from
(
)(
)
⎟⎟⎠⎞ ⎜⎜ ⎝ ⎛ − − = a f fa b 1 1 b = 0.182*0.90/(0.818*0.1) = 2, or b = 0.40*0.90/(0.60*0.10) = 6The use of seat belt can be obtained from
(
)
⎟⎟ ⎠ ⎞ ⎜⎜ ⎝ ⎛ + − − = f f b f b a 1 ) 1 ( a = 2*0.818/[(2*0.818)+0.182] = 0.9, or a = 6*0.60/[(6*0.60)+0.40] = 0.9Table 1 Estimated proportion of unbelted killed (f) at different degrees of seat belt use (a) for a number of differences in risk between non-users and users of seat belt (b).
Estimated proportion of unbelted in fatal accidents (f)
Use of seat belt (a)
Difference in risk between non-users and users of seat belt (b) 0.75 0.8 0.85 0.90 0.95 0.99 10 times 77 % 71 % 64 % 53 % 34 % 9 % 6 ” 67 % 60 % 51 % 40 % 24 % 6 % 5 ” 63 % 56 % 47 % 36 % 21 % 5 % 4 ” 57 % 50 % 41 % 31 % 17 % 4 % 3 ” 50 % 43 % 35 % 25 % 14 % 3 % 2 ” 40 % 33 % 26 % 18 % 10 % 2 %
Estimates today of the proportion of those killed without a belt (40%) state that those without a belt run a death risk 6 times higher than those who wear a belt, which was also shown initially. The difference between the doubled risk which is used to describe the probability of being killed if a seat belt is worn, and the difference between non-users and users in traffic, means that the groups are also different as regards the risk of being killed in traffic. As seat belt use increases, this would mean that the difference in death risk between the groups would further increase. It is probable that this is not the whole explanation, since seat belt use varies with the speed environment. To some extent, the difference depends on how the non-users are distributed over the different speed environments, and their choice of vehicle. If the users were located in the countryside and drove cars, and the non-users were located in urban areas and drove lorries, the death risk would be much higher in the countryside than in
urb
rson who does not wear a belt runs twice the death risk than if he or she had worn a belt, which is presumably an underestimate of the difference in death risk.
an areas. In 2001, 319 motorists were killed in the countryside and 80 in urban areas.
In the calculations in Chapter 7 it is assumed that 40% of the motorists killed in traffic have not worn a seat belt and that a pe
5
Alcohol and driving
Compared with many other countries, Swedish legislation is strict with regard to driving and the blood alcohol content of the driver. According to official accident statistics, the number of drivers in fatal accidents who are found to have a blood alcohol content in excess of 0.2‰ is 50–60 annually. An alcolock is an interlock system in which the driver must blow into an alcolock before he/she can start the car. The car will not start if the person who has blown into the alcolock is affected by alcohol. The alcolock is available and is used as an accessory to Swedish legislation as a measure that enables a person who has been found in traffic with a high alcohol content to keep his/her driving licence. Approximately 2‰ of drivers in traffic have alcohol content higher than 0.2‰.
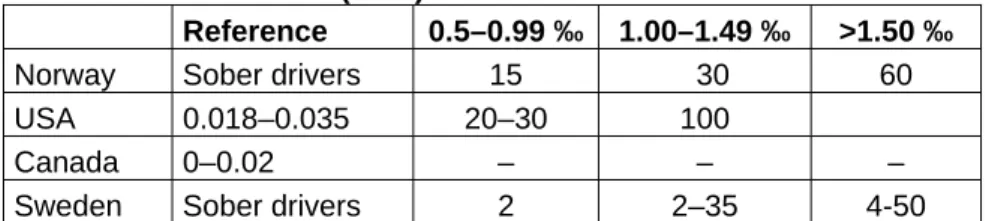
The Traffic Safety Manual (Maycock, G., 1997, Stewart, D. E., 1998 and Andersson et al., 1995) shows how the death risk is altered with increased blood alcohol content, by comparing the blood alcohol contents of drivers in fatal accidents with the blood alcohol content of a selection of drivers in roadside interviews. On the basis of this information, an estimate is made of the risk that an intoxicated driver runs of being involved in a fatal accident, compared with a driver who is ”sober” according to the legislation.
Table 2 Relationship between intoxicated drivers and ”sober” drivers
regarding injury accident risk, death risk and the relationship between death risk and injury accident risk.
Increase in injury accident risk for groups of intoxicated drivers with different blood alcohol contents (in ‰)
Reference 0.5–0.99 ‰ 1.00–1.49 ‰ >1.50 ‰
Norway Sober drivers 15 30 60
USA 0.018–0.035 20–30 100
Canada 0–0.02 – – –
Sweden Sober drivers 2 2–35 4-50
Increase in death risk for groups of intoxicated drivers with different blood alcohol contents (in ‰)
Reference 0.5–0.99 ‰ 1.00–1.49 ‰ >1.50 ‰
Norway Sober drivers 20 100 900
USA 0.018–0.035 100–150 750
Canada 0–0.02 10–20 25–30 110
Sweden Sober drivers * 80–160 *
* Intoxicated drivers
Increase in ”death risk/injury accident risk” for groups of intoxicated drivers with different blood alcohol contents (in ‰)
Reference 0.5–0.99 ‰ 1.00–1.49 ‰ >1.50 ‰
Norway Sober drivers 1.3 3.3 15
USA 0.018–0.035 5 7.5
Canada 0–0.02 – – –
Sweden Sober drivers >5
For drivers with high blood alcohol contents, the death risk increases at a faster rate than the injury accident risk. At the same time, it is difficult to estimate the proportion of drivers in traffic who have very high blood alcohol contents. Compared with a sober driver, the death risk of an intoxicated driver increases, on average, more than 5 times faster than the injury accident risk.
In Sweden, the death risk run by the group ”intoxicated drivers” is more than 50 times greater than that run by the group ”sober divers” [(60 killed in accidents with an intoxicated driver/0.2% of drivers) / (523 killed in accidents with sober drivers/99.8% of drivers) = 300/5.24 = 57.3], based on the assumption that 2 ‰ of drivers are intoxicated.
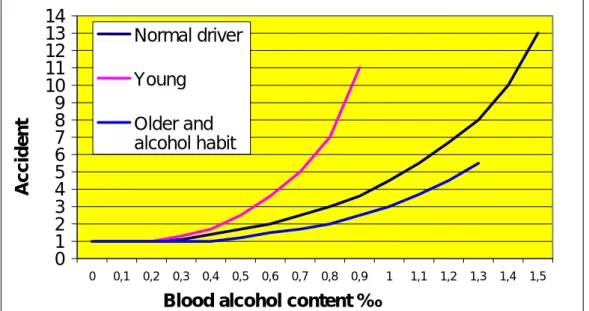
The relationship between blood alcohol content and accident risk, from a British investigation, is given in Figure 3.
0 1 2 3 4 5 6 7 8 9 10 11 12 13 14 0 0,1 0,2 0,3 0,4 0,5 0,6 0,7 0,8 0,9 1 1,1 1,2 1,3 1,4 1,5
Blood alcohol content ‰
A ccident Normal driver Young Older and alcohol habit
Figure 3 Accident risk and blood alcohol content, from TRL Leaflet No LF762.
In the calculations in Chapter 7 it is assumed that the death risk run by a driver who is intoxicated increases 10 times compared with the situation when he/she is sober, which is probably an underestimation.
The difficulty as regards seat belt use and intoxication among drivers lies in judging whether the drivers who have died in traffic without wearing the seat belt would have survived if they had worn the belt, or whether intoxicated drivers who have been involved in fatal accidents would have avoided the fatal accident if they had been sober.
6 How is ”full” observance achieved – Is an
interlock system needed?
For most drivers, it is natural to observe the speed limit, to wear the seat belt and to refrain from driving when they are intoxicated. However, observance of the current speed limits varies among drivers and may be considered to be very imperfect at times. The use of seat belts is slowly approaching 100%. According to the annual traffic safety investigation of the Swedish Road Administration, about 95% of car drivers in the countryside wear a belt today. The use of seat belts on short journeys in urban areas is much lower (NTF seat belt surveys, 2002). Often, most of the drivers who do not wear a belt have no special reason for their omission (Dahlstedt, Sven, 1999).
Sobriety when driving is firmly established in Sweden. About 0.2 ‰ of drivers are under the influence of alcohol while driving. Internationally, this is a very low figure. However, the fact that, on average, 2 out of 1,000 drivers have a blood alcohol content in excess of 0.2 gramme per ml of blood is considered to be a very serious traffic safety problem. Every one of those who drive too fast, do not wear a seat belt and drive while under the influence of alcohol poses a serious traffic safety problem owing to the imperfect observance of each one of these three measures.
In recent years, the scope of the traditional measures information, surveillance and penalties has been gradually reduced. The activity of various media in society has considerably increased, but traffic safety information has diminished. The police has been reorganised, and as a consequence there are fewer traffic police. The penalties for speeding have been marginally changed in recent decades, and the penalty for a motorist found without a seat belt was increased in 2000 from SEK 300 to SEK 600. However, since the previous penalty was introduced in 1975, prices have increased by 300%. What this means, on the whole, is that it has become cheaper to violate different traffic safety regulations. As the economic consequences of a traffic violation decrease, the perception of road users regarding the significance of the measures for traffic safety diminishes.
The above three measures are associated with both the driver and the vehicle, but may also be measures to do only with the vehicle. The necessary aid for the driver to travel at the desired speed (a speed that does not result in police action) was provided many years ago in the form of the speed controller. This equipment is often included as an accessory in new cars. There are few drivers who use this aid regularly. There is today vehicle equipment at the research stage which detects the speed limit applicable to the road the vehicle is on, and makes the speed limit the maximum speed of the vehicle. Studies have been made with different groups of vehicles (ISA project).
For heavy vehicles in the EU countries, an interlock system is generally available which limits the speed of heavy lorries to 87 km/h and that of buses to 97 km/h. The corresponding system must be introduced for cars, but the problem here is that the car makers cannot agree since this would nullify the important sales appeals of engine power and top speed. Since cars now have electronic fuel injection, it is very easy to introduce the measure in production. This, however, does not solve compliance with lower speed limits. As regards speed limits, it is certain that some form of interlock system will be developed and fitted within the next 10-20 years. Until this has been done, the police have developed an automatic speed surveillance system. However, a speed violation must be brought
home to the driver, and this requires identification. If the owner were to be made liable, this could be done automatically via the vehicle registration system.
The interest of the automotive industry in an interlock system for seat belt use is characterised by reminding the driver to buckle up, instead of forcing the driver to do so. This demonstrates the gap between the interest of society in traffic safety (laws without exceptions) and the interest of the industry in individual drivers. There is nothing to stop the automotive industry developing a seat belt lock as an ignition lock, or using the equipment that is already available to check that the seat belt has been engaged by the driver before the car can be started. It is evident that seat belt use would increase, even though some people would ”cheat”. Such cheating could however be dealt with by the insurance companies. Today, investments are again made in seat belt reminders which were introduced in the 1980s and have without a doubt contributed to the relatively high seat belt use among Volvo and Saab drivers. Here, it is not a matter of cost for the automotive industry, but only a different approach. Such an interlock system can be introduced within a few years. Police surveillance of seat belt use is traditionally carried out by stopping the vehicle.
The best developed interlock system is directed at intoxicated drivers. Swedish legislation recognises the interlock system as a measure to enable drivers who have lost their licence because of drink driving to get their licence back. They can get the licence back if they fit an alcolock in their car and undertake to remain under medical surveillance. The alcolock is also used generally to a moderate extent in the transport vehicles of various firms.
The alcolock in the car fleet is a realistic development. The attitude, mainly within the automotive industry, must however change radically. Restaurants and similar places must perhaps introduce some kind of ”travel service”. In recent years, alcohol has become both easier to obtain and cheaper. It is therefore essential that we should continue making a clear distinction between driving and alcohol consumption. The alcolock is a long term measure and, when used frequently, involves an increased cost that is of the same order as that of the spare wheel which comes with a new car. Alcolocks are already available and can be fitted without delay as accessories in both old and new cars.
Surveillance of drink driving is carried out by the police through more than one million breathalyser tests each year. The method is effective and fully acceptable to road users. The intention is that the breathalyser test should to the highest possible degree be carried out at random, and that drivers should be likely to be stopped for this anywhere and at any time.
The automotive industry can be instrumental in increasing traffic safety in society to a much greater degree than before. One hope is that the enlarged EU can help make this come about. The interlock systems described above may be a condition for the Euro NCAP test. This is applicable today for seat belt reminders.
To sum up, an interlock system for seat belt use would probably be cheaper than the reminder systems introduced today, at least for the driver.
Once it becomes a standard, an alcolock should cost a few thousand SEK. At present, the equipment can be fitted on loan for two years for SEK 14,000 and can then be purchased for SEK 5,000.
Interlock systems for compliance with speed limits have been tested in the ISA project. The technology is available, but requires a supporting system in the form of GPS or sensors in the road environment that transmit information on the speed
limit to the car. Controlling the maximum speed of cars is very simple and cheap, since fuel injection is now performed electronically.
7
Speed control, seat belt use and alcolock
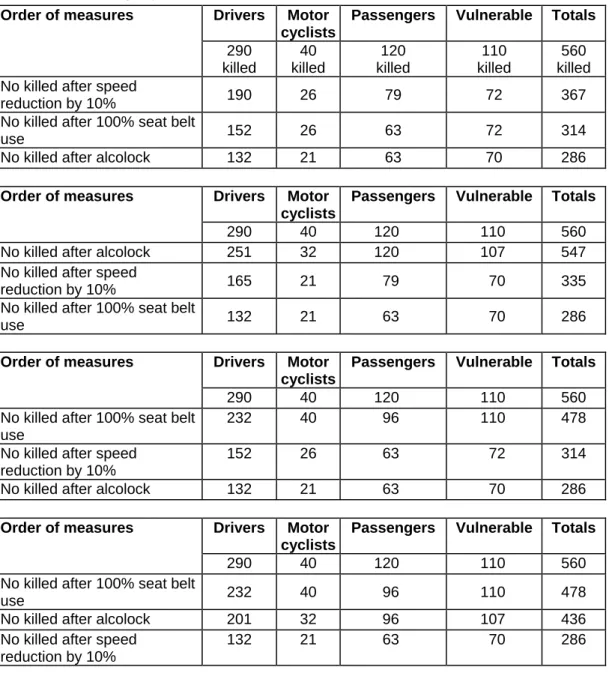
It does not matter in what order measures are taken. Some cases where the effect of the measures is a reduction of speed by 10%, which results in a 34.4% reduction in fatalities, are shown below. If the use of seat belts increases by 100%, the death risk decreases by 50% among that proportion of drivers who did not wear a belt in fatal accidents (40%). An alcolock completely eliminates the number of intoxicated drivers. If we begin with speed reduction, this results in a decrease in the number killed from 560 (number killed in 2002) to approximately 370, i.e. a reduction by one third in the number of fatalities. The data are broken down by drivers, motor cyclists, passengers and vulnerable road users (pedestrians, cyclists and moped drivers) who have been killed in traffic. Overall, when all three measures are fully observed, the number of fatalities is reduced by almost 50%.
Table 3 Introduction of the measures, with the speed regulations, use of seat
belt and alcolock fully observed.
Order of measures Drivers Motor cyclists
Passengers Vulnerable Totals
290 killed 40 killed 120 killed 110 killed 560 killed No killed after speed
reduction by 10% 190 26 79 72 367
No killed after 100% seat belt
use 152 26 63 72 314
No killed after alcolock 132 21 63 70 286
Order of measures Drivers Motor cyclists
Passengers Vulnerable Totals
290 40 120 110 560
No killed after alcolock 251 32 120 107 547
No killed after speed
reduction by 10% 165 21 79 70 335
No killed after 100% seat belt
use 132 21 63 70 286
Order of measures Drivers Motor cyclists
Passengers Vulnerable Totals
290 40 120 110 560
No killed after 100% seat belt use
232 40 96 110 478
No killed after speed reduction by 10%
152 26 63 72 314
No killed after alcolock 132 21 63 70 286
Order of measures Drivers Motor cyclists
Passengers Vulnerable Totals
290 40 120 110 560
No killed after 100% seat belt
use 232 40 96 110 478
No killed after alcolock 201 32 96 107 436
No killed after speed reduction by 10%
132 21 63 70 286
The above calculations can be supplemented by several measures if their percentage effect is known from (Original number killed)*(
∏
⎟⎠ ⎞ ⎜ ⎝ ⎛ − − n αi 1 100 1 1 ),
where αi is the percentage effect of the i th measure.
If we assume that 60% of traffic ”violates” the current speed limits, 10% of drivers do not wear a seat belt and 2 ‰ are intoxicated, we have, quite at random, that (0.6*0.1*0.002=0.00012) 0.012% of vehicular traffic, i.e. 12 out of 100,000 drivers, violates all three ”regulations” at random and can be regarded as ”non-exemplary”.
The various combinations that can occur between the group of ”exemplary” drivers who observe the speed limits, wear a belt and are sober (line 1), and the other groups of drivers, are set out in Table 4.
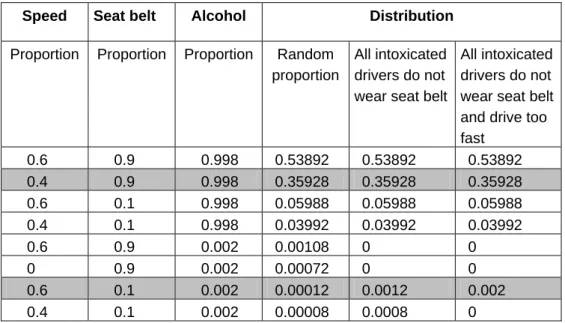
Table 4 Random distribution of ”driver populations”, broken down by all
regulations according to observance, on the assumption that all intoxicated drivers drive without a seat belt, and that they drive too fast without a seat belt.
Speed Seat belt Alcohol Distribution
Proportion Proportion Proportion Random proportion
All intoxicated drivers do not wear seat belt
All intoxicated drivers do not wear seat belt and drive too fast 0.6 0.9 0.998 0.53892 0.53892 0.53892 0.4 0.9 0.998 0.35928 0.35928 0.35928 0.6 0.1 0.998 0.05988 0.05988 0.05988 0.4 0.1 0.998 0.03992 0.03992 0.03992 0.6 0.9 0.002 0.00108 0 0 0 0.9 0.002 0.00072 0 0 0.6 0.1 0.002 0.00012 0.0012 0.002 0.4 0.1 0.002 0.00008 0.0008 0
In rows 5 and 6, all are wearing belts and are intoxicated. The last two rows contain all who do not wear a seat belt and are intoxicated. If we assume that the intoxicated drivers do not wear a seat belt, they will be 10 times more usual than according to the random distribution. If, in addition, they always drive too fast, they will occur 16.7 times more often than in the random distribution. The sober groups are not affected.
The question now is how the difference in relative death risk is distributed over the last four rows in Table 5. These rows contain the combinations where the drivers are intoxicated.
Table 5 sets out the relative risks for present behaviour compared with full observance; the risk is 1.52 times higher compared with the case where speed was reduced by 10%, the risk is twice as high for those who do not wear a seat belt, and the risk is 10 times higher for those who have an illegal blood alcohol content compared with those who are sober when driving. The total risk is obtained by
multiplying the risks for the three different behaviours and the different combinations.
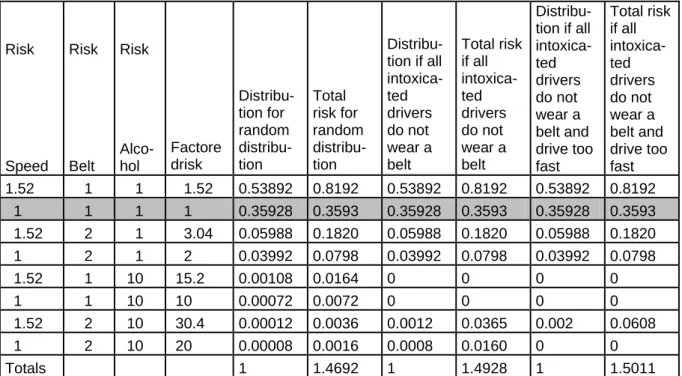
Table 5 Distribution of difference in death risk between different driver
populations, and the death risk for different driver populations according to the random distribution.
Risk Risk Risk
Speed Belt Alco-hol Factore drisk Distribu-tion for random distribu- tion Total risk for random distribu- tion Distribu-tion if all intoxica-ted drivers do not wear a belt Total risk if all intoxica-ted drivers do not wear a belt Distribu-tion if all intoxica- ted drivers do not wear a belt and drive too fast Total risk if all intoxica- ted drivers do not wear a belt and drive too fast 1.52 1 1 1.52 0.53892 0.8192 0.53892 0.8192 0.53892 0.8192 1 1 1 1 0.35928 0.3593 0.35928 0.3593 0.35928 0.3593 1.52 2 1 3.04 0.05988 0.1820 0.05988 0.1820 0.05988 0.1820 1 2 1 2 0.03992 0.0798 0.03992 0.0798 0.03992 0.0798 1.52 1 10 15.2 0.00108 0.0164 0 0 0 0 1 1 10 10 0.00072 0.0072 0 0 0 0 1.52 2 10 30.4 0.00012 0.0036 0.0012 0.0365 0.002 0.0608 1 2 10 20 0.00008 0.0016 0.0008 0.0160 0 0 Totals 1 1.4692 1 1.4928 1 1.5011
If the ”non-exemplary” driver is intoxicated when driving, does not wear a seat belt and drives too fast, his/her risk of being killed is 30 times that for the ”exemplary” driver. Since the ”exemplary” driver has the relative death risk 1.0, the ”average driver” runs a death risk that is 1.46–1.50 times greater.
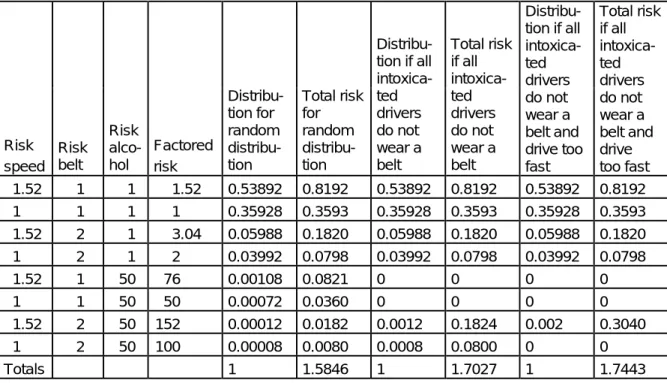
If we assume that alcohol increases the death risk 50 times, this means that the total risk increases to 1.58–1.74 times compared with the ”exemplary” driver, owing to the occurrence of drivers who do not observe the various measures; see Table 6.
Table 6. Distribution of the difference in death risk for different driver populations, with
reference to the random distribution and the fact that alcohol increases death risk 50 times Risk speed Risk belt Risk alco-hol Factored risk Distribu- tion for random distribu- tion Total risk for random distribu-tion Distribu-tion if all intoxica-ted drivers do not wear a belt Total risk if all intoxica-ted drivers do not wear a belt Distribu- tion if all intoxica- ted drivers do not wear a belt and drive too fast Total risk if all intoxica-ted drivers do not wear a belt and drive too fast 1.52 1 1 1.52 0.53892 0.8192 0.53892 0.8192 0.53892 0.8192 1 1 1 1 0.35928 0.3593 0.35928 0.3593 0.35928 0.3593 1.52 2 1 3.04 0.05988 0.1820 0.05988 0.1820 0.05988 0.1820 1 2 1 2 0.03992 0.0798 0.03992 0.0798 0.03992 0.0798 1.52 1 50 76 0.00108 0.0821 0 0 0 0 1 1 50 50 0.00072 0.0360 0 0 0 0 1.52 2 50 152 0.00012 0.0182 0.0012 0.1824 0.002 0.3040 1 2 50 100 0.00008 0.0080 0.0008 0.0800 0 0 Totals 1 1.5846 1 1.7027 1 1.7443
Every year, the Swedish Road Administration circulates a traffic safety questionnaire. This poses questions concerning seat belt use, alcohol habits and the attitude regarding speed limits.
Seat belt:
• ”How often do you wear a seat belt when you travel in a car and sit in the front seat?”
Alcohol:
• ”Has there been a time during the recent months that you have driven a car after drinking alcohol?"
Speed:
• ”It is more important to keep up with the traffic than to observe the speed limits.”
• ”The existing speed limits are so low that it is under stable that they are exceeded”.
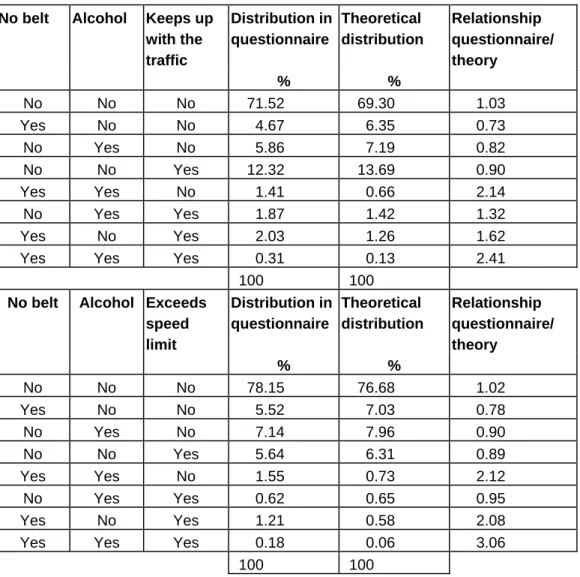
Table 7 sets out the answers received to each of the questions, and the occurrence of different combinations of replies, with reference to independent distributions of the individual questions and the actual distributions in the investigation. It is only seat belt use that agrees with the previously used figures.
Table 7 The distribution of the respondents over the risk factors No belt, Alcohol and Speed, and the combinations of these risk factors. No belt 8.4%,
Alcohol 9.4%, Keeps up with the traffic 16.5%. Exceeds speed limit 7.6%. If the figure in the last column exceeds 1.0, the combination is overrepresented. Note that the ”exemplary” group is in row 1.
No belt Alcohol Keeps up with the traffic Distribution in questionnaire Theoretical distribution Relationship questionnaire/ theory % % No No No 71.52 69.30 1.03 Yes No No 4.67 6.35 0.73 No Yes No 5.86 7.19 0.82 No No Yes 12.32 13.69 0.90 Yes Yes No 1.41 0.66 2.14 No Yes Yes 1.87 1.42 1.32 Yes No Yes 2.03 1.26 1.62
Yes Yes Yes 0.31 0.13 2.41
100 100
No belt Alcohol Exceeds speed limit Distribution in questionnaire Theoretical distribution Relationship questionnaire/ theory % % No No No 78.15 76.68 1.02 Yes No No 5.52 7.03 0.78 No Yes No 7.14 7.96 0.90 No No Yes 5.64 6.31 0.89 Yes Yes No 1.55 0.73 2.12 No Yes Yes 0.62 0.65 0.95 Yes No Yes 1.21 0.58 2.08
Yes Yes Yes 0.18 0.06 3.06
100 100
The questions above cannot be directly converted into risk factors in a traffic accident, but they illustrate the problem concerning the correlation between risk factors.
The combination ”No belt” (Yes) and ”Alcohol” (Yes) and ”Keeps up with the traffic/Exceeds speed limit” (Yes) exhibits a higher estimated concentration (0.31% and 0.18%) than what is theoretically probable in view of the individual distributions (0.13% and 0.06%). The proportion is thus 2.5–3 times greater than what is expected if there is no dependence relationship between the factors. When one of the factors occurs and the other two do not, the group is underrepresented. When none of the factors occurs, the group is overrepresented. It is evident that there is a positive correlation concerning those who do not use the seat belt and have drunk alcohol in conjunction with driving during the recent months. But there is also a negative correlation, which means that those who exceed the speed limit and wear a seat belt are fewer than expected irrespective of intoxication.
Both the ”exemplary” and ”non-exemplary” group are overrepresented. The same applies to groups where two of the factors from the ”non-exemplary” group
are represented, except possibly that those who have drunk alcohol do not state that they drive too fast. The risk distribution is set out in Tables 8 and 9.
Table 8 Risk distribution according to the Swedish Road Administration traffic
safety investigation, Alternative 1 in Table 7.
Risk speed Risk belt Risk alcohol Factored
risk Distribution Total risk
1.52 1 1 1.52 0.0564 0.085728 1 1 1 1 0.7815 0.7815 1.52 2 1 3.04 0.0155 0.04712 1 2 1 2 0.0552 0.1104 1.52 1 10 15.2 0.0121 0.18392 1 1 10 10 0.0714 0.714 1.52 2 10 30.4 0.0018 0.05472 1 2 10 20 0.0062 0.124 1.0001 2.101388
Table 9 Changes in risk according to the Swedish Road Administration traffic
safety investigation, Alternative 2 in Table 7.
Risk speed Risk belt Risk alcohol Factored
risk Distribution Total risk
1.52 1 1 1.52 0.1232 0.187264 1 1 1 1 0.7152 0.7152 1.52 2 1 3.04 0.0141 0.042864 1 2 1 2 0.0467 0.0934 1.52 1 10 15.2 0.0203 0.30856 1 1 10 10 0.0586 0.586 1.52 2 10 30.4 0.0031 0.09424 1 2 10 20 0.0187 0.374 0.9999 2.401528
The death risk is thus more than twice as high owing to the imperfect observance of the three measures. The total death risk is 2.1–2.4 times higher than for the ”exemplary” driver group.
8 Relationship between measures – Speeds, seat
belt, etc.
Lower speeds would increase the traffic safety effect of seat belt use for motorists. The number killed would decrease, and at the same time the belt would save a higher proportion of motorists from being killed. The combination lower speeds and increased seat belt use should be prioritised, since it primarily applies to drivers who represent one half of traffic fatalities and a constantly increasing proportion of those killed in traffic.
We assume that the seat belt effect for motorists decreases by 1/(Speed)2 and
the death risk increases by (Speed)4. We assume that speed is 80 km/h. At
65 km/h, the belt effect is 100%. Without a seat belt, and if the speed alone had been reduced from 80 to 65 km/h, the number killed would have decreased by 56%. With a seat belt, nobody would have been killed. If speed rises from 80 to 100 km/h with seat belt, the death risk increases by 66%, and by 144% without seat belt, since the belt effect at the speed 100 km/h is not 50% but only 32%.
Table 10 Theoretical relationship between speed and belt effect, 50 % reduction
in death risk at 80 km/h, and death risk at 100 % belt use.
Speed
(km/h) Belt effect Speed effect
Remaining traffic safety problem 100 0.32 2.44 1.66 95 0.35 1.99 1.28 90 0.40 1.60 0.97 85 0.44 1.27 0.71 80 0.50 1.00 0.50 75 0.57 0.77 0.33 70 0.74 0.59 0.15 65 1.00 0.44 0.00
The above is an illustration of the simultaneous effect of two traffic safety measures. If, in the example, we raise speed from 80 to 90 km/h, the number killed increases by 60% but, since the belt effect at the same time decreases by 20%, the total effect is that the number killed increases by 94%. These relationships are seldom studied. Belt use is probably also dependent on speed. The higher the speed, the more drivers/passengers use the belt. This is shown in Table 11.
Table 11 Theoretical relationship between speed and belt effect and belt use,
50 % decrease in death risk and 95 % belt use at 80 km/h, and death risk.
Speed (km/h)
Seat belt
use Belt effect Speed effect
Remaining traffic safety problem 100 0.99 0.32 2.44 1.68 95 0.98 0.35 1.99 1.32 90 0.97 0.4 1.6 0.99 85 0.96 0.44 1.27 0.74 80 0.95 0.5 1 0.53 75 0.94 0.57 0.77 0.35 70 0.93 0.74 0.59 0.16 65 0.92 1 0.44 0.00
The belt effect is probably greater than that assumed, since about 40% of motorists who are killed do not wear a belt. The unbelted motorists make up 10% of motorists. The difference in death risk between those who do not, and do, wear a seat belt is as follows: 40% killed non-users/10% of drivers as against 60% killed users/90% of drivers, means that the death risk of those who do not wear a seat belt is 6 times that of those who do wear a belt.
There is another aspect, the age of the motorist or driver. Leonard Evans has shown that the probability of dying from one’s injuries in a traffic accident increases by about 2.5% per year of age from 20 years onwards. This means that a 60 year old person has twice the death risk of a 20 year old person. The mean age of drivers will increase over the next few years; this can be compensated for by reduced speeds or by increased seat belt use.
9 References
Alkolock (www.vv.se/traf-sak/trafiknykterhet/pagaende-forsok/alkolas.shtml) Andersson, G. et al. Reformer och trafiksäkerhetspotentialer. (Reforms and
traffic safety potentials). (In Swedish). VTI notat 31-1995. Swedish National Road and Transport Research Institute. Linköping. 1995.
Cedersund, H-Å. Bilbältesanvändning i Sverige 2002. (Seat belt use in Sweden in 2002). (In Swedish). VTI meddelande 945, Swedish National Road and Transport Research Institute. Linköping. 2003.
Dahlstedt, S. Icke-användares motiv för att inte använda bilbältet. (Reasons given by non-users for not wearing the seat belt). (In Swedish). VTI Rapport 417. Swedish National Road and Transport Research Institute. Linköping. 1999.
Dahlstedt, S. Perception of some seat belt reminder sounds. VTI notat 77A-2001. Swedish National Road and Transport Research Institute. Linköping. 2001.
Evans, L. & Gerrish, P.H. Gender and age influence on fatality risk from the
same physical impact determined using two-car crashes. Society of
Automotive Engineers. 2001.
Elvik, R. et al. Trafikksikkerhetshåndbok. (Traffic safety manual). (In Norwegian). Transportøkonomisk institut 1977.
Vägverket. Intelligent Stöd för Anpassning av hastighet (ISA). Resultat av
storskalig försöksverksamhet i Borlänge, Lidköping, Lund och Umeå under perioden 1999–2002. (Intelligent support for speed adjustment. Result
of large scale experimental work at Borlänge, Lidköping, Lund and Umeå over the period 1999–2002). (In Swedish). Swedish Road Administration. Publication No 2002:89.
Larsson, J. & Nilsson, G. Bältespåminnare: En lönsam trafiksäkerhetsåtgärd? (Seat belt reminders: A profitable traffic safety measure?). (In Swedish). VTI notat 62-2000. Swedish National Road and Transport Research Institute. Linköping. 2000.
Maycock, G. Drinking and Driving in Great Britain: A review. TRL Report 232, 1997.
Nilsson, G. et al. Några trafiksäkerhetsåtgärder och samhällsekonomi. (Some traffic safety measures and macro economy). (In Swedish). VTI notat 71-2001. Swedish National Road and Transport Research Institute. Linköping. 2001. Nilsson, G. Hastighetsförändringar och trafiksäkerhetseffekter
“Potens-modellen”. (Speed changes and traffic safety effects. The power model). (In
Swedish). VTI notat 76-2000. Swedish National Road and Transport Research Institute. Linköping. 2000.
Nilsson, G. Traffic Safety Dimensions and the Power Model to Describe the
Effect of Speed on Safety. Bulletin 221, Lund Institute of Technology,
Department of Technology and Society, Lund University. 2004.
NTF bilbältesmätningar 2002 (Seat belt surveys). (In Swedish).(www.ntf.se) Steward, D.E. The risk of death associated with drinking and driving in
Canada. An evaluation of the problem over the past two decades. VTI
Conference 1998:9A:4. Swedish National Road and Transport Research Institute. Linköping. 1989.
Taylor M.C. et al. The relationship betwen speed and accidents on rural
single-carriageway roads. TRL Report TRL511, 2002. Transport Research
Laboratory, England.
Vägverket. Vägverkets trafiksäkerhetsundersökning 2001. (Swedish Road Administration Traffic Safety Survey). (In Swedish). Borlänge. 2001.