http://www.diva-portal.org
Postprint
This is the accepted version of a paper published in Journal of Advanced Nursing. This paper has been peer-reviewed but does not include the final publisher proof-corrections or journal pagination.
Citation for the original published paper (version of record):
Eriksson, K., Wikström, L., Fridlund, B., Årestedt, K., Broström, A. (2017)
Association of pain ratings with the prediction of early physical recovery after general and orthopaedic surgery - A quantitative study with repeated measures.
Journal of Advanced Nursing, 73(11): 2664-2675
https://doi.org/10.1111/jan.13331
Access to the published version may require subscription. N.B. When citing this work, cite the original published paper.
Permanent link to this version:
1 Abstract
Aim. To compare different levels of self-rated pain and determine if they predict anticipated
early physical recovery in patients undergoing general and orthopaedic surgery.
Background. Previous research has indicated that average self-rated pain reflects patients’
ability to recover the same day. However, there is a knowledge gap about the feasibility of
using average pain ratings to predict patients' physical recovery for the next day.
Design. Descriptive, quantitative repeated measures.
Methods. General and orthopaedic inpatients (n=479) completed a questionnaire (October
2012 - January 2015) about pain and recovery. Average pain intensity at rest and during
activity was based on the Numeric Rating Scale and divided into three levels (0-3, 4-6, 7-10).
Three out of five dimensions from the tool “Postoperative Recovery Profile” were used.
Because few suffered severe pain, general and orthopaedic patients were analysed together.
Results. Binary logistic regression analysis showed that average pain intensity postoperative
day 1 significantly predicted the impact on recovery day 2, except nausea, gastrointestinal
function and bladder function when pain at rest and also nausea, appetite changes, and bladder
function when pain during activity. High pain ratings (NRS 7-10) demonstrated to be a better
predictor for recovery compared to moderate ratings (NRS 4-6), day 2, as it significantly
predicted more items in recovery.
Conclusion. Pain intensity reflected general and orthopaedic patients' physical recovery
postoperative day 1 and predicted recovery for day 2. By monitoring patients’ pain and impact
on recovery, patients’ need for support becomes visible which is valuable during hospital
stays.
Keywords. Pain, Assessment, Postoperative care, Quantitative Approaches, Nurse-Patient
2 Why is this research needed?
• High pain intensity is shown to interfere with early postoperative recovery leading to complications and prolonged hospital stays.
• A knowledge gap exists about the feasibility of using pain ratings to predict patients' early physical recovery.
What are the key findings?
• Patients’ average pain intensity at rest and during activity on postoperative day 1 clearly reflected physical recovery for the same day.
• Patients’ average pain intensity at rest on postoperative day 1 clearly predicted physical recovery the coming day, except for nausea, gastrointestinal function and
bladder function.
• Patients’ average pain intensity during activity on postoperative day 1 predicted physical recovery on postoperative day 2, except for nausea, appetite changes, and
bladder function.
How should the findings be used to influence policy/practice/research/education?
• In clinical care, a summary of patients’ daily pain assessments in an average pain value may serve as an indicator of early physical recovery for that day and as a
predictor for the following day.
• Further studies with repeated measures are needed to explore whether average pain compiled from reported pain ratings in medical records provides unanimous results to
3 Introduction
Daily, a large number of patients undergo major surgery and many of them suffer moderate to
severe pain during the first days afterwards (Carr et al. 2013). High pain intensity is shown to
interfere with early postoperative recovery, leading to complications and prolonged hospital
stays (Wells et al. 2008). Assessment of pain and other aspects of recovery is therefore of
value and enables optimization of healthcare policies and guidelines worldwide (CSPMS,
2015; Gordon et al., 2016; RNAO, 2013). Furthermore, assessment of recovery also reveals
patients’ individual needs for support after surgery (Allvin 2009). All existing recovery
assessment tools include pain as a substantial aspect. Several dimensions of recovery, such as
physical, psychological, emotional and activity aspects are also included (Myles et al. 1999,
Allvin et al. 2009, Royse et al. 2010, Gordon et al. 2010, Rothaug et al. 2013). These
extensive tools have been primarily developed for use in research or quality improvement
from the early postoperative phase up to a year after surgery. To create a better understanding
of early postoperative recovery is something that engages researchers internationally in order
to implement improvements in healthcare (Meissner et al., 2015). However, there is no simple
tool in clinical use that routinely employs pain ratings to summarize each individual's
recovery during the first postoperative day after surgery in order to predict recovery on the
following day.
Background
The definition of postoperative recovery varies depending on the intended postoperative
phase, involved healthcare professionals and selection of patients (Feldman et al. 2015). By
tradition, postoperative recovery refers to the phase during which patients stay in the care
units. This phase of recovery is described as regaining control of function to enable discharge
4
(Neville et al. 2014, Feldman et al. 2015, Allvin et al. 2009). Effective pain management is
described to be an essential part of the approach to enhancing recovery after surgery and to
reduce hospital stays (Spanjersberg et al. 2011, Larsen et al. 2012). In guidelines for
postoperative pain management, pain is recommended to be regularly requested and when
present it should be assessed with a valid self-rating scale (Gordon et al. 2010, Brantberg and
Allvin 2014). Furthermore, pain ratings should be recorded on a regular basis and at
breakthrough pain in order to follow pain variations throughout the day (Gordon et al. 2010,
Brantberg and Allvin 2014, Scug et al. 2015). Patients’ pain intensity is described to reflect
the individual subjective experience of pain and the assessment is advised to be performed
both at rest and during activity (Scug et al. 2015, Gordon et al. 2010, Brantberg and Allvin
2014). In addition, the American Pain Society (APS 1995) has recommended asking for
average pain for the preceding 24 hours. Previous research has indicated that pain scores from
monitoring records compiled to an average pain value for each patient reflect the patients’
ability to recover after surgery (Eriksson et al. 2013). This enables monitoring of recovery for
all patients capable of performing pain assessments with a pain scale.
Recovery assessment tools in research and in evaluation of healthcare guidelines monitor
different dimensions of recovery (Bowyer et al. 2014). However, complex and comprehensive
recovery tools might be difficult to use in clinical practice since healthcare professionals have
other tasks (Stark et al. 2013) and many patients are fatigued (Forsberg et al. 2015). Focusing
of a few items as pain ratings may help healthcare professionals to monitor recovery
regarding the most important areas. The physical dimension of recovery is common in
existing self-rating tools and consists of multiple items. These are: pain, nausea, mobilization
(Myles et al. 2000, Allvin et al. 2009, Royse et al. 2010, Gordon et al. 2010) appetite,
5
al. 2009, Myles et al. 2000, Gordon et al. 2010). In the growing use of established programs
for enhanced recovery after surgery, patients are requested to fill in a diary after surgery
(ERAS Society 2015). During the postoperative period when patients are still hospitalized,
questionnaires to follow recovery are burdensome. Avoidance of further questionnaires for
patients is therefore justified. However, there is a knowledge gap in how feasible already
collected pain ratings are to predict patients' recovery. According to available knowledge,
orthopaedic patients experience higher pain intensity and greater impact on their early
recovery compared to general surgery patients (Forsberg et al. 2015, Rothaug et al. 2013).
How this difference between general and orthopaedic surgery affects the possibility to predict
recovery is uncertain. Furthermore, recovery may be influenced by prehospital pain, which is
described as common among orthopaedic patients (Eriksson et al. 2013). If feasible, pain
intensity from monitoring records compiled to a median value could in the future be used to
predict which patients are in need of enhanced support for their recovery. The use of already
collected data, such as pain ratings to reflect as well as predict patients' recovery would be
beneficial for both patients and healthcare professionals. Even though pain intensity does not
appear to affect all aspects of physical recovery, pain assessments may be an easy way to
follow early postoperative recovery, both at individual and group levels. However, no study
has been found proving this hypothesis.
The study Aim
The aim of this study was to compare different levels of self-rated pain and determine if they
could predict anticipated early physical recovery in patients undergoing general and
6 Design
Descriptive, quantitative repeated measures.
Sample and setting
The study was conducted at six care units at three different county hospitals in southern
Sweden. The number of beds in the three hospitals varied between 300 and 400. The
catchment areas for the included hospitals were both rural and urban, with 130,000 to 150,000
inhabitants. A convenience sample of patients scheduled for major surgery was invited to
participate in the study in connection with the enrolment call before surgery. As in an earlier
study by Weiser et al. (2008), major surgery is defined as surgery performed during regional
or anaesthetic treatment. The inclusion criteria were: patients who had undergone major
general or orthopaedic surgery which implied a hospital stay of at least two days, age of 18
years or older, and ability to read and understand the Swedish language. Exclusion criteria
were pre- or postoperative cognitive dysfunction or being in need of intensive care. In total,
541 patients agreed to participate, of which 62 did not complete the study. Reasons for
drop-out were: questionnaires not returned (n=30), patients declined to continue the study (n=20),
confusion (n=3), care in the intensive care unit (n=5), postponed surgery (n=4). Of the
remaining patients (n=479), 38 were discharged on postoperative day 2 and could not
complete the third and last questionnaire but were included and completed the first two
questionnaires i.e. for prehospital and postoperative day 1 (Figure 1).
Instruments
Patients completed a questionnaire with 11 items, two about pain and nine about physical
recovery. Average pain intensity for the previous day (Sadosky et al. 2016) was requested at
7
where 0 means no pain and 10 worst pain. The NRS is the most common pain scale in clinical
practice (Hjermstad et al. 2011) and is shown to have good validity and reliability
(Ferreira-Valente et al. 2011). The average pain based on the NRS scoring from postoperative days 1
and 2 was divided into three levels (i.e. 0-3, 4-6, 7-10) to make the results clearer for the
reader of the study. These levels are also used in previous research (Couceiro et al. 2009,
Eriksson et al. 2013, Sadosky et al. 2016) making it easier to identify a pattern of clinical
relevance.
Postoperative physical recovery was measured by nine items covering three of five
dimensions of the questionnaire the Postoperative Recovery Profile (PRP) developed by
Allvin et al. (2009). The PRP was developed and tested in a Swedish context. It has been
proved to be valid, reliable (Allvin et al. 2009) and is used in several studies (Jakobsson et al.
2014, Le et al. 2014, Forsberg et al. 2015). The questionnaire consists of five dimensions:
physical symptoms, physical function, psychological, social and activity. Originally, the five
dimensions were composed of 19 items, but Allvin et al. (2008) recommended dropping two
items (i.e. sexual activity and re-establishing everyday life) at the hospital stay as they are not
relevant at the time. Since pain in the present study was measured with the NRS, the pain item
was also excluded from the PRP questionnaire. In accordance with the study aim three
dimensions were used from the PRP questionnaire. These consisted of the following
dimensions: physical symptoms, physical function and activity. Physical symptoms
comprised four items: nausea, fatigue, appetite changes and sleeping difficulties. Physical
function contained four items: gastrointestinal function, bladder function, mobilization and
muscle weakness. Activity consisted of one item: personal hygiene. The items in the PRP
questionnaire have four response alternatives reflecting the degree of recovery, ranging
8
recovery, the PRP was dichotomized as none/mild or moderate/severe. This approach is also
used in a previous study by Forsberg et al. (2015).
Data collection
Data was collected between October 2012 and January 2015. A research nurse at each care
unit asked patients about participation during the enrolment call one to two weeks before
elective surgery. At the enrolment, patients completed a questionnaire that contained
self-reported background and clinical data: gender, age, country of birth, education, intake of
analgesia, preoperative average pain intensity, and baseline values regarding physical
symptoms, physical functions and activity. The research nurse also collected additional data
on the following: American Society of Anesthesiologists’ (ASA) classificationof physical
status, motion sickness, smoking condition, pharmaceutical treatment for anxiety, depression
or sleeping difficulties, type of surgery and analgesia from the medical records during
patients’ hospital stay. At the beginning of postoperative days 2 and 3, patients answered the
complete questionnaire each day with 11 retrospective questions regarding details of the
previous day's pain (NRS) and recovery (PRP), i.e. postoperative days 1 and 2.
Ethical considerations
The study was conducted in accordance with the Helsinki Declaration principles (WMA
2013). All invited to participate in the study received a patient information sheet describing
the study aim, the target group, the procedures, and stating that participation was voluntary
and approval could be withdrawn. Patients gave verbal informed consent which was
reconfirmed when the questionnaires were handed over postoperatively. Ethical approval was
9 Data analysis
Descriptive statistics were used to present background and clinical data. Differences in age
between general and orthopaedic surgery were analysed with Mann-Whitney U test. Pearson
chi-square test or Fisher’s exact test were used to compare general and orthopaedic surgery
regarding background data. Mann-Whitney U test was used to compare average pain intensity
between the two surgical groups as well as to compare impact on the different items in
physical symptoms, physical functions and activity (i.e. physical recovery) between the three
time points. Friedman’s test was employed to compare average pain intensity and recovery
between the three time points (i.e. prehospital, postoperative days 1 and 2) and mean rank is
presented between the three time points. A Wilcoxon signed-rank test with Bonferroni
corrected P-values was used as a post-hoc-test.
Binary logistic regression analyses were used to determine the association between average
pain intensity and impact on the different recovery items and presented with odds ratio and
confidence interval. Recovery from days 1 and 2 were used as outcome variables,
dichotomized as recovered (none/mild) or not recovered (moderate/severe). Average pain
intensity from day 1 was entered as predictor variable, divided into three levels, NRS 0-3, 4-6,
7-10. Since general surgery contained few patients with severe pain, general and orthopaedic
surgeries were merged into one group to determine if pain intensity could predict recovery.
A significance level of 5% was overall considered as statistically significant. For the post-hoc analyses, the Bonferroni corrected p-values were set at P <.017. All analyses were conducted
using IBM SPSS Statistics 21 (IBM Corporation, Armonk, NY, USA).
10
The NRS and PRP instruments have earlier proved to be valid and reliable measures
(Ferreira-Valente et al. 2011; Allvin et al. 2009). Items from three dimensions (i.e. physical
symptoms, physical function and activity) in the PRP were used in the present study. The face
validity for the reduction of items and dimensions was based primarily on descriptions made
by patients before discharge collected by Allvin et al. (2011) in an initial validation study of
the PRP instrument. A second reason for the reduction was that the physical dimensions are
described to have the greatest significance during the first days after surgery (Bowyer &
Royse, 2016). Data were collected at six different wards to strengthen external validity.
Results
Background and clinical characteristics
All included patients underwent elective surgery, either general (n=190) or orthopaedic
(n=289). The mean age was 65 years and there were slightly more men (56%). Almost all
orthopaedic patients (96%) and half in the group of general surgery (49%) received opioids
postoperatively. In the latter group more than half (57%) received treatment with epidural
analgesia. Few had preoperative pharmacological treatment for anxiety (2%), depression (7%)
or sleeping difficulties (3%). Further descriptions of the patients are shown in Table 1.
Self-reported pain experiences
Prehospital, general surgery patients reported lower average pain intensity at rest (P <.001)
and during activity (P <.001) compared to orthopaedic patients. These differences also
remained during the first two postoperative days. Postoperatively, general surgery patients
had lower average pain intensity on day 1 at rest (P <.001) and during activity (P <.001) and
11
In general surgery, the average pain intensity increased significantly between the prehospital
period and postoperative day 1. Although the average pain intensity postoperative day 2 was
significantly lower than day 1, it was still significantly higher than prehospital. This was the
case both at rest and during activity. Orthopedic surgery had, on the contrary, an average pain
intensity that was worst before surgery and then decreased significantly until postoperative
day 2, both at rest and during activity (Table 2). The proportion of patients with average pain
intensity (NRS ≥ 4) at rest postoperative days 1 and 2 was 42% and 28%, respectively, of which 9% had NRS ≥ 7 on day 1 and 4% on day 2. During postoperative day 1, the proportion of patients with average pain intensity during activity was 72% of which 36% had NRS ≥ 7, and on postoperative day 2 the corresponding proportions were 61% and 20% respectively.
Self-rated physical recovery
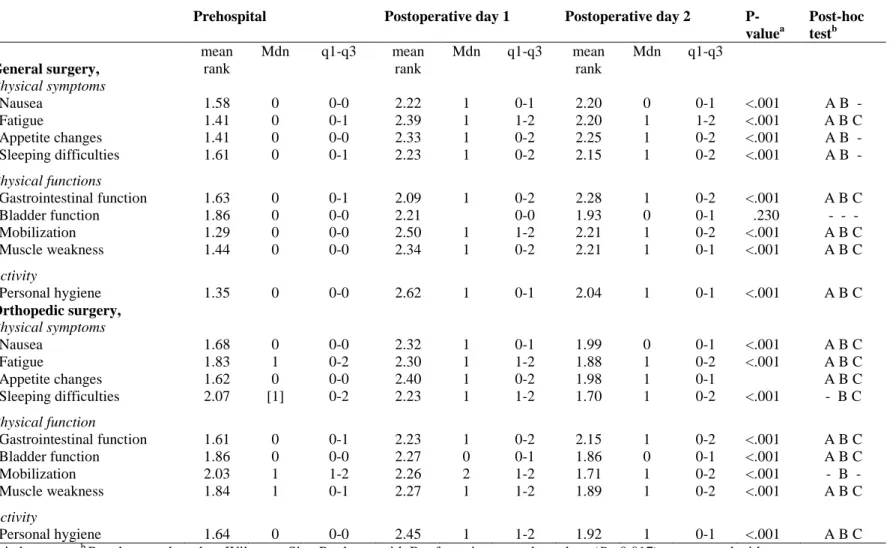
Compared to general surgery, orthopaedic surgery had a significantly greater impact on the
dimensions of physical symptoms, physical functions and activity at all time points.
Prehospital differences between the groups were found regarding fatigue, sleeping difficulties,
mobilization, muscle weakness and personal hygiene (P <.001). Corresponding differences on
postoperative day 1 were found concerning sleeping difficulties (P =.003), mobilization (P
=.006) and muscle weakness (P <.001). Furthermore, differences on postoperative day 2 were found in appetite changes (P =.040), mobilization (P =.001) and muscle weakness (P <.001).
Table 3 shows the impact of pain intensity on the recovery dimensions i.e. physical
symptoms, physical functions and activity prehospital and postoperatively for each surgery
group in relation to the different time points. General surgery had highest impact on recovery
postoperative day 1 in all items except gastrointestinal function, where highest impact was
12
and 2 regarding nausea, appetite changes and sleeping difficulties. Furthermore, no significant
difference was found concerning bladder function between the tree time points. Recovery had
increased significantly day 2, but was still lower compared to prehospital. Similar results were
found for all variables in the orthopedic group, the highest impact of pain intensity on
recovery were overall demonstrated postoperative day 1. However, no significant difference
was found regarding sleeping difficulties between the prehospital period and postoperative
day 1. A significant increased recovery had occurred postoperative day 2 in all variables,
except mobilization.
Association between pain on postoperative day 1 and recovery on days 1 and 2
The logistic regression analysis showed that average pain ratings at rest postoperative day 1
significantly reflected all types of recovery the same day and predicted most items of recovery
day 2 (Table 4). For postoperative day 2, nausea, gastrointestinal function and bladder
function was not significantly predicted by average pain at rest day 1. High pain ratings (NRS
7-10) was a better predictor for recovery compared to moderate ratings (NRS 4-6), both at
postoperative day 1 and day 2, as it significantly reflected and predicted more items of
recovery.
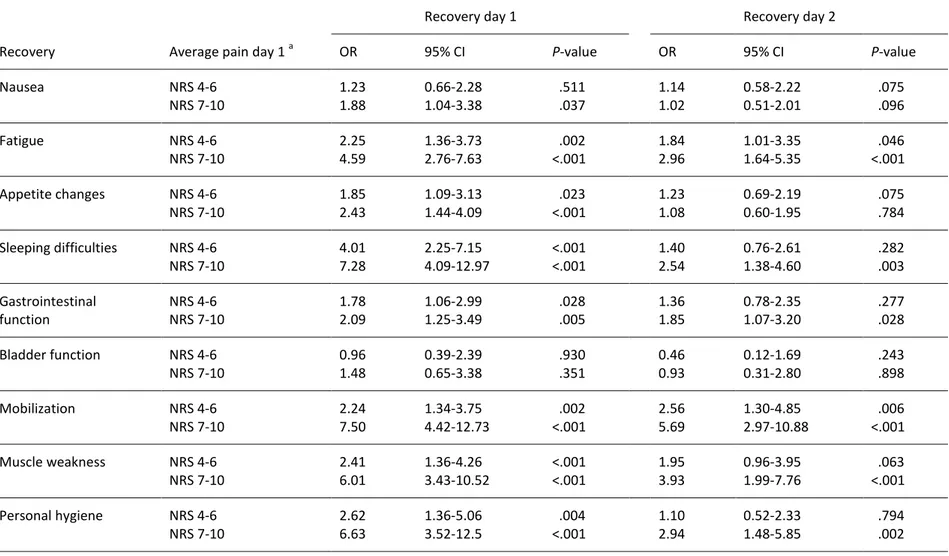
Average pain ratings at activity demonstrated similar findings but somewhat poorer ability to
predict recovery (Table 5). For postoperative day 1, all items of recovery were significantly
reflected by average pain ratings. For postoperative day 2, nausea, appetite changes, and
13
ratings at rest, high pain intensity (NRS 7-10) was a better predictor for recovery compared to
moderate ratings (NRS 4-6).
Discussion
Average pain intensity on postoperative day 1 predicted recovery in different items for the
coming day. However, the use of average pain intensity was a measure that reflected recovery
to an even greater extent for the same day. In both general and orthopaedic patients the
prevalence of pain intensity > 4 was high on postoperative day 1, but orthopaedic patients
reported less pain intensity compared to their prehospital experiences.
Average pain intensity at rest and during activity on postoperative day 1 partially predicted
patients' recovery for the following day. By predicting which patients have the greatest need
of support to recover, the prioritization of tasks is facilitated for healthcare professionals. The
interference of pain intensity in different recovery items is asked about in a variety of tools.
However, none has explored if only measuring average pain intensity enables prediction of
postoperative recovery. Stark et al. (2013) argue that a comprehensive tool has limited use in
everyday practice, claiming that the simpler the tool the greater the number of patients that
can be included and monitored. Following recovery by using already collected pain ratings
does not increase the burden on patients; instead, it allows patients to concentrate on what is
of relevance for their recovery. Guidelines for pain assessment recommend that data on pain
intensity at rest and during activity should be requested and recorded (Brantberg and Allvin
2014, Gordon et al. 2010, Scug et al. 2015). This, together with the found predictability of
certain recovery items for postoperative day 2, both at rest and during activity on
postoperative day 1, is a good reason to follow both. The main goal of pain management is to
14
pain levels, however, do not always imply increased recovery but provide conditions for
mobilization (Kehlet 2004). High pain intensity is a warning that the recovery is suppressed
and it is up to healthcare professionals to give pain management priority.
One important finding was that average pain intensity both at rest and during activity on
postoperative day 1 clearly reflected patients' recovery. In contrast to the present study, an
earlier study showed that average pain intensity significantly impacted recovery only
regarding walking, ability to sleep and food intake (Eriksson et al. 2013). The reason why the
relationship between pain and recovery did not occur in more items in that study may be due
to the limited sample size or because the questionnaire used did not have the same validity as the PRP. The incidence of pain (i.e. 72 % rated average pain NRS ≥ 4 during activity) shows the need to visualize pain for healthcare professionals - both the individual patient’s pain and
at group level. This is in line with other studies showing a corresponding presence of pain
intensity of 75% (Gan et al. 2014, Wadensten et al. 2011). Moreover, the incidence of severe
pain in these studies was between 32-42 %, similar to the experience of severe pain in the present study (i.e. NRS ≥ 7; 36 %). This indicates that pain is prevalent, and that there is a potential for accelerated recovery by improving postoperative pain management. Pain
intensity is not the only item interfering with recovery, but it has great impact according to
several studies (Feldman et al. 2015, Neville et al. 2014, Allvin et al. 2009) as well as in the
present study. Another item is gastrointestinal symptoms, which is also a part of the enhanced
recovery programs after surgery (Kehlet 2011). In the actual study, pain intensity on
postoperative day 1 showed less ability to predict impact on nausea, appetite changes or
gastrointestinal function on postoperative day 2 (Tables 4 and 5). An alternative way to cover
15
assessments of nausea using the NRS 0-10. However, research is needed to determine if
nausea on postoperative day 1 predicts these recovery items for the next day.
Following recovery with a pain scale has a weakness. Pain is a subjective experience and the
assessment of pain intensity varies between individuals (Scug et al. 2015). The level at which
patients consider that pain restricts their ability to be active and mobilized differs (Eriksson et
al. 2014, van Dijk et al. 2012). Furthermore, van Dijk et al. (2012) found patients take into
account the response their pain assessments will have on their pain treatment or whether they
will be perceived as whining. Postoperative pain intensity is also found to be influenced by
the presence of preoperative pain, younger age, anxiety and type of surgery (Ip et al. 2009).
Recovery in turn is influenced by co-morbidity, where higher ASA levels increase the risk of
postoperative complications delaying the recovery (Tevis et al. 2016). In addition to pain and
gastrointestinal symptoms, recovery is also affected by the presence of factors such as
drainage tubes and catheters (Kehlet 2011). Despite this, monitoring of recovery is moving
towards subjective patient-reported outcomes (Feldman et al. 2015). By using already
collected data (i.e.pain ratings) this is possible without the need for healthcare professionals
to ask patients to complete a lengthy questionnaire. However, pain is shown to be requested
and recorded at specific times and not tailored to patients' needs (Carr et al. 2014). This
implies that in addition to asking about pain intensity at regular intervals, pain assessments
must be performed more frequently following breakthrough pain. Adjusting the intervals
between pain assessments based on the patients’ needs may enable healthcare professionals to
use average pain intensity from postoperative day 1 to predict pain the following day. Carr et
al. (2014) consider pain assessments as a patient safety issue since high pain intensity after
surgery may cause chronic pain. Although there can be difficulties in obtaining pain ratings
16
identifying pain, the chance that it will be addressed increases and as a consequence patients
suffering will be reduced. Another benefit of making pain visible is to reduce the risk of
complications related to high pain intensity. A compilation of patients' pain intensity in an
average value on postoperative day 1 highlights patients’ pain and enables prediction of
recovery for the next day. A parallel study examines how many documented pain ratings are
needed to enable summarizing average pain intensity as a median value.Since following
patient-reported outcomes are internationally considered a basis for implementing
improvements in healthcare (Meissner et al 2015) monitoring pain intensity and thereby early
physical recovery is valuable.
One interesting finding in the current study was that orthopaedic patients experienced less
pain intensity postoperatively compared with the prehospital period. Their pain decreased
gradually although the proportion of patients with moderate to severe pain (i.e. NRS ≥ 4) was considerably higher compared with general surgery. Patients undergoing orthopaedic surgery
have previously been described to have higher pain intensity compared to other types of
surgery (Gerbershagen et al. 2013, Carr et al. 2014). According to Swedish guidelines, it is
not realistic to expect patients with prehospital moderate to severe chronic pain to achieve a
lower level of pain during the first days postoperatively (SFAI 2011). Consequently, many
patients in this study achieved the goal of their pain management, which was for their pain
level not to exceed the prehospital pain level. We, as well as Forsberg et al., (2015) found that
orthopaedic patients had a poorer recovery during the first few days after surgery compared to
general surgical patients. However, in the current study, orthopaedic patients had less impact
on mobilization postoperatively compared to the prehospital period. For all enrolled patients a
reduction of impact was found in several of the recovery items depending on rated pain
17
hygiene between postoperative days 1 and 2. As in previous studies, the relationship between
pain intensity and recovery did not change in the presence of chronic pain (Hansson et al.
2006, Eriksson et al. 2013). Including these patients appeared neither to affect reflection or
prediction of recovery.
In clinical practice, our findings may enable prediction of patients' recovery from
postoperative day 1 to day 2. According to guidelines, it is recommended that pain should be
asked about regularly and recorded in medical records (Gordon et al. 2010, Brantberg and
Allvin 2014). Despite the present study’s promising results, further studies with repeated
measures is needed to explore whether average pain intensity compiled from patients’
reported pain ratings in the medical records provides unanimous results. In the future,
compiled average pain values can enable monitoring groups of patients during the first few
days after surgery without patients having to complete a questionnaire. The findings also
showed that patients with prehospital pain reported a decline in pain postoperatively
compared with prehospital period even though pain levels still were high. This highlights the
need to ask about average pain intensity at rest and during activity at the enrolment call, and
together with the patient set a realistic goal for pain management.
Limitation
Consistent with the aim of the study, we focused exclusively on the physical dimensions and
activity; therefore, only three of five dimensions of the PRP questionnaire were used.
Removing pain from the PRP questionnaire was based on the recommended use of NRS in
guidelines. NRS also provides a more nuanced response to pain intensity compared to pain
rating scales with fewer answer options (Ferreira-Valente et al. 2011). Omitting dimensions
18
compare PRP scores but to use relevant items for early physical recovery. The limitation of
items in the questionnaire was done to avoid burdening patients with an excessively
comprehensive questionnaire early after major surgery. Another limitation is that general and
orthopaedic surgery was merged in the analyses because our data set contained few patients
with severe pain. The outcome between the two groups may differ since patients undergoing
general surgery often experience less pain both pre- and postoperatively compared to those
undergoing orthopaedic surgery. Further studies with a larger number of patients in the
general surgery group are required to determine whether the ability to reflect recovery for that
day and predict the recovery for the next day differs between the two groups.
Conclusions
Patients undergoing general surgery experienced less pain and were less influenced in their
recovery compared with those undergoing orthopaedic surgery. However, many orthopaedic
patients stated they had reduced pain and impact on mobilization compared to the prehospital
period. Using average pain ratings at rest and during activity enabled prediction of recovery.
Since enhanced recovery after surgery has been proven effective in reducing hospital stay,
and morbidity, it is useful to be able to monitor, predict and document the recovery using an
average pain value. However, pain did not predict all items of recovery such as nausea,
gastrointestinal function or bladder function. By following patients’ pain intensity and thereby
indirectly impact on recovery, patients’ need of support becomes visible, which is valuable
during hospital stays but also allows groups of patients to be compared.
References
Allvin, R. (2009) Postoperative Recovery : Development of a Multi-dimensional Questionnaire for
Assessment of Recovery, Örebro University. Diss.
Allvin, R., Ehnfors, M., Rawal, N. & Idvall, E. (2008) Experiences of the postoperative recovery process: an interview study. Open Nurs J, 2, 1-7.
19 Allvin, R., Ehnfors, M., Rawal, N., Svensson, E. & Idvall, E. (2009) Development of a questionnaire to
measure patient-reported postoperative recovery: content validity and intra-patient reliability. J Eval Clin Pract, 15(3), 411-9.
Allvin, Svensson, E., Rawal, N., Ehnfors, M., Kling, A. M., & Idvall, E. (2011). The Postoperative
Recovery Profile (PRP) - a multidimensional questionnaire for evaluation of recovery profiles.
J Eval Clin Pract, 17(2), 236-243. doi: 10.1111/j.1365-2753.2010.01428.x
APS (1995) American Pain Society (APS) Quality of Care Committee. Quality improvement guidelines for the treatment of acute pain and cancer pain. . Jama, 274(23), 1874-80.
Bowyer, Jakobsson, J., Ljungqvist, O. & Royse, C. (2014) A review of the scope and measurement of postoperative quality of recovery. Anaesthesia, 69(11), 1266-78.
Bowyer & Royse, C.F. (2016) Postoperative recovery and outcomes--what are we measuring and for whom? Anaesthesia, 71 Suppl 1, 72-7.
Brantberg, A.L. & Allvin, R. Vårdhandboken, Handbook for care, In Swedish, Smärtskattning av akut
och postoperativ smärta, Assessment of acute and postoperative pain. 2014. Available from:
http://www.vardhandboken.se/Texter/Smartskattning-av-akut-och-postoperativ-smarta/Oversikt/].
Carr, E.C., Meredith, P., Chumbley, G., Killen, R., Prytherch, D.R. & Smith, G.B. (2014) Pain: a quality of care issue during patients' admission to hospital. J Adv Nurs, 70(6), 1391-403.
Couceiro, T.C., Valenca, M.M., Lima, L.C., de Menezes, T.C. & Raposo, M.C. (2009) Prevalence and influence of gender, age, and type of surgery on postoperative pain. Rev Bras Anestesiol,
59(3), 314-20.
CSPMS. (2015). Core standards for pain mangement services in the UK, Faculty of pain medicine of the Royal College of Anaesthetists. Retrieved Retrieved 4th July, 2016, from
https://www.rcoa.ac.uk/system/files/FPM-CSPMS-UK2015.pdf ERAS Society. Enhanced Recovery - Patient Diary. 2015. Available from:
http://www.erassociety.org/images/Nursing_Group/Patient-information/Diary_NHS_Royal.pdf [cited 15th April, 2016].
Eriksson, K., Wikstrom, L., Arestedt, K., Fridlund, B. & Brostrom, A. (2014) Numeric rating scale: patients' perceptions of its use in postoperative pain assessments. Appl Nurs Res, 27(1), 41-6.
Eriksson, K., Wikstrom, L., Lindblad-Fridh, M. & Brostrom, A. (2013) Using mode and maximum values from the Numeric Rating Scale when evaluating postoperative pain management and
recovery. J Clin Nurs, 22(5-6), 638-47.
Feldman, L.S., Lee, L. & Fiore, J., Jr. (2015) What outcomes are important in the assessment of Enhanced Recovery After Surgery (ERAS) pathways? Can J Anaesth, 62(2), 120-30.
Ferreira-Valente, M.A., Pais-Ribeiro, J.L. & Jensen, M.P. (2011) Validity of four pain intensity rating scales. PAIN®, 152(10), 2399-2404.
Forsberg, A., Vikman, I., Walivaara, B.M. & Engstrom, A. (2015) Patients' perceptions of their postoperative recovery for one month. J Clin Nurs.
Frey-Law, L.A., Lee, J.E., Wittry, A.M. & Melyon, M. (2013) Pain rating schema: three distinct
subgroups of individuals emerge when rating mild, moderate, and severe pain. J Pain Res, 7,
13-23.
Gan, T.J., Habib, A.S., Miller, T.E., White, W. & Apfelbaum, J.L. (2014) Incidence, patient satisfaction, and perceptions of post-surgical pain: results from a US national survey. Curr Med Res Opin,
30(1), 149-60.
Gerbershagen, H.J., Aduckathil, S., van Wijck, A.J., Peelen, L.M., Kalkman, C.J. & Meissner, W. (2013) Pain intensity on the first day after surgery: a prospective cohort study comparing 179 surgical procedures. Anesthesiology, 118(4), 934-44.
Gordon, D. B., de Leon-Casasola, O. A., Wu, C. L., Sluka, K. A., Brennan, T. J., & Chou, R. (2016). Research Gaps in Practice Guidelines for Acute Postoperative Pain Management in Adults: Findings From a Review of the Evidence for an American Pain Society Clinical Practice Guideline. J Pain, 17(2), 158-166. doi: 10.1016/j.jpain.2015.10.023
20 Gordon, D.B., Polomano, R.C., Pellino, T.A., Turk, D.C., McCracken, L.M., Sherwood, G., Paice, J.A.,
Wallace, M.S., Strassels, S.A. & Farrar, J.T. (2010) Revised American Pain Society Patient Outcome Questionnaire (APS-POQ-R) for quality improvement of pain management in hospitalized adults: preliminary psychometric evaluation. J Pain, 11(11), 1172-86.
Hansson, E., Fridlund, B. & Hallstrom, I. (2006) Effects of a quality improvement program in acute care evaluated by patients, nurses, and physicians. Pain Manag Nurs, 7(3), 93-108.
Hjermstad, M.J., Fayers, P.M., Haugen, D.F., Caraceni, A., Hanks, G.W., Loge, J.H., Fainsinger, R., Aass, N. & Kaasa, S. (2011) Studies comparing Numerical Rating Scales, Verbal Rating Scales, and Visual Analogue Scales for assessment of pain intensity in adults: a systematic literature review. J Pain Symptom Manage, 41(6), 1073-93.
Inhestern, J., Schuerer, J., Illge, C., Thanos, I., Meissner, W., Volk, G.F. & Guntinas-Lichius, O. (2015) Pain on the first postoperative day after head and neck cancer surgery. Eur Arch
Otorhinolaryngol, 272(11), 3401-9.
Ip, H.Y., Abrishami, A., Peng, P.W., Wong, J. & Chung, F. (2009) Predictors of postoperative pain and analgesic consumption: a qualitative systematic review. Anesthesiology, 111(3), 657-77.
Jakobsson, J., Idvall, E. & Wann-Hansson, C. (2014) Patient-reported recovery after enhanced
colorectal cancer surgery: a longitudinal six-month follow-up study. Int J Colorectal Dis, 29(8),
989-98.
Kehlet, H. (2004) Effect of postoperative pain treatment on outcome-current status and future strategies. Langenbecks Arch Surg, 389(4), 244-9.
Kehlet, H. (2011) Fast-track surgery-an update on physiological care principles to enhance recovery.
Langenbecks Arch Surg, 396(5), 585-90.
Larsen, K., Hansen, T.B., Soballe, K. & Kehlet, H. (2012) Patient-reported outcome after fast-track knee arthroplasty. Knee Surg Sports Traumatol Arthrosc, 20(6), 1128-35.
Le, H., Khankhanian, P., Joshi, N., Maa, J. & Crevensten, H. (2014) Patients recovering from abdominal surgery who walked with volunteers had improved postoperative recovery profiles during their hospitalization. World J Surg, 38(8), 1961-5.
Meissner, W., Coluzzi, F., Fletcher, D., Huygen, F., Morlion, B., Neugebauer, E., . . . Pergolizzi, J. (2015). Improving the management of post-operative acute pain: priorities for change. Curr Med Res Opin, 31(11), 2131-2143. doi: 10.1185/03007995.2015.1092122
Myles, P.S., Hunt, J.O., Nightingale, C.E., Fletcher, H., Beh, T., Tanil, D., Nagy, A., Rubinstein, A. & Ponsford, J.L. (1999) Development and psychometric testing of a quality of recovery score after general anesthesia and surgery in adults. Anesth Analg, 88(1), 83-90.
Myles, P.S., Weitkamp, B., Jones, K., Melick, J. & Hensen, S. (2000) Validity and reliability of a postoperative quality of recovery score: the QoR-40. Br J Anaesth, 84(1), 11-5.
Neville, A., Lee, L., Antonescu, I., Mayo, N.E., Vassiliou, M.C., Fried, G.M. & Feldman, L.S. (2014) Systematic review of outcomes used to evaluate enhanced recovery after surgery. Br J Surg,
101(3), 159-70.
Nilsson, H., Angeras, U., Bock, D., Borjesson, M., Onerup, A., Fagevik Olsen, M., Gellerstedt, M., Haglind, E. & Angenete, E. (2016) Is preoperative physical activity related to post-surgery recovery? A cohort study of patients with breast cancer. BMJ Open, 6(1), e007997.
RNAO. (2013). Registered Nurses' Association of Ontario, Clinical best practise guidelines, Assessment and management of pain, third edition. Retrieved Retrieved 4th July, 2016, from http://rnao.ca/sites/rnao-ca/files/AssessAndManagementOfPain2014.pdf
Rothaug, J., Zaslansky, R., Schwenkglenks, M., Komann, M., Allvin, R., Backstrom, R., Brill, S., Buchholz, I., Engel, C., Fletcher, D., Fodor, L., Funk, P., Gerbershagen, H.J., Gordon, D.B., Konrad, C., Kopf, A., Leykin, Y., Pogatzki-Zahn, E., Puig, M., Rawal, N., Taylor, R.S., Ullrich, K., Volk, T., Yahiaoui-Doktor, M. & Meissner, W. (2013) Patients' perception of postoperative pain management: validation of the International Pain Outcomes (IPO) questionnaire. J Pain,
14(11), 1361-70.
Royse, C.F., Newman, S., Chung, F., Stygall, J., McKay, R.E., Boldt, J., Servin, F.S., Hurtado, I.,
21 postoperative recovery: the post-operative quality recovery scale. Anesthesiology, 113(4),
892-905.
Sadosky, A., Koduru, V., Bienen, E.J. & Cappelleri, J.C. (2016) Characterizing individual painDETECT symptoms by average pain severity. Clinicoecon Outcomes Res, 8, 361-6.
Scug, S.A., Palmer, G.M., Scott, D.A., Halliwel, l.R. & Trinca, J. Acute pain management: scientific
evidence. 4:th ed. Australian and New Zealand college of anaesthetists and faculty of pain
medicine; 2015. Available from: http://www.fpm.anzca.edu.au/resources/books-and-publications/APMSE4_2015_Final.pdf [cited 11th July 2016].
SFAI. Svensk Förening Anestesi och Inensivvård (Swedish Society of Anesthesiology and Intensive
Care). 2011. Available from:
http://sfai.se/riktlinje/medicinska-rad-och-riktlinjer/anestesi/postoperativ-smartlindring/ [cited 8th June, 2016].
Spanjersberg, W.R., Reurings, J., Keus, F. & van Laarhoven, C.J. (2011) Fast track surgery versus conventional recovery strategies for colorectal surgery. Cochrane Database Syst Rev, (2), Cd007635.
Stark, P.A., Myles, P.S. & Burke, J.A. (2013) Development and psychometric evaluation of a postoperative quality of recovery score: the QoR-15. Anesthesiology, 118(6), 1332-40.
Tevis, S.E., Cobian, A.G., Truong, H.P., Craven, M.W. & Kennedy, G.D. (2016) Implications of Multiple Complications on the Postoperative Recovery of General Surgery Patients. Ann Surg, 263(6),
1213-8.
Wadensten, B., Frojd, C., Swenne, C.L., Gordh, T. & Gunningberg, L. (2011) Why is pain still not being assessed adequately? Results of a pain prevalence study in a university hospital in Sweden. J
Clin Nurs, 20(5-6), 624-34.
van Dijk, J.F., van Wijck, A.J., Kappen, T.H., Peelen, L.M., Kalkman, C.J. & Schuurmans, M.J. (2012) Postoperative pain assessment based on numeric ratings is not the same for patients and professionals: a cross-sectional study. Int J Nurs Stud, 49(1), 65-71.
Weiser, T.G., Regenbogen, S.E., Thompson, K.D., Haynes, A.B., Lipsitz, S.R., Berry, W.R. & Gawande, A.A. (2008) An estimation of the global volume of surgery: a modelling strategy based on available data. Lancet, 372(9633), 139-44.
Wells, N., Pasero, C. & McCaffery, M. (2008) Advances in Patient Safety. Improving the Quality of Care Through Pain Assessment and Management. In Patient Safety and Quality: An
Evidence-Based Handbook for Nurses(Hughes, R. G. ed. Agency for Healthcare Research and Quality
(US), Rockville (MD).
WMA. The World Medical Association (WMA) Declaration of Helsinki - Ethical Principles for Medical
Research Involving Human Subjects
2013. Available from: http://www.wma.net/en/30publications/10policies/b3/ [cited 13th April 2016].
Figure 1. Flowchart of patients and data collection. Three hospitals were recruited to the
study which included 6 care units for general surgery or orthopedic surgery.
Patients accepted participation (n=541) in connection with the enrolment call. 1-2 weeks prior to surgery patients answered a questionnaire concerning demographic and medical data.
Postoperative day 2
Patients answered a questionnaire regarding postoperative day 1 (n=479).
Postoperative day 3
Patients answered a questionnaire regarding postoperative day 2 (n=441).
Patient drop-outs, n=62.
Patients discharged, n=38.
Table 1. Background and clinical data for general and orthopaedic surgery (n=479). Variables, n (%) n Total n=479 General surgery n=190 Orthopaedic surgery n=289 P-value Age, mean, (sd) [range] 479 65.2 (11.0) [22-93] 65.6 (10.6) [23-93] 65.0 (11.3) [22-92] .890a Women, n (%) 479 211 (44.1) 54 (28.4) 157 (54.3) <.001b Country of birth, n (%) 478 .764b Sweden 451 (94.4) 177 (93.2) 274 (94.8) Others 27 (5.6) 13 (6.8) 14 (4.8) Education n (%) 475 .873b Up to elementary school 197 (41.1) 79 (41.8) 118 (41.3) Gymnasium 166 (34.6) 69 (36.5) 97 (33.9) University 112 (23.4) 41 (21.7) 71 (24.8) Preoperative conditions, n (%) Smoker 457 28 (5.8) 22 (12.4) 6 (2.1) <.001b Motion sickness 460 34 (7.1) 19 (11.2) 15 (5.6) .032b ASA, n (%) 467 .760a I 143 (29.9) 58 (30.5) 85 (29.4) II 264 (55.1) 99 (52.1) 165 (57.1) III 59 (12.3) 23 (12.1) 36 (12.5) IV 1 (0.2) 1 (0.5) - -
Daily intake of analgesia 6 months prior to surgery, n (%)
Daily intake 477 210 (44.0) 28 (14.7) 182 (63.4) <.001b
Only non-opioids 475 136 (28.6) 14 (7.4) 122 (42.2) <.001b
Opioids with or without non- opioids
475 66 (13.9) 9 (4.8) 57 (19.9) <.001b
Type of surgery, n (%) 479 n/a
Cystectomy and nephrectomy 22 (4.6) 22 (11.6) - -
Prostatectomy 67 (14.0) 67 (35.3) - -
Other urology 4 (0.8) 4 (2.1) - -
Lower abdominal 89 (18.6) 90 (47.4) - -
Vascular 6 (1.3) 6 (3.2) - -
Other general surgery 2 (0.4) 1 (0.5) - -
Knee replacement 76 (15.9) - - 76 (26.3)
Hip replacement 149 (31.1) - - 149 (51.6)
Neck and back 49 (10.2) - - 49 (17.0)
Other orthopaedic surgery 15 (3.1) - - 15 (5.2)
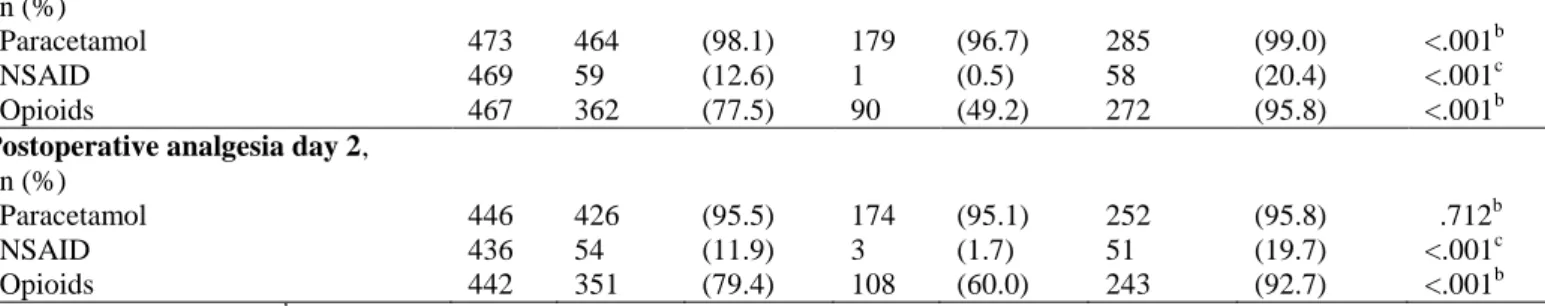
n (%)
Paracetamol 473 464 (98.1) 179 (96.7) 285 (99.0) <.001b NSAID 469 59 (12.6) 1 (0.5) 58 (20.4) <.001c Opioids 467 362 (77.5) 90 (49.2) 272 (95.8) <.001b
Postoperative analgesia day 2,
n (%)
Paracetamol 446 426 (95.5) 174 (95.1) 252 (95.8) .712b NSAID 436 54 (11.9) 3 (1.7) 51 (19.7) <.001c Opioids 442 351 (79.4) 108 (60.0) 243 (92.7) <.001b
a Mann-Whitney U test, b Pearson Chi-square test, c Fisher’s exact test
Table 2. Comparisons of average pain intensity (NRS) prehospital and postoperatively.
Average pain intensity Prehospital Postoperative day 1 Postoperative day 2
P-valuea Post-hoc testb NRS 0-10 mean rank Mdn q1-q3 mean rank Mdn q1-q3 mean rank Mdn q1-q3 General surgery Rest 1.50 0 0-1 2.36 2 1-3 2.14 2 1-3 <.001 A B C Activity 1.37 0 0-2 2.51 2 4-6 2.12 3 2-5 <.001 A B C Orthopedic surgery Rest 2.23 4 2-7 2.21 4 3-5 1.57 3 1-4 <.001 A B C Activity 2.35 7 6-8 2.16 7 5-8 1.49 5 3.5-7 <.001 A B C
a Friedman test. Post-hoc test based on Wilcoxon Sign Rank test with Bonferroni corrected p-values (P <0.017) are reported with:
Table 3. Comparison of self-rated impact on physical symptoms, physical functions and activity between prehospital assessment and postoperative day 1 and 2.
Prehospital Postoperative day 1 Postoperative day 2
P-valuea Post-hoc testb General surgery, mean rank Mdn q1-q3 mean rank Mdn q1-q3 mean rank Mdn q1-q3 Physical symptoms Nausea 1.58 0 0-0 2.22 1 0-1 2.20 0 0-1 <.001 A B Fatigue 1.41 0 0-1 2.39 1 1-2 2.20 1 1-2 <.001 A B C Appetite changes 1.41 0 0-0 2.33 1 0-2 2.25 1 0-2 <.001 A B Sleeping difficulties 1.61 0 0-1 2.23 1 0-2 2.15 1 0-2 <.001 A B -Physical functions Gastrointestinal function 1.63 0 0-1 2.09 1 0-2 2.28 1 0-2 <.001 A B C Bladder function 1.86 0 0-0 2.21 0-0 1.93 0 0-1 .230 - - - Mobilization 1.29 0 0-0 2.50 1 1-2 2.21 1 0-2 <.001 A B C Muscle weakness 1.44 0 0-0 2.34 1 0-2 2.21 1 0-1 <.001 A B C Activity Personal hygiene 1.35 0 0-0 2.62 1 0-1 2.04 1 0-1 <.001 A B C Orthopedic surgery, Physical symptoms Nausea 1.68 0 0-0 2.32 1 0-1 1.99 0 0-1 <.001 A B C Fatigue 1.83 1 0-2 2.30 1 1-2 1.88 1 0-2 <.001 A B C Appetite changes 1.62 0 0-0 2.40 1 0-2 1.98 1 0-1 A B C Sleeping difficulties 2.07 [1] 0-2 2.23 1 1-2 1.70 1 0-2 <.001 - B C Physical function Gastrointestinal function 1.61 0 0-1 2.23 1 0-2 2.15 1 0-2 <.001 A B C Bladder function 1.86 0 0-0 2.27 0 0-1 1.86 0 0-1 <.001 A B C Mobilization 2.03 1 1-2 2.26 2 1-2 1.71 1 0-2 <.001 B Muscle weakness 1.84 1 0-1 2.27 1 1-2 1.89 1 0-2 <.001 A B C Activity Personal hygiene 1.64 0 0-0 2.45 1 1-2 1.92 1 0-1 <.001 A B C
a Friedman test. b Post-hoc test based on Wilcoxon Sign Rank test with Bonferroni corrected p-values (P <0.017) are reported with:
A= Prehospital-Postoperative day 1, B= Prehospital -Postoperative day 2, C= Postoperative day 1- Postoperative day 2. Answers options for the different items were, 0-3; none, mild, moderate, severe.
4 Table 4. Associations between average pain rating at rest postoperative day 1 and recovery items day 1 and 2, based on logistic
regression analyses.
Recovery day 1 Recovery day 2
Recovery Average pain day 1 a OR 95% CI P-value OR 95% CI P-value
Nausea NRS 4-6 2.07 1.25-3.42 .004 1.30 0.74-2.29 .364 NRS 7-10 5.66 2.81-11.43 <.001 1.48 0.64-3.40 .349 Fatigue NRS 4-6 2.07 1.38-3.10 <.001 1.68 1.05-2.70 .031 NRS 7-10 7.67 3.41-17.29 <.001 4.30 2.08-8.86 <.001 Appetite changes NRS 4-6 1.35 0.88-2.07 .165 0.99 0.60-1.64 .974 NRS 7-10 4.87 2.42-9.79 <.001 2.27 1.13-4.59 .022 Sleeping difficulties NRS 4-6 3.84 5.51-5.87 <.001 1.77 1.08-2.89 .023 NRS 7-10 12.82 5.64-29.15 <.001 5.48 2.64-11.37 <.001 Gastrointestinal NRS 4-6 1.48 0.97-2.25 .068 0.92 0.58-1.46 .730 function NRS 7-10 2.40 1.22-4.75 .012 1.81 0.89-3.69 .101 Bladder function NRS 4-6 2.04 0.98-4.24 .054 1.44 0.44-4.73 .550 NRS 7-10 3.85 1.46-10.22 .007 2.90 0.71-11.75 .137 Mobilization NRS 4-6 3.24 2.14-4.91 <.001 1.92 1.19-3.07 .007 NRS 7-10 4.99 2.38-10.43 <.001 3.02 1.48-6.15 .002 Muscle weakness NRS 4-6 2.54 1.67-3.88 <.001 172 1.03-2.87 .039 NRS 7-10 5.53 3.74-11.16 <.001 4.30 2.09-8.80 <.001 Personal hygiene NRS 4-6 2.591 1.65-4.05 <.001 1.71 0.97-2.99 .063 NRS 7-10 7.27 3.59-14.72 <.001 4.94 2.36-10.31 <.001 a
5 Table 5. Associations between average pain rating during activity postoperative day 1 and recovery day 1 and 2, based on logistic regression analyses.
Recovery day 1 Recovery day 2
Recovery Average pain day 1 a OR 95% CI P-value OR 95% CI P-value
Nausea NRS 4-6 1.23 0.66-2.28 .511 1.14 0.58-2.22 .075 NRS 7-10 1.88 1.04-3.38 .037 1.02 0.51-2.01 .096 Fatigue NRS 4-6 2.25 1.36-3.73 .002 1.84 1.01-3.35 .046 NRS 7-10 4.59 2.76-7.63 <.001 2.96 1.64-5.35 <.001 Appetite changes NRS 4-6 1.85 1.09-3.13 .023 1.23 0.69-2.19 .075 NRS 7-10 2.43 1.44-4.09 <.001 1.08 0.60-1.95 .784 Sleeping difficulties NRS 4-6 4.01 2.25-7.15 <.001 1.40 0.76-2.61 .282 NRS 7-10 7.28 4.09-12.97 <.001 2.54 1.38-4.60 .003 Gastrointestinal NRS 4-6 1.78 1.06-2.99 .028 1.36 0.78-2.35 .277 function NRS 7-10 2.09 1.25-3.49 .005 1.85 1.07-3.20 .028 Bladder function NRS 4-6 0.96 0.39-2.39 .930 0.46 0.12-1.69 .243 NRS 7-10 1.48 0.65-3.38 .351 0.93 0.31-2.80 .898 Mobilization NRS 4-6 2.24 1.34-3.75 .002 2.56 1.30-4.85 .006 NRS 7-10 7.50 4.42-12.73 <.001 5.69 2.97-10.88 <.001 Muscle weakness NRS 4-6 2.41 1.36-4.26 <.001 1.95 0.96-3.95 .063 NRS 7-10 6.01 3.43-10.52 <.001 3.93 1.99-7.76 <.001 Personal hygiene NRS 4-6 2.62 1.36-5.06 .004 1.10 0.52-2.33 .794 NRS 7-10 6.63 3.52-12.5 <.001 2.94 1.48-5.85 .002 a

![Table 1. Background and clinical data for general and orthopaedic surgery (n=479). Variables, n (%) n Total n=479 General surgery n=190 Orthopaedic surgery n=289 P-value Age, mean, (sd) [range] 479 65.2 (11.0) [22-93] 65.6 (10.6](https://thumb-eu.123doks.com/thumbv2/5dokorg/4642160.120354/24.1262.99.897.119.778/background-clinical-general-orthopaedic-variables-general-orthopaedic-surgery.webp)