The Alamosa River Corridor 15 Years After Remediation
Began at Summitville Mine
A Master’s Thesis
Presented to the Faculty of the
College of Science and Mathematics
Colorado State University-Pueblo
Pueblo, Colorado
In Partial Fulfillment
Of the Requirements for the Degree of
Masters of Science in Applied Natural Science
(Biology Emphasis)
By
Jared Romero
Colorado State University – Pueblo
August, 2010
CERTIFICATE OF ACCEPTANCE
This Thesis Presented in Partial Fulfillment of the Requirements for the Degree
Masters of Science in Applied Natural Science
(Biology Emphasis)
By Jared J. Romero
Has Been Accepted By the Graduate Faculty of the
College of Science and Mathematics
Colorado State University- Pueblo
APPROVAL OF THESIS COMMITTEE:
________________________________________________________________________
Graduate Advisor (Dr. Moussa Diawara) Date
________________________________________________________________________
Committee Member (Dr. Jack Seilheimer) Date
________________________________________________________________________
Committee Member (Dr. Chad Kinney) Date
________________________________________________________________________
i
ACKNOWLEDGEMENTS
A special thanks to Dr. Moussa Diawara, Dr. Jack Seilheimer, Dr. Chad Kinney, Dr. Annette Gabaldon, Dr. Jeff Smith, Jim Carsela and Dr. Richard Kreminski for assisting
and guiding me through this process. I would also like to thank Dr. Marty Jones, Dr. Benita Brink, Theresa Jimenez, Martin and Ellen Romero, Jerome and Brenda Romero,
ii
TABLE OF CONTENTS
TITLE PAGE
GRADUATE PROGRAM ACCEPTANCE
ACKNOWLEDGMENTS i
TABLE OF CONTENTS ii
ABSTRACT iii-v
LIST OF FIGURES vi-ix
LIST OF TABLES x-xii
LIST OF EQUATIONS xiii
INTRODUCTION 1-15
STUDY OBJECTIVES AND HYPOTHESIS 15-17
MATERIALS AND METHODS 17-30
RESULTS 30-124
DISCUSSION 124-157
LITERTURE CITED 158-165
APPENDIX (THESIS DEFENSE PRESENTATION) 166
iii ABSTRACT:
THE ALAMOSA RIVER CORRIDOR 15 YEARS AFTER REMEDIATION BEGAN AT SUMMITVILLE MINE Jared J. Romero
Summitville Mine lies in Rio Grande National Forest in southwestern Colorado.
Summitville Mine contributed to the contamination of the Alamosa River Ecosystem by
leaking acids and heavy metals into Wightman Fork an Alamosa River Tributary. The
poor conditions of the Alamosa River have been well documented since 1917. However,
the damaging effects caused by operations at Summitville Mine during 1985-1992 were
much greater than the contamination that exists due to the volcanic geology of the area.
The Alamosa River and Terrace Reservoir, an irrigation reservoir that the Alamosa River
flows into, had a viable fish population, prior to Summitville Consolidated Mining Corp.,
Inc. beginning a cyanide heap leaching pad operation in 1985. By 1990 the Colorado
Division of Wildlife had reported that a fish population no longer existed in Terrace
Reservoir. In 1992 the EPA and other government agencies began studies of the affected
areas and in 1994 began remediation efforts. The last collected document that analyzed
sediment along the Alamosa River was in 2000 and the last study that analyzed Alamosa
River water samples was in 2003. Since 2003 there have been no studies performed to
our knowledge to determine the health of the Alamosa River Ecosystem and the impact
of the remediation. We hypothesized that the remediation effort has been successful and
that the majority of any potential heavy metal contamination was no longer coming from
Summitville Mine, but rather from the volcanic geology of the Mountains. Our main
objective was to evaluate the effectiveness of the remediation efforts initiated in 1992 to
iv
corridor. Specifically we 1) compared concentrations of heavy metals in water, sediment
and tree core samples collected upstream, at and downstream from the mining site; and 2)
compared the concentrations of all inorganic elements (heavy metals and others)
upstream, at and downstream of the mining site to the concentrations recorded in 2000
and 2003.
This study determined the heavy metal concentrations in water, sediment, and tree
core samples during the 2009 runoff season. This was done in order to determine if the
ecosystems health has improved since remediation began in 1992. Previous reports
looked at concentrations of aluminum, arsenic, cadmium, copper, iron, lead, nickel and
zinc. Our 2009 study included these heavy metals, however we determined the
concentration of 27 heavy metals in water, sediment and tree cores using an ICP-MS.
Statistical analysis was performed on heavy metals that were analyzed in previous studies
as well as any heavy metal that was not in compliance with the Colorado Department of
Public Health and/ Environment (CDPHE) standards in water or the Ecological Soil
Screening Concentrations (ECSSL) for soil and tree cores. Concentrations of aluminum,
arsenic, cadmium, copper, iron, lead, nickel and zinc all decreased in 2009 water samples
when compared to previously reported concentrations. However, aluminum, cadmium,
copper and manganese concentrations were still above the CDPHE standards in water.
Cadmium, copper, iron, nickel, and zinc concentrations all decreased in sediment samples
when compared to previous year's results, but remained above ECSSL concentrations.
Concentrations of aluminum, arsenic, lead and manganese concentrations all increased in
2009 when compared to previously reported data in sediment. Arsenic, lead and
v
Populus tremuloides.) and cottonwood (sc. Populus deltoids) species were below
ECSSLs; however the results indicated that heavy metals could move in between rings of
the entire tree. Our study found that the majority of the heavy metal contamination is not
coming from the volcanic geology. Summitville Mine still remains as the major
contamination source for most of the heavy metals contamination in the Alamosa River
vi
List of Figures
Figure 1: An Artists Representation of the Summitville-Platoro 2 Caldera
Figure 2: An Artists Rendition of the Volcanically Altered Geology 5 in the Alamosa Watershed
Figure 3: Dissolved Oxygen’s (DO) Reduction Results in Pyrite 10 Oxidation by Ferric Ions
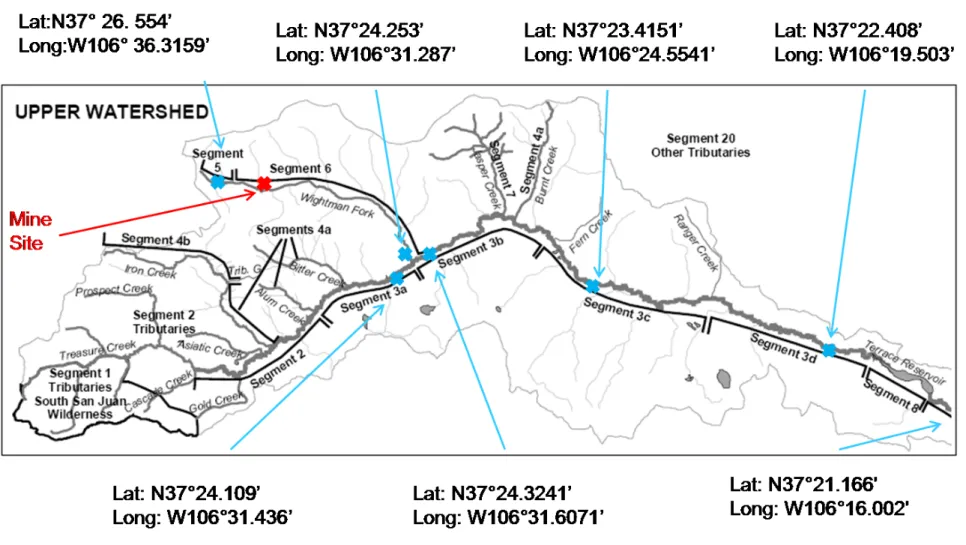
Figure 4: Map of the Alamosa Watershed Marked with 2009 Field 23 Sampling Locations and GPS Coordinates
Figure 5: Mean Dissolved Oxygen (DO) Values from the 2009 33 Collections Season with Their Corresponding Standards
set by the Colorado Department of Public Health and Environment (CDPHE)
Figure 6: The Number of Times the Dissolved Oxygen (DO) 34 Concentrations were Below Standards set by the
Colorado Department of Public Health and Environment (CDPHE)
Figure 7: Aluminum Concentrations (ppb) in Water Samples Along 38 the Alamosa River
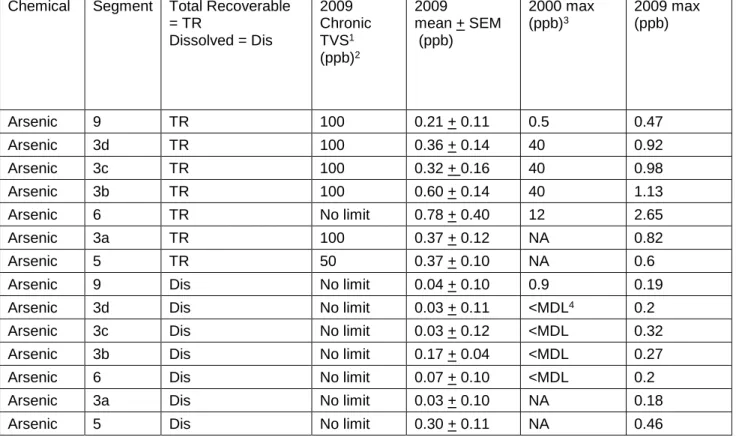
Figure 8: Arsenic Concentrations (ppb) in Water Samples Along the 41 Alamosa River
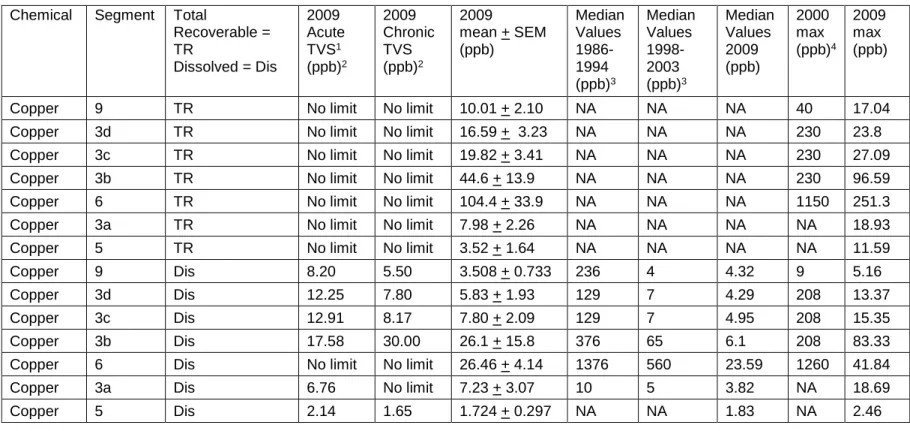
Figure 9: Copper Concentrations (ppb) in Water Samples Along the 43 Alamosa River
Figure 10: Iron Concentrations (ppb) in Water Samples Along the 46 Alamosa River
Figure 11: Lead Concentrations (ppb) in Water Samples Along the 49 Alamosa River
Figure 12: Selenium Concentrations (ppb) in Water Samples Along 51 the Alamosa River
Figure 13: Cadmium Concentrations (ppb) in Water Samples Along 54 the Alamosa River
vii
Figure 14: Manganese Concentrations (ppb) in Water Samples 55 Along the Alamosa River
Figure 15: Nickel Concentrations (ppb) in Water Samples Along 56 the Alamosa River
Figure 16: Zinc Concentrations (ppb) in Water Samples Along the 57 Alamosa River
Figure 17: Aluminum Concentrations (ppm) in Sediment Samples 63 Along the Alamosa River
Figure 18: Iron Concentrations (ppm) in Sediment Samples Along 64 the Alamosa River
Figure 19: Figure 19. Vanadium Concentrations (ppm) in Sediment 65 Samples Along the Alamosa River
Figure 20: Arsenic Concentrations (ppm) in Sediment Samples 69 Along the Alamosa River
Figure 21: Cadmium Concentrations (ppm) in Sediment Samples 72 Along the Alamosa River
Figure 22: Cobalt Concentrations (ppm) in Sediment Samples 74 Along the Alamosa River
Figure 23: Copper Concentrations (ppm) in Sediment Samples 77 Along the Alamosa River
Figure 24: Lead Concentrations (ppm) in Sediment Samples Along 79 the Alamosa River
Figure 25: Manganese Concentrations (ppm) in Sediment Samples 82 Along the Alamosa River
Figure 26: Nickel Concentrations (ppm) in Sediment Samples 84 Along the Alamosa River
Figure 27: Selenium Concentrations (ppm) in Sediment Samples 87 Along the Alamosa River
Figure 28: Zinc Concentrations (ppm) in Sediment Samples Along 89 the Alamosa River
viii
Cores Above and Below Terrace Reservoir
Figure 30: Cadmium Concentrations (ppm) in Cottonwood Tree 93 Cores Above and Below Terrace Reservoir
Figure 31: Cobalt Concentrations (ppm) in Cottonwood Tree Cores 94 Above and Below Terrace Reservoir
Figure 32: Copper Concentrations (ppm) in Cottonwood Tree Cores 95 Above and Below Terrace Reservoir
Figure 33: Lead Concentrations (ppm) in Cottonwood Tree Cores 96 Above and Below Terrace Reservoir
Figure 34: Manganese Concentrations (ppm) in Cottonwood Tree 97 Cores Above and Below Terrace Reservoir
Figure 35: Nickel Concentrations (ppm) in Cottonwood Tree Cores 98 Above and Below Terrace Reservoir
Figure 36: Selenium Concentrations (ppm) in Cottonwood Tree 99 Cores Above and Below Terrace Reservoir
Figure 37: Silver Concentrations (ppm) in Cottonwood Tree Cores 100 Above and Below Terrace Reservoir
Figure 38: Zinc Concentrations (ppm) in Cottonwood Tree Cores 101 Above and Below Terrace Reservoir
Figure 39: Arsenic Concentrations (ppm) in Aspen Tree Cores 103 Above and Below Wightman Forks junction with the
Alamosa River
Figure 40: Cadmium Concentrations (ppm) in Aspen Tree Cores 104 Above and Below Wightman Forks Junction with the
Alamosa River
Figure 41: Lead Concentrations (ppm) in Aspen Tree Cores Above 105 and Below Wightman Forks Junction with the Alamosa
River
Figure 42: Zinc Concentrations (ppm) in Aspen Tree Cores Above 106 and Below Wightman Forks Junction with the Alamosa
ix
Figure 43: Cobalt Concentrations (ppm) in Aspen Tree Cores 107 Above and Below Wightman Forks Junction with the
Alamosa River
Figure 44: Copper Concentrations (ppm) in Aspen Tree Cores 108 Above and Below Wightman Forks Junction with the
Alamosa River
Figure 45: Manganese Concentrations (ppm) in Aspen Tree Cores 109 Above and Below Wightman Forks Junction with the
Alamosa River
Figure 46: Nickel Concentrations (ppm) in Aspen Tree Cores 110 Above and Below Wightman Forks Junction with the
Alamosa River
Figure 47: Selenium Concentrations (ppm) in Aspen Tree Cores 111 Above and Below Wightman Forks Junction with the
Alamosa River
Figure 48: Silver Concentrations (ppm) in Aspen Tree Cores 112 Above and Below Wightman Forks Junction with the
Alamosa River
Figure 49: Mean pH Values from the 2009 Collections Season with 114 the Corresponding Standards set by the Colorado
Department of Public Health and Environment.
Figure 50: The number of times the pH values were below 117 standards set by the Colorado Department of Public
x
List of Tables
Table 1: A List of Remediation Efforts That Have Been Completed 11 or are Underway at Summitville Mine
Table 2: Definitions of Water Usage in the State of Colorado 18-19
Table 3: Alamosa River Water Standards Set by the Colorado 20-21 Department of Public Health and Environment
Table 4: Alamosa River Segment Descriptions and Water 24 Classifications
Table 5: May –August 2009 Dissolved Oxygen (DO), Mean 31-32 Temperature and pH Readings for the Alamosa River
Table 6: Aluminum Standards for Sections Sampled Along the 39 Alamosa River in 2009 compared to Median and
Maximum Values from Previous Studies
Table 7: Arsenic Standards for Sections Sampled Along the 42 Alamosa River in 2009 Compared to Maximum Values
from Previous Studies
Table 8: Copper Standards for Sections Sampled Along the 45 Alamosa River in 2009 compared to Median and Maximum
Values from Previous Studies
Table 9: Iron Standards for Sections Sampled along the Alamosa 47 River in 2009 compared to Median and Maximum Values
from Previous Studies
Table 10: Lead Standards for Sections Sampled along the Alamosa 50 River in 2009 compared to Maximum Values from
Previous Studies
Table 11: Selenium Standards for Sections Sampled along the 52 Alamosa River in 2009 Compared to Maximum Values
from Previous Studies
Table 12: Cadmium Standards for Sections Sampled Along the 58 Alamosa River in 2009 Compared to Maximum Values
from Previous Studies
Table 13: Manganese Standards for Sections Sampled Along the 59 Alamosa River in 2009 Compared to Median and
xi Maximum Values from Previous Studies
Table 14: Nickel Standards for Sections Sampled Along the 60 Alamosa River in 2009 Compared to Maximum Values
from Previous Studies
Table 15: Zinc Standards for Sections Sampled Along the Alamosa 61 River in 2009 Compared to Median and Maximum
Values from Previous Studies
Table 16: Table 16. May–August 2009 Aluminum Concentrations 66 at 5cm and 15 cm Depths Collected Along the Alamosa
River and the Ecological Soil Screening Levels for Aluminum Designated for each Segment of the Watershed
Table 17: May–August 2009 Iron Concentrations at 5cm and 15 cm 67 Depths Collected Along the Alamosa River and the
Ecological Soil Screening Levels for Iron Designated for each Segment of the Watershed
Table 18: May–August 2009 Vanadium Concentrations at 5cm and 68 15 cm Depths Collected Along the Alamosa River and
the Ecological Soil Screening Levels for Vanadium Designated for each Segment of the Watershed
Table 19: May-August 2009 Arsenic Concentrations at 5cm and 15 71 cm depths Collected Along the Alamosa River and the
Ecological Soil Screening Levels for Arsenic designated for each segment of the watershed
Table 20: May–August 2009 Cadmium Concentrations at 5cm and 73 15 cm Depths Collected Along the Alamosa River and the
Ecological Soil Screening Levels for Cadmium Designated for each Segment of the Watershed
Table 21: May–August 2009 Cobalt Concentrations at 5cm and 15 75 cm Depths Collected Along the Alamosa River and the
Ecological Soil Screening Levels for Cobalt Designated for each Segment of the Watershed
Table 22: May–August 2009 Copper Concentrations at 5cm and 15 78 cm Depths Collected Along the Alamosa River and the
Ecological Soil Screening Levels for Copper Designated for each Segment of the Watershed
xii
Table 23: May–August 2009 Lead levels at 5cm and 15 cm depths 81 collected along the Alamosa River and the Ecological Soil
Screening Levels for Lead designated for each segment of the watershed
Table 24: May–August 2009 Manganese Concentrations at 5cm and 83 15 cm Depths Collected Along the Alamosa River and the
Ecological Soil Screening Levels for Manganese Designated for each Segment of the Watershed
Table 25: May–August 2009 Nickel Concentrations at 5cm and 15 85 cm depths Collected Along the Alamosa River and the
Ecological Soil Screening Levels for Nickel Designated for each Segment of the Watershed
Table 26: May–August 2009 Selenium Concentrations at 5cm and 88 15 cm Depths Collected Along the Alamosa River and the
Ecological Soil Screening Levels for Selenium Designated for each Segment of the Watershed
Table 27: May–August 2009 Zinc Concentrations at 5cm and 15 90 cm Depths Collected Along the Alamosa River and the
Ecological Soil Screening Levels for Zinc Designated for each Segment of the Watershed
Table 28: Table 28. 2009 Median and Average pH Values 115 Compared to Previously Reported Values
xiii
List of Equations
Equation 1: Pyrite Oxidation by Atmospheric Oxygen 4
Equation 2: Sulfur Oxidation by Ferric Ions 4
Equation 3: Generation of Ferrous Sulfates 9
1 INTRODUCTION
Summitville Mine is located in the San Juan Mountain Range of the Rocky
Mountains, in southwestern Colorado at an approximate elevation of 11,500 ft (Plumlee
1995). It is located within the Rio Grande National Forest, approximately 2 miles east of
the continental divide (Ketellapper, 2000). The San Juan Mountain range was previously
a series of steep active volcanoes (USGS 1995A). Theses volcanoes formed over 30
million years ago; since that time natural erosion has helped to deteriorate the slopes of
these volcanoes. Summitville Mine is located in the north-northwest region of a unique
geological region known as the Summitville-Platoro caldera complex (Bethke et al.
2004). Calderas are formed when the central part of a volcano collapses or explodes,
resulting in a crater that has a diameter much greater than its previous vent. The
Summitville and Platoro calderas intersect along the Pass Creek-Elwood Creek Fault
zone that runs in a northwesterly trend. The Summitville-Platoro caldera complex was
formed by the collapse of the volcanoes summit on two separate occasions. First the
Platoro summit collapsed, and then the newer summit on the Summitville side collapsed
forming the Summitville-Platoro caldera. The Summitville-Platoro caldera complex and
its sheer size can be visualized in Figure 1.
After the formation of the caldera complex; the rocks inside the volcano that
formed the Upper Alamosa River Corridor and the Summitville Mine location were
exposed to hydrothermal alteration events. Hydrothermal alteration is a process where the
rocks inside the volcano are being exposed to hot corrosive water that is produced by the
volcanic system (USGS 1995A). For the formation of the water products the volcano was
2 Figure 1. An Artist’s Representation of the Summitville-Platoro Caldera.
This image was modified from the Alamosa River Watershed Restoration Master Plan and Environmental Assessment (CWCB 2005A). The Summitville-Platoro Caldera is a vast area that includes Summitville Mine, Wightman Fork and Platoro Reservoir.
3
ground water was inevitable. The magma below Summitville contained many dissolved
gases, such as hydrogen sulfide (H2S), and sulfur dioxide (SO2). As the magma cooled
the gases were released. During the gases ascensions, the gases combined with water
(H2O) vapor to form sulfuric acid (H2SO4). The extremely corrosive sulfuric acid
traveled through the faults and fractures of the volcano causing a type of disintegration in
rocks known as acid sulfate alteration. Acid sulfate alteration results in the surrounding
rock becoming porous and allowing the metals in the metal bearing water solutions to
deposit as solid minerals into the rock (USGS 1995A; Gray and Coolbaugh 1994; and
Bethke et al. 2004). Rocks are typically able to withstand attacks by acid solutions due to
their natural buffering capacity; however, due to the sheer amount of acid alteration that
is found in the area, the quantity of the acid attacks must have been extremely severe and
numerous (USGS 1995A).
There were two main hydrothermal alteration events at the Summitville-Platoro
caldera complex, the first event occurred in the upper Alamosa River Corridor (USGS
1995A). This event affected an 11 square kilometer area of rock. These rocks are located
in the areas of the Iron, Alum and Bitter Creek basins. The metal bearing water solutions
that caused the acid leaching in the area of Iron, Alum, and Bitter Creeks did not carry
gold, silver or copper. Since there were no precious metal deposits in these areas they
were not extensively mined. The Summitville hydrothermal alteration, affected an area
around 3 square kilometers. The Summitville area did have metal bearing water solutions
that carried gold, silver and copper; which, formed precious metal deposits within the
altered porous rock. In addition to the precious metals, many other compounds were
4 chalcocite.
When the aforementioned minerals encounter erosion and oxidation due to mining
activities or weather such as snow and rain, they have the capacity to generate large
amounts of acid. Formation of acid mine drainage (AMD) requires abiotic and biotic
processes for its generation. During mining activity large amounts of mining waste are
piled up outside of the mine, these piles are known as spoils (Eby 2004). When pyrite is
exposed to oxidizing conditions such as being piled up outside of mine shafts, it will
undergo an initial oxidation reaction with atmospheric oxygen as seen in equation 1
(Madigan et al. 1997).
1. FeS2(s) + 3.5O2(g) + H2O(aq) Fe2+(s) +2SO42- (s) +2H+ (g)
The abiotic reaction above results in sulfur being oxidized and the generation of acidic
conditions. The ferrous ions that are liberated in reaction 1 are stable to further oxidation
under pH conditions about 3 or lower. After the initial abiotic process, iron oxidizing
bacteria (e.g., Thiobacillus ferrooxidans) can further oxidize ferrous ions to ferric ions.
The biotic oxidation of iron by bacteria is a major factor in the continued generation of
AMD under low pH conditions. The ferric ions will further oxidize sulfur continuing to
generate AMD as seen below in equation 2.
2. FeS2(s) + 14Fe3+(s) + 8H2O(aq) 15Fe2+(s) + 2SO42- (s) +16H+(g)
The minerals in the Summitville Mine area were exposed to large amounts of
sulfuric acid during their volcanic formation leaving them unable to buffer against new
acids generated by AMD and weather (USGS 1995A). These hydrothermally altered
5
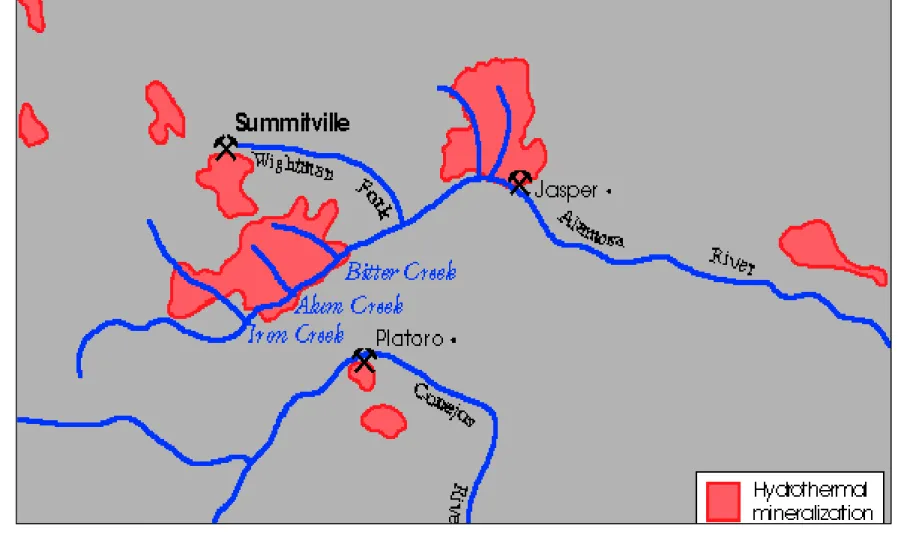
Figure 2. An Artist’s Rendition of the Volcanically Altered Geology in the Alamosa Watershed.
This image was modified from a United States Geological Survey gif. file (USGS 1995B). The red areas indicate the hydrothermally mineralized areas. The location of Alum, Iron, and Bitter Creek in the volcanically altered area (segment 3a) explains why water conditions in the Alamosa River were poor, prior to mining activity at Summitville Mine.
6
occur in highly mineralized areas and can naturally have adverse affects on the
environment as seen in the volcanically altered area (segment 3a). Therefore, the
Alamosa River is not only affected by AMD from the mine, but also acid drainage from
the volcanically altered area (segment 3a). During the runoff season and during rain
storms the acids and heavy metals from both areas enter an extensive series of small and
intermediate creeks that flow into the Alamosa River. The effects of the AMD and acid
drainage on the Alamosa River and its tributaries have been seen for many years.
Reports of poor conditions in Alum, Iron, and Bitter Creeks can be traced back to
1917 (Filas and Gormley 1993). The waters of these three creeks were said to have
sulfuric and acidic qualities. All three tributaries are also located within an 11 square
kilometer area identified by the United States Geological Survey (USGS) as the older of
two hydrothermal alteration areas. The conditions present in these three tributaries can be
attributed to the volcanic geology of the area since none of these tributaries were highly
disturbed by mining activity or extensively explored (USGS 1995A). These three
tributaries join the Alamosa River prior to its junction with the Wightman Fork the mine
drainage. The water from the volcanically altered tributaries and the mine drainage all
flow downstream into Terrace Reservoir.
The Alamosa River enters Terrace Reservoir before continuing downstream to the
San Luis Valley floor where it is used for irrigation. Terrace Reservoir was originally
constructed in 1911 for use as an irrigation reservoir; this is still its primary function
today (CDPHE 2001). Water that is released from Terrace Reservoir is used for
agricultural irrigation, livestock watering, and wildlife habitat. Crops that are grown
7
study found significantly higher concentrations of copper, manganese and nickel in
alfalfa crops irrigated with water from Terrace Reservoir (Erdman and Smith 1995).
Concentrations of copper, manganese and nickel in alfalfa crops irrigated with water
from Terrace Reservoir were determined to be significantly higher when they were
compared with metal concentrations in alfalfa crops grown in fields irrigated with water
from a different source. The concentrations of these metals in the alfalfa crops irrigated
with water from Terrace Reservoir were below or close to nutritional needs for cattle.
However, copper concentrations were approaching non-tolerable concentrations for
sheep. This study also analyzed metal concentrations in water irrigation samples and
determined that the irrigation water from Terrace Reservoir had elevated metal
concentrations when compared to other irrigation sources. The study determined that the
elevated metal concentrations in the irrigation water from Terrace Reservoir had only
minor effects on the soil chemistry, and demonstrated that increased metal concentrations
caused by Summitville Mine were having effects in crops further downstream. The
Alamosa River also feeds wetlands that are habitat for aquatic life, and is a temporary
home for many species of migratory waterfowl that visit the San Luis Valley each year.
Dating as far back to 1889, the Alamosa River had been known as a trout stream
containing Rio Grande Cutthroat Trout. However, by 1985 the Cutthroat Trout
populations had disappeared (Rupert 2001). Reports of reproducing Brook Trout in the
river still remained. From 1960 to 1990, Terrace reservoir was stocked with Rainbow
Trout for anglers, but by July of 1990, the Colorado Division of Wildlife had reported
that fish no longer existed in the reservoir. On June 23rd, 1990 the copper concentration in
8
significantly higher than the concentration of 30μg/L measured in 1986 (Rupert 2001). The 96-hour LC50 for copper (the concentration of copper that will kill 50 percent of the
test species in four days) for rainbow trout is 52 µg/L. Even though volcanic
contamination and some early lode and placer mining contamination were present in the
Alamosa River, the increased acid and metal loadings from Summitville are suspected in
the disappearance of stocked fish from both Terrace Reservoir and farm holding ponds
along the Alamosa River (Plumlee 1995).
The disappearance of fish from the Alamosa River Watershed could have also
been attributed to low dissolved oxygen (DO) content in the water. A low DO
concentration is a characteristic that is present in many polluted rivers (Lloyd 1961). Fish
species generally are unable to survive DO concentrations below 3 mg/L (Murphy 2007).
When fish are in low oxygen containing water they will increase the volume of water
passing through the gills in order to meet their oxygen demands (Lloyd 1961). By
increasing the rate of water passing through the gills they are also increasing the amount
of heavy metal toxins crossing the gill epithelium where most toxins are absorbed, thus
making toxicity and death more rapid. The optimal DO concentrations for adult trout is
anywhere between 9-12 mg/L. The general DO requirements for segments in the
Alamosa River, except for the Wightman Fork mine drainage (segment 6), which has no
general DO requirement, is 7 mg/L during spawning and 6 mg/L when spawning is not
occurring (USFWS 2005).
DO concentrations have been shown to decrease when high concentrations of
ferrous sulfate are present (Oba and Poulson 2008). The Alamosa River most likely has
9
geology (King, 1995; Bethke et al. 2004) Pyrite can be directly oxidized by atmospheric
oxygen resulting in the formation of ferrous sulfates as seen below in equation 3 (Hu et
al. 2006).
3. FeS2(s) + 3O2(g) FeSO4(s) + SO2(g)
DO does not interact directly with pyrite, but its reduction causes the oxidation of
pyrite by generating reactive ferric ions on the pyrite surface (Moses and Herman 1991).
This process removes DO from the rivers by reducing DO to H2O. The reduction of DO
and the oxidation of pyrite can be seen in Figure 3.
Historically, mining of gold and silver began at Summitville around 1870
(CDPHE 2009B). Placer gold was first discovered in the Summitville area in 1870 and
by 1873 several gold lodes had been identified (Gray and Coolbaugh 1994). Prior to the
1960’s Summitville was mined using underground tunnels where the high grade ore
would be extracted from veins (USGS 1995A). Summitville was shut down due to these
techniques not being very economical and since the gold was scattered in small amounts
over large areas. From 1985-1992, Summitville Consolidated Mining Corp., Inc.
(SCMCI) used open-pit mining and cyanide heap-leaching techniques to extract gold
from low grade ore. These operations resulted in a series of environmental problems.
There was a significant increase in the amount of acidic and metal-rich drainage from the
site. There were several leaks of cyanide-bearing solutions from the heap-leach pad and
several surface leaks that were entering into Wightman Fork of the Alamosa River.
Leakage from the mine caused the release of heavy metals (copper, cadmium,
10
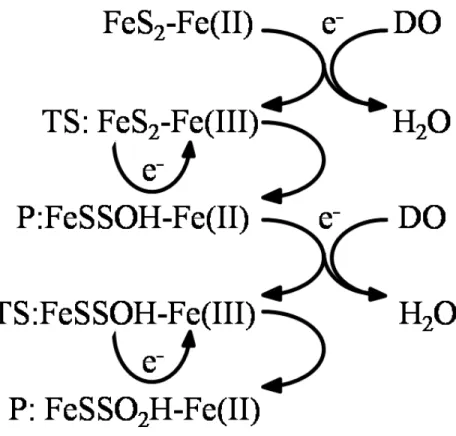
Figure 3. Dissolved Oxygen’s (DO) Reduction Results in Pyrite Oxidation by Ferric Ions.
This figure was modified from Moses and Herman (1991). DO does not interact directly with pyrite, but its reduction causes the oxidation of pyrite by generating reactive ferric ions on the pyrite surface (the chemical reaction above is illustrative but not balanced in its details). This process removes DO from the rivers by reducing DO to H2O. TS indicates a transition state while P corresponds with the product of the reactions above. The product of the steps above is the starting
11
SCMCI declared bankruptcy in December of 1992 and abandoned Summitville; the site
has since been under the control of the Environmental Protection Agency’s (EPA)
Comprehensive Environmental Response, Compensation, and Liability Act (CERCLA)
or more commonly known as a Superfund site (USGS 1995A). Summitville was later
added to the EPA’s National Priorities List in May of 2004. The total cost for clean up
were first estimated at $100 to $120 million dollars. To date the cleanup costs at
Summitville have exceeded $180 million dollars and this was prior to the Valley Courier
News Paper reporting in the Fall of 2009 that President Barack Obama’s stimulus plan
would add another 10 to 25 million for the cleanup efforts at Summitville (Mullens
2009).
Remediation efforts to clean up Summitville Mine and the Alamosa River have
been underway since 1992. Beginning in 1992, the EPA and Colorado Department of
Public Health and Environment (CDPHE) began several interim projects that were
designed to slow down the amount of AMD coming for the Summitville Mine site
(CDPHE 2009A). The CDPHE was the lead agency on the largest interim project that
has been implemented at the site; they were in charge of site wide reclamation and
regevetation. Prior to any remediation being completed at Summitville Mine, a remedial
investigation and feasibility study for the Summitville Site was conducted by the
CDPHE. Their study began in 1998 and outlined final construction of long term projects
that must be completed to wrap up the cleanup efforts at Summitville Mine; as well as
smaller interim measures that were already completed. There have been several projects
to date that have been completed at the Summitville Mine site, a list of completed and
12
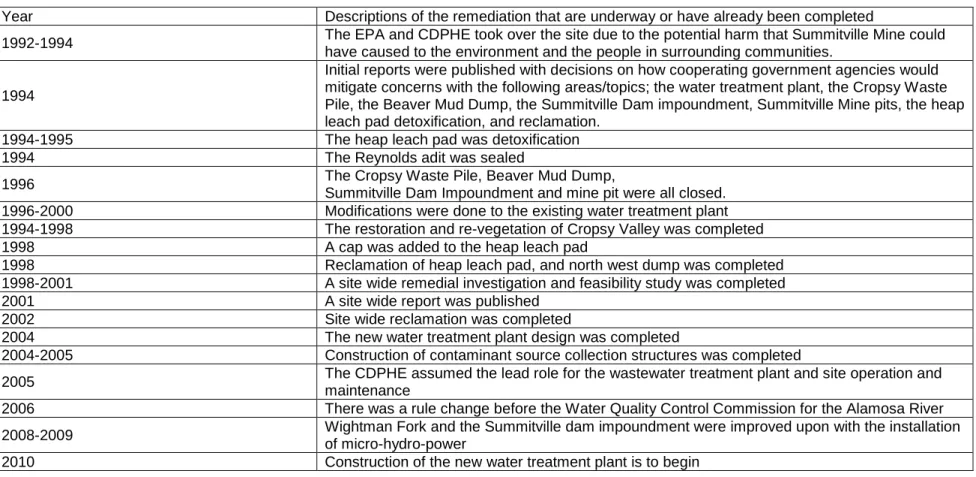
Table 1. A List of Remediation Efforts That Have Been Completed or are Underway at Summitville Mine1
1 CDPHE 2009A
Year Descriptions of the remediation that are underway or have already been completed
1992-1994 The EPA and CDPHE took over the site due to the potential harm that Summitville Mine could have caused to the environment and the people in surrounding communities.
1994
Initial reports were published with decisions on how cooperating government agencies would mitigate concerns with the following areas/topics; the water treatment plant, the Cropsy Waste Pile, the Beaver Mud Dump, the Summitville Dam impoundment, Summitville Mine pits, the heap leach pad detoxification, and reclamation.
1994-1995 The heap leach pad was detoxification 1994 The Reynolds adit was sealed
1996 The Cropsy Waste Pile, Beaver Mud Dump,
Summitville Dam Impoundment and mine pit were all closed. 1996-2000 Modifications were done to the existing water treatment plant 1994-1998 The restoration and re-vegetation of Cropsy Valley was completed 1998 A cap was added to the heap leach pad
1998 Reclamation of heap leach pad, and north west dump was completed 1998-2001 A site wide remedial investigation and feasibility study was completed 2001 A site wide report was published
2002 Site wide reclamation was completed
2004 The new water treatment plant design was completed
2004-2005 Construction of contaminant source collection structures was completed
2005 The CDPHE assumed the lead role for the wastewater treatment plant and site operation and maintenance
2006 There was a rule change before the Water Quality Control Commission for the Alamosa River 2008-2009 Wightman Fork and the Summitville dam impoundment were improved upon with the installation
of micro-hydro-power
13
The reclamation work that has been done at Summitville mine has consisted of
permanent roads being identified and constructed for access to key areas at the mine
(Ketellaper 2000). The site was retrofitted with an extensive series of pipelines and
ditches to manage site drainage (Ketellaper 2000; CDPHE 2009A). The ditches were
engineered to withstand a 500-year storm event, therefore a large storm could not cause
great damage to the site and endanger the public and habitats further downstream
(CDPHE 2005). Slopes and depressions surrounding the mine that were greater than 3:1
were graded to reduce water infiltration at the mine site (CDPHE 2001).The subsoil’s in
disturbed areas around the mine had a mix of limestone and mushroom compost added to
them prior to the areas being re-vegetated (Ketellaper 2000). Approximately 250 acres
were re-vegetated around the Mine (CDPHE 2009B).
Waste rock piles were removed from the Cropsy Waste Piles and Beaver Mud Dump to
reduce the generation of AMD. The waste rock piles were backfilled into open mine pits
to reduce water percolation into the ground (CDPHE 2009B). The open mine pits were
lined with three feet of clay and then had five feet of lime kiln dust added to them to help
with acid neutralization prior to any mine waste being backfilled into them (Ketellaper
2000). The mine adits (underground mine entrances) were plugged to reduce acid
drainages that could come from the mine workings (CDPHE 2009A; CDPHE 2009B).
Additionally the Summitville Dam height was raised, as well as being further modified
with the addition of a new spillway and stabilized with the installation of a gravel drain
and sand filter (Ketellaper 2000).
Equally important to the structural components and the cleanup of mine waste at
14
release downstream. The preexisting water treatment plant was retrofitted in order to
treat 1.4 million gallons of contaminated water per day (CDPHE 2009B). The old water
treatment plant is to be replaced by a new water treatment plant that is to undergo
construction in 2009-2011. A precipitation process is used to treat the water and remove
heavy metals prior to release in Wightman Fork (Ketellaper 2000). This study was unable
to determine the exact chemical reagents that are used in the precipitation process at
Summitville Mine. After the precipitation process the clean water is then pumped back
into a clean storage facility and the solids are removed. A 90 million gallon wastewater
holding pond was also constructed to help with the removal of metals and acidity.
The heap leach pad also required extensive work, since this is where the low
grade gold ore was isolated using a cyanide solution. The heap leach pad at Summitville
Mine has been detoxified, capped and revegetated in order to reduce the concentrations of
cyanide in it, and also to reduce the infiltration of snowmelt and precipitation (CDPHE
2009B; Ketellaper 2000). The heap leach pad was detoxified using a chemical treatment
method (Ketellaper 2000). This method consisted of rinsing the heap leach pad with clean
water. After the rinse, a 70% hydrogen peroxide solution was injected into the water
cyanide solution as it was treated in the onsite water treatment plant. The addition of the
hydrogen peroxide allows the cyanide to be converted to cyanate as seen in equation 4
(Akcil 2003).
4. H2O2 + CN- Cu2+ + catalyst OCN- +H2O
After the cyanide was removed using the hydrogen peroxide, the water was further
15
released into Wightman Fork. The removal of cyanide was discontinued after September,
1995 once water and sediment samples from the heap leach pad showed a reduction in
cyanide concentrations and no health hazards were present.
The heap leach pad has been further improved by regrading it into a dome shape
prior to the addition of a cap (Ketellaper 2000). The cap that was put in the heap leach
pad consisted of a geocomposite drain that was placed between two layers of
geosynthetic clay liner. A geosynthetic clay liner is a liner that has bentonite clay
between two layers of geosynthic fabric. The geosynthetic layer is to help reduce water
infiltration. The cap was then covered by a 1.2129 meters (m) thermal layer that consists
of two different layers itself. The first layer that made up the thermal layer was 1.0668 m
deep; it consisted of heap leach pad material that had been mixed with crushed limestone.
The second layer was 15.2 centimeters (cm) deep and consisted of sediment that had
limestone and mushroom compost added to it. Limestone was added to both layers to
help neutralize the soil, and mushroom compost was also added to help facilitate plant
growth and sustainability.
STUDY HYPOTHESIS AND OBJECTIVES
The cleanup efforts are still underway at Summitville Mine; however, to the best
of our knowledge data of recently conducted evaluations of the heavy metal contaminates
in the water and sediment from the Alamosa River are missing or not available. The last
publication that contained water quality data for the Alamosa River was printed in 2005
by cooperating government agencies (CWCB, 2005A). The data presented in this
publication were collected from 1986 to 2003. Sediment analysis along the Alamosa
16
Environmental Protection Agency (EPA). The EPA samples were collected in 2001, and
the Rocky Mountain Consultants data was collected in 2000. Consequently, it was critical
to provide updated information on water and sediment from the Alamosa River by
determining the effectiveness of the remediation efforts in reducing contamination. We
hypothesize that the water quality of the Alamosa River and the surrounding ecosystem is
now cleaner 15 years after EPA’s remediation efforts began. We further hypothesize that
the majority of the water contamination is no longer coming from Summitville Mine, but
from the volcanic geology of the mountains. We aimed to evaluate the effectiveness of
the remediation efforts initiated in 1994 to reduce heavy metal concentrations in Terrace
Reservoir and along the Alamosa River corridor following environmental degradations
caused by mining operations from 1985-1992. Specifically, we 1) compared
concentrations of heavy metals in water, sediment and tree core samples collected at and
downstream from the mining site to concentrations in samples collected upstream from
the mining site; and 2) compared the concentrations of a selected few inorganic elements
(heavy metals and others) at the mining site to the concentrations recorded in 2000, 2003,
and to current metal standards.
The results of the current study were compared to maximum, mean, median and
range concentrations recorded between 1986-2003 and reported in 2001 and 2005. This
approach was used because metal concentrations in the water and sediment vary
depending on the volume of water in the Alamosa River. Comparing the mean metal
concentrations with the metal standards allows us to determine if metal concentrations
that are regularly found are exceeding these standards. Comparisons of the maximum
17
exceeded by extreme conditions. Comparing both the mean and maximum metal
concentrations to the standards allows us to better visualize what is truly happening in the
Alamosa River Ecosystem. Median concentrations in water samples were used for
comparison purposes because previous reports did not provide mean metal concentrations
in water. Comparison of range data allows for the visualization of metal concentrations
for the whole collection season, since it contains the minimum and maximum
concentration for each segment. Due to the complexity of water laws and regulations the
Alamosa River was evaluated by segments. Each segment of the Alamosa River has its
own usage and metal standards set by the Colorado Department of Public Health and
Environment (CDPHE) that we will be comparing our water results with. In the State of
Colorado water quality determines how the water can be used; the definitions of water
classifications that are used to describe the waters of the Alamosa River can be seen in
Table 2. The Alamosa River has specific guidelines that must be met in respect to heavy
metal concentrations. The metal standards that are specific for each segment that we
sampled in the Alamosa River can be seen in Table 3.
MATERIALS AND METHODS Area of Study
The sampling areas for the water, sediment and tree core collections were
identified from the 1995 United States Geological Survey (USGS) publication,
Environmental Considerations of Active and Abandoned Mine Lands, Lessons from Summitville, Colorado (USGS 1995A). We used the tree core map that was provided in
the previous report to identify our collection sites. All of the sample sites in this map
18
Table 2. Definitions of Water Usage in the State of Colorado1
1 CDPHE 2007B
Classifications Definitions Primary Contact
Recreation
Recreational activities were the ingestion of small quantities of water is likely to occur. Such activities include but are not limited to swimming, rafting, kayaking, tubing, windsurfing, water-skiing, and frequent play by children.
Recreation Class E
Class E - Existing Primary Contact Use
These surface waters are used for primary contact recreation or have been used for such activities since November 28, 1975
Recreation Class P
Class P - Potential Primary Contact Use
These surface waters have the potential to be used for primary contact recreation. This classification shall be assigned to water segments for which no use attainability analysis has been performed demonstrating that a recreation class N classification is appropriate, if a reasonable level of inquiry has failed to identify any existing primary contact uses of the water segment, or where the conclusion of a UAA is that primary contact uses may potentially occur in the segment, but there are no existing primary contact uses.
Recreation Class N
Class N - Not Primary Contact Use
These surface waters are not suitable or intended to become suitable for primary contact recreation uses. This
classification shall be applied only where a use attainability analysis demonstrates that there is not a reasonable likelihood that primary contact uses will occur in the water segment(s) in question with in the next 20-year period.
Recreation Class U
Class U - Undetermined Use
These are surface waters whose quality is to be protected at the same level as existing primary contact use waters, but for which there has not been a reasonable level of inquiry about existing recreational uses and no recreation use attainability analysis has been completed. This shall be the default classification until inquiry or analysis demonstrates that another classification is appropriate.
19
Table 2. (cont.) Definitions of Water Usage in the State of Colorado1
1 CDPHE 2007B
Classifications Definitions
Agriculture These surface waters are suitable or intended to become suitable for irrigation of crops usually grown in Colorado and which are not hazardous as drinking water for livestock.
Aquatic Life
These surface waters presently support aquatic life uses as described below, or such uses may reasonably be expected in the future due to the sustainability of present conditions, or the waters are intended to become suitable for such uses as a goal:
Class 1 - Cold water Aquatic
Life
These are waters that (1) currently are capable of sustaining a wide variety of cold water biota, including sensitive species, or (2) could sustain such biota but for correctable water quality conditions. Waters shall be considered capable of sustaining such biota where physical habitat, water flows or levels, and water quality conditions result in no substantial impairment of the abundance and diversity of species.
Class 1 - Warm Water Aquatic
Life
These are waters that (1) currently are capable of sustaining a wide variety of warm water biota, including sensitive species, or (2) could sustain such biota but for correctable water quality conditions. Waters shall be considered capable of sustaining such biota where physical habitat, water flows or levels, and water quality conditions result in no substantial impairment of the abundance and diversity of specifies.
Class 2 - Cold and Warm Water Aquatic
Life
These are waters that are not capable of sustaining a wide variety of cold or warm water biota, including sensitive species, due to physical habitat, water flows or levels, or uncorrectable water quality conditions that result in substantial impairment of the abundance and diversity of species.
20
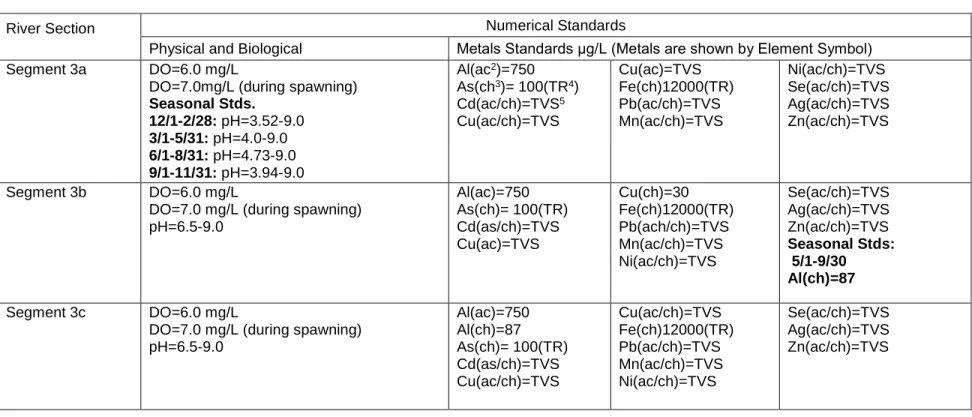
Table 3. Alamosa River Water Standards Set by the Colorado Department of Public Health and Environment1
1 USFWS 2005 2 ac: Acute standard 3 ch: Chronic standard
4 TR: Total recoverable concentrations 5 TVS: Table value standard
River Section
Numerical Standards
Physical and Biological Metals Standards μg/L (Metals are shown by Element Symbol) Segment 3a DO=6.0 mg/L
DO=7.0mg/L (during spawning)
Seasonal Stds. 12/1-2/28: pH=3.52-9.0 3/1-5/31: pH=4.0-9.0 6/1-8/31: pH=4.73-9.0 9/1-11/31: pH=3.94-9.0 Al(ac2)=750 As(ch3)= 100(TR4) Cd(ac/ch)=TVS5 Cu(ac/ch)=TVS Cu(ac)=TVS Fe(ch)12000(TR) Pb(ac/ch)=TVS Mn(ac/ch)=TVS Ni(ac/ch)=TVS Se(ac/ch)=TVS Ag(ac/ch)=TVS Zn(ac/ch)=TVS Segment 3b DO=6.0 mg/L DO=7.0 mg/L (during spawning) pH=6.5-9.0 Al(ac)=750 As(ch)= 100(TR) Cd(as/ch)=TVS Cu(ac)=TVS Cu(ch)=30 Fe(ch)12000(TR) Pb(ach/ch)=TVS Mn(ac/ch)=TVS Ni(ac/ch)=TVS Se(ac/ch)=TVS Ag(ac/ch)=TVS Zn(ac/ch)=TVS Seasonal Stds: 5/1-9/30 Al(ch)=87 Segment 3c DO=6.0 mg/L DO=7.0 mg/L (during spawning) pH=6.5-9.0 Al(ac)=750 Al(ch)=87 As(ch)= 100(TR) Cd(as/ch)=TVS Cu(ac/ch)=TVS Cu(ac/ch)=TVS Fe(ch)12000(TR) Pb(ac/ch)=TVS Mn(ac/ch)=TVS Ni(ac/ch)=TVS Se(ac/ch)=TVS Ag(ac/ch)=TVS Zn(ac/ch)=TVS
21
Table 3. (cont.) Alamosa River Water Standards Set by the Colorado Department of Public Health and Environment1
1 USFWS 2005 2 ac: Acute standard 3 ch: Chronic standard
4 TR: Total recoverable concentrations 5 TVS: Table value standard
River Section
Numerical Standards
Physical and Biological Metals Standards μg/L (Metals are shown by Element Symbol) Segment 3d DO=6.0 mg/L DO(during spawning)=7.0 mg/L pH=6.5-9.0 Al(ac2)=750 Al(ch3)=87 As(ch)= 100(TR4) Cd(as/ch)=TVS5 Cu(ac/ch)=TVS Fe(ch)12000(TR) Pb(ach/ch)=TVS Mn(ac/ch)=TVS Ni(ac/ch)=TVS Se(ac/ch)=TVS Ag(ac/ch)=TVS Zn(ac/ch)=TVS Segment 5 pH=6.5-9.0 As(ch)= 50(TR) Cd(as/ch)=TVS Cu(ac/ch)=TVS Fe(ch)1000(TR) Pb(ac/ch)=TVS Mn(ac/ch)=TVS Ni(ac/ch)=TVS Se(ac/ch)=TVS Ag(ac/ch)=TVS Zn(ac/ch)=TVS
Segment 6 No limits No limits No limits No limits Segment 9 D.O=6.0 mg/L DO(during spawning)=7.0 mg/L pH=6.5-9.0 Al(ac)=750 Al(ch)=87 As(ch)= 100(TR) Cd(as/ch)=TVS Cu(ac/ch)=TVS Fe(ch)1000(TR) Pb(ach/ch)=TVS Mn(ac/ch)=TVS Mn(ch)=200 Ni(ac/ch)=TVS Se(ac/ch)=TVS Ag(ac/ch)=TVS Zn(ac/ch)=TVS
22
I, J, and K, due to them being located on private land. We chose an additional site above
Summitville Mine along Wightman Fork. This was done to provide a pristine control site
for our study. The control site allows us to compare metal concentrations in the river
above and below the mine to determine the effects that the mine has on the downstream
portion of the Alamosa River. The Alamosa watershed is broken up into different
segments. Each segment of the Alamosa watershed has different water standards.
Because of this we made sure that each of our sampling locations was located within the
sections of interest. The sampling locations that were used in this study can be seen in
Figure 4. Descriptions of the sampling sites location can be seen in Table 4 as well as the
segments specific water classification.
Sampling Method for Water
Water samples were collected in accordance with United States Geological
Survey (USGS) water sampling protocol (USDI 2009). Since our time period for sample
collections was during the run off season, a Polyvinyl Chloride (PVC) pipe with a
diameter of 3.1centimeters (cm) and 1.8288 meters (m) in length was designed with an
extendable arm that allowed for the collection of samples from the middle of the river,
from the safety of the bank. The extendable arm was a PVC pipe that had a diameter of
2.5 cm and was approximately 3.048 m in length. The arm slid in and out of the first PVC
pipe. The second PVC pipe had a 90° angle with an additional 30.5 cm piece of PVC pipe
at one end, which was notched to hold the nalgene container for water collection with
plastic zip ties. The water samples were collected in sterile nalgene bottles upstream of
any man made structure. The bottles were submerged to a depth of approximately 10 cm
23
Figure 4. Map of the Alamosa Watershed Marked with 2009 Field Sampling Locations and GPS Coordinates.
This is a modified image is from the Alamosa River Watershed Restoration Master Plan and Environmental Assessment (River Watershed, 2005). It has been modified to show the 2009 field collection sites that were used for the completion of this study. The collection sites are indicated by the Xs. The collection sites were accessed by the use Forest Service Roads 255, 250 and 380.
24
Table 4. Alamosa River Segment Descriptions and Water Classifications1
Sampling Location River Section Description Classifications
7 Segment 5 Mainsterm of Wightman Fork from source to west line of S30, T37N, R4E, including all tributaries and wetlands.
Cold 1 Aq Life Recreation E Agriculture 5 Segment 6 Manistem of Wightman Fork from the west life of S30, T37N, R4E to
the confluence with the Alamosa River.
Recreation E Agriculture 6 Segment 3a
Mainsterm of the Alamosa River from immediately above the confluence with Alum Creek to immediately above the confluence of Wightman Fork.
Cold 2 Aq Life Recreation E Agriculture 4 Segment 3b
Mainsterm of the Alamosa River from immediately above the
confluence with Wightman Fork to immediately above the confluence with Fern Creek.
Cold 1 Aq Life Recreation E Agriculture 3 Segment 3c Mainsterm of the Alamosa River from immediately below the
confluence with Fern Creek to the Confluence with Ranger Creek.
Cold 1 Aq Life Recreation E Agriculture
2 Segment 3d Mainsterm of the Alamosa River from immediately below the confluence with Ranger Creek to the inlet of Terrace Reservoir.
Cold 1 Aq Life Recreation E Agriculture
1 Segment 9 Mainstem of the Alamosa River from the outlet Terrace Reservoir to Colorado Hwy 15.
Cold 1 Aq Life Recreation E Agriculture 1 CWCB 2005A
25
bottles were always handled with sterile gloves. After collection the samples were labeled
and placed in Ziplock bags to be stored on ice until reaching the laboratory. Within 24
hours from collection, half of the water in each of the water samples was filtered through
a Corning 25mm sterile non-pyrogenic syringe filter and placed into its own sterile
nalgene container. The non-filtered halves were used to measure the total amount of
metals in the water. The filtered samples were used to measure the dissolved heavy
metals that were present in the water. After the samples were separated into a total
recoverable sample and a dissolved sample, trace grade nitric acid was titrated in to the
samples until they reached a pH of 2.0 (Creed et al. 1994). The addition of the trace grade
nitric acid was done for preservation and for the analysis of the samples while using the
Inductively Coupled Plasma-Mass Spectrometry (ICP-MS).
Inductively Coupled Plasma-Mass Spectrometry (ICP-MS)
The water samples were processed in the Environmental Laboratories of the
Chemistry Department at Colorado State University- Pueblo and analyzed using an
Inductively Coupled Plasma-Mass Spectrometry (ICP-MS) as described in the
Environmental Protection Agency (EPA) Method 200.8, Determination of Trace
Elements in Waters and Wastes by Inductively Coupled Plasma. Samples were
transferred into ≥20mL polypropylene centrifuge tube once in the tube the pH was double checked to ensure it was at a pH of 2 and was then run in the ICP-MS. The ICP-MS
analyzed the samples for 27 different heavy metals including: 23Na, 24Mg, 27Al, 31P, 39K,
40Ca, 44Ca, 51V, 52Cr, 55Mn, 56Fe, 59Co, 60Ni, 63Cu, 66Zn, 75As, 78Se, 98Mo, 107Ag, 111Cd,
121Sb, 133Cs, 137Ba, 202Hg, 205Tl, 208Pb, 232Th, and 238U. The heavy metals in the subset
26
in water samples were previously recorded and reported upon in previous reports
specifically dealing with the Alamosa River and/or the heavy metal concentrations must
be below a specific standard set by the Colorado Department of Public Health (CDPHE).
Onsite Water Tests
In addition to analyzing the water for heavy metals, the dissolved oxygen (DO),
pH and temperature for each site was recorded during each sampling. The DO was tested
using a LaMotte DO Test Kit (Model EDO, Code 7414). Since the EPA would like to
reintroduce fish into this watershed and Terrace Reservoir, we felt that it was important
to determine if DO concentrations would be supportive at this state in the remediation for
the reintroduction of fish (USGS 1995A; CWCB 2005A). The pH of the water was tested
using an automated pH indicator from Oakton Instruments (Model 35624-03). The
temperature of the water was recorded using two thermometers from Fisher brand. The
thermometers were placed in the river for approximately 5 minutes and collected after all
of the sampling was done at that site.
Sampling Method for Sediment
The sediment was collected using a Polyvinyl Chloride (PVC) sediment corer.
The corer was hand-made from a piece of PVC pipe with a diameter of 3.1centimeters
(cm) and it was cut to a length of 35cm. The outer edge of the pipe was beveled towards
the center so it would slide into the sediment. The sediment cores were collected on the
bank of the river, analogous with the same location of the water sampling. Two sediment
samples were collected; the first sample consisted of the first 5 cm of sediment, the
second sample was the next 10 cm of sediment, for a total depth of 15 cm. The corer was
27
suction was created on the free end of the corer, which was pulled out with the sediment
core inside of it. The two samples were stored in separate Ziplock bags, on ice until
returning to the lab. The sediment samples were collected at the two depths in order to
examine movement of heavy metals through the sediment. Upon returning to the lab the
sediment samples were oven-dried at approximately 30° C ±4°C for 24 hours (USEPA
1996). Samples were then sieved to particles with a diameter less than 2 millimeters
(mm) and stored in plastic containers until time of chemical analysis.
Chemical Digestion for Sediment Samples
The sediment samples were processed in the Environmental Laboratories of the
Chemistry Department at Colorado State University- Pueblo. The sediment samples were
chemically digested in a microwave system using the Environmental Protection Agency
(EPA) Method 3052 (USEPA 1996). Samples were digested in Teflon tubes that
contained a 100 milliliters (mL) quartz reaction vessel with 0.2 grams (g) of sediment,
4.5 mL of Trace grade Nitric acid and 1.5 mL of Trace grade HCl. After the quartz
reaction vessel was prepared 10ml of H2O and 2 mL of H2O2 were placed on the outside
of the quartz vessel inside of the Teflon tube. The digestion was then run for a total of 15
minutes once the microwave reached 180°C. After the samples had been chemically
digested they were then run in the Inductively Coupled Plasma-Mass Spectrometry
(ICP-MS) for analysis of their heavy metal content. The sediment samples were analyzed with
the ICP-MS using EPA Method 6020A, Inductively Coupled Plasma-Mass Spectrometry
(USEPA 2007A). EPA Method 6020A is very similar to 200.8 however; it is for sediment
and solid samples. The ICP-MS analyzed the sediment samples for the same 27 heavy
28
following requirements: the heavy metals concentrations in sediment samples were
previously recorded and reported upon in previous reports specifically dealing with the
Alamosa River and/or the heavy metal concentrations must be below specific standards
known as the Ecological Soil Screening Levels (ECSSL) set by the Environmental
Protection Agency (EPA).
Sampling Method for Tree Cores
Two trees along the river were selected at random at each site, based on water and
sediment sampling sites. Two different species of trees had to be sampled due to tree
species changing as the sites increased in elevation. Cottonwoods (sc. Populus deltoids)
were sampled below and above Terrace Reservoir (segments 9 and 3d) and Quaking
Aspens (sc. Populus tremuloides.) were sampled at the rest of the sites (segments 3a, 3b,
3c and 6). The pristine site (segment 5) did not have any deciduous trees surrounding its
location, so no samples were collected there. The cores were taken from the tree at breast
height (1.5 meters) using a steel borer. After harvesting an individual core they were
placed in a Ziplock bag and placed in the cooler for transport to the laboratory where the
tree cores were oven-dried in glass containers at 70° C for 48 hours (Watmough and
Hutchinson 1995). The cores were then separated into ten year periods from 1980 to
2009. This was done that way the metal contamination could be evaluated for each of the
decade time periods. The decade time periods were then homogenized using a mortar and
pestle, prior to the samples chemical digestion.
Chemical Digestion for Tree Core Samples
Tree core samples were processed in the Environmental Laboratories of the
29
digested in a microwave system using the Environmental Protection Agency (EPA)
Method 3052 (USEPA 1996). Samples were digested in Teflon tubes that contained a 6
milliliters (mL) quartz reaction vessel with 0.2 grams (g) of tree core, 1 mL of Trace
grade Nitric acid and 0.5 mL of Trace grade HCl. After the quartz reaction vessel was
prepared 10 ml of H2O and 2 mL of H2O2 were placed on the outside of the quartz vessel
inside of the Teflon tube. The digestion was then run for a total of 15 minutes once the
microwave reached 180°C. After the samples had been chemically digested they were
then run in the Inductively Coupled Plasma-Mass Spectrometry (ICP-MS) for analysis of
their heavy metal content. The tree core samples were analyzed with the ICP-MS using
EPA Method 6020A, Inductively Coupled Plasma-Mass Spectrometry (USEPA 2007A).
EPA Method 6020A is very similar to 200.8 however; it is for sediment and solid
samples. The ICP-MS analyzed the tree core samples for the same 27 heavy metals as
water samples. The heavy metals in the subset were chosen based on one of the following
requirements: the heavy metals concentrations in tree core samples were previously
recorded and reported upon in previous reports specifically dealing with the Alamosa
River and/or the heavy metal concentrations must be below the specific plant standards in
the Ecological Soil Screening Levels (ECSSL) set by the Environmental Protection
Agency (EPA).
Statistical Analysis
The water samples were statistically analyzed using a Mann Whitney test and a
Kruskal Wallis test in order to determine if the sample locations were significantly
different than the pristine site (segment 5; Crocket 2006). These tests were used instead
30
sediment samples were not skewed; therefore they were analyzed using an ANOVA test.
The ANOVA test also tested to see if the sample locations were significantly different
than the pristine sample site. The tree cores were statistically analyzed using an ANOVA
test to determine if concentrations were significantly different among segments within a
single decade. Paired T-Tests were used to determine if decades among individual sites
were significantly different.
RESULTS
Onsite Testing Results
Dissolved oxygen (DO) concentrations in the 2009 sampling season ranged from
2.0-6.4 milligrams/liter (mg/L) in the Alamosa River. The DO concentrations of water
samples that were collected at each segment for the entire season are provided in Table 5.
The majority of our samples did not meet the Colorado Department of Public Health and
Environment (CDPHE) minimum standard of 6 mg/L (Murphy 2007). Samples in the
volcanically altered area (segment 3a), below the Wightman Fork mine drainage
(segments 3b and 3c) and below Terrace Reservoir (segment 9) were all below the
CDPHE standard of 6 mg/L (Figure 5). The 2009 mean DO concentrations and DO
standards can be seen in Figure 5. Samples below the mine drainage (segment 3d) had 5
out of 6 concentrations below the CDPHE standard (Table 5; Figure 6). The number of
times that the DO concentrations were not in compliance with the DO standards can be
seen in Figure 6. The pristine site (segment 5) and the mine drainage (segment 6) have no
dissolved oxygen (DO) CDPHE standards (USFWS 2005; Table 5). However; the
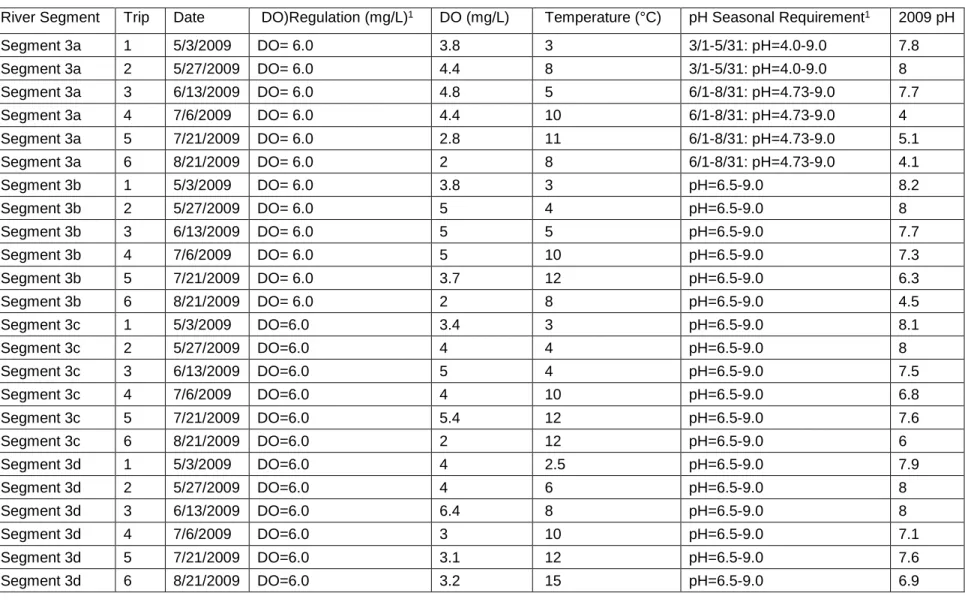
pristine site (segment 5) is classified by the CDPHE as suitable for Class 1 Cold Water
31
Table 5. May –August 2009 Dissolved Oxygen (DO), Mean Temperature and pH Readings for the Alamosa River
River Segment Trip Date DO)Regulation (mg/L)1 DO (mg/L) Temperature (°C) pH Seasonal Requirement1 2009 pH Segment 3a 1 5/3/2009 DO= 6.0 3.8 3 3/1-5/31: pH=4.0-9.0 7.8 Segment 3a 2 5/27/2009 DO= 6.0 4.4 8 3/1-5/31: pH=4.0-9.0 8 Segment 3a 3 6/13/2009 DO= 6.0 4.8 5 6/1-8/31: pH=4.73-9.0 7.7 Segment 3a 4 7/6/2009 DO= 6.0 4.4 10 6/1-8/31: pH=4.73-9.0 4 Segment 3a 5 7/21/2009 DO= 6.0 2.8 11 6/1-8/31: pH=4.73-9.0 5.1 Segment 3a 6 8/21/2009 DO= 6.0 2 8 6/1-8/31: pH=4.73-9.0 4.1 Segment 3b 1 5/3/2009 DO= 6.0 3.8 3 pH=6.5-9.0 8.2 Segment 3b 2 5/27/2009 DO= 6.0 5 4 pH=6.5-9.0 8 Segment 3b 3 6/13/2009 DO= 6.0 5 5 pH=6.5-9.0 7.7 Segment 3b 4 7/6/2009 DO= 6.0 5 10 pH=6.5-9.0 7.3 Segment 3b 5 7/21/2009 DO= 6.0 3.7 12 pH=6.5-9.0 6.3 Segment 3b 6 8/21/2009 DO= 6.0 2 8 pH=6.5-9.0 4.5 Segment 3c 1 5/3/2009 DO=6.0 3.4 3 pH=6.5-9.0 8.1 Segment 3c 2 5/27/2009 DO=6.0 4 4 pH=6.5-9.0 8 Segment 3c 3 6/13/2009 DO=6.0 5 4 pH=6.5-9.0 7.5 Segment 3c 4 7/6/2009 DO=6.0 4 10 pH=6.5-9.0 6.8 Segment 3c 5 7/21/2009 DO=6.0 5.4 12 pH=6.5-9.0 7.6 Segment 3c 6 8/21/2009 DO=6.0 2 12 pH=6.5-9.0 6 Segment 3d 1 5/3/2009 DO=6.0 4 2.5 pH=6.5-9.0 7.9 Segment 3d 2 5/27/2009 DO=6.0 4 6 pH=6.5-9.0 8 Segment 3d 3 6/13/2009 DO=6.0 6.4 8 pH=6.5-9.0 8 Segment 3d 4 7/6/2009 DO=6.0 3 10 pH=6.5-9.0 7.1 Segment 3d 5 7/21/2009 DO=6.0 3.1 12 pH=6.5-9.0 7.6 Segment 3d 6 8/21/2009 DO=6.0 3.2 15 pH=6.5-9.0 6.9 1 USFWS 2005
32
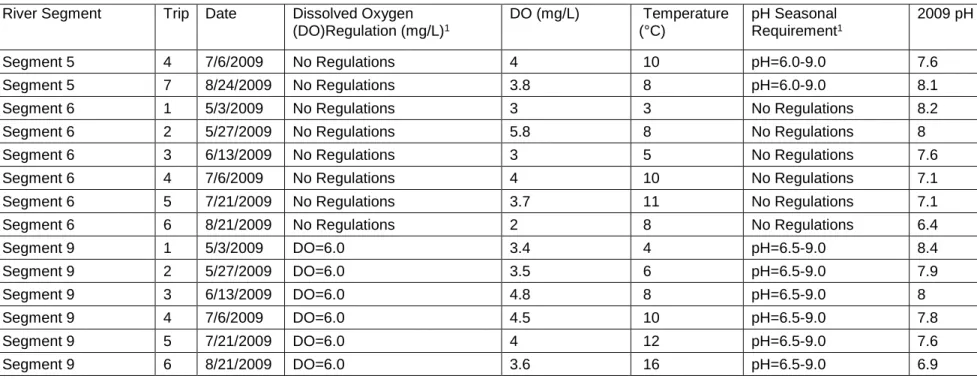
Table 5. (cont.) May –August 2009 Dissolved Oxygen (DO), Mean Temperature and pH Readings for the Alamosa River
River Segment Trip Date Dissolved Oxygen (DO)Regulation (mg/L)1 DO (mg/L) Temperature (°C) pH Seasonal Requirement1 2009 pH Segment 5 4 7/6/2009 No Regulations 4 10 pH=6.0-9.0 7.6 Segment 5 7 8/24/2009 No Regulations 3.8 8 pH=6.0-9.0 8.1 Segment 6 1 5/3/2009 No Regulations 3 3 No Regulations 8.2 Segment 6 2 5/27/2009 No Regulations 5.8 8 No Regulations 8 Segment 6 3 6/13/2009 No Regulations 3 5 No Regulations 7.6 Segment 6 4 7/6/2009 No Regulations 4 10 No Regulations 7.1 Segment 6 5 7/21/2009 No Regulations 3.7 11 No Regulations 7.1 Segment 6 6 8/21/2009 No Regulations 2 8 No Regulations 6.4 Segment 9 1 5/3/2009 DO=6.0 3.4 4 pH=6.5-9.0 8.4 Segment 9 2 5/27/2009 DO=6.0 3.5 6 pH=6.5-9.0 7.9 Segment 9 3 6/13/2009 DO=6.0 4.8 8 pH=6.5-9.0 8 Segment 9 4 7/6/2009 DO=6.0 4.5 10 pH=6.5-9.0 7.8 Segment 9 5 7/21/2009 DO=6.0 4 12 pH=6.5-9.0 7.6 Segment 9 6 8/21/2009 DO=6.0 3.6 16 pH=6.5-9.0 6.9 1 USFWS 2005
33
Figure 5. Mean Dissolved Oxygen (DO) Values from the 2009 Collections Season with Their Corresponding Standards set by the Colorado Department of Public Health and Environment (CDPHE).
Above are the 2009 mean DO concentrations (1.) and the CDPHE DO Standards (2.) by segment. Mean DO concentrations in the volcanically altered area (segment 3a), the pristine site (segment 5), below the Wightman Fork mine drainage (segments 3b, 3c and 3d) and below Terrace Reservoir (segment 9) all were below the Class 1 Cold Water Aquatic Life standard. Mean DO concentrations in the volcanically altered area (segment 3a) were also below the Class 2 Cold Water Aquatic Life standard. Mean DO concentrations in all segments were in compliance with the Recreational Standard of 3 mg/L.