Technical Bulletin
TB12-01
Ag
ricultural
Experiment Station
College of Agricultural Sciences Department of Soil and Crop
Sciences Sciences and Pest Management Department of Bioagricultural
Sustainable Dryland
i
2012
SUSTAINABLE DRYLAND AGROECOSYSTEMS MANAGEMENT
1D.G. Westfall
2, L.Sherrod
4, F. B. Peairs
3, D. Poss
8,
N.C. Hansen
2, G.A. Peterson
2, T. Shaver
5K. Larson
6, D.L. Thompson
5, L.R. Ahuja
7, M.D. Koch
5, and C. B. Walker
5A Cooperative Project
of the
Colorado Agricultural Experiment Station
Department of Soil and Crop Sciences
Department of Bioagricultural Sciences and Pest Management
Colorado State University
Fort Collins, Colorado
and the
USDA - Agriculture Research Service
Natural Resources Research Center
Great Plains Systems Research Unit
Fort Collins, Colorado
1
Funding is provided by the Colorado Agricultural Experiment Station and USDA-ARS.
2Professor/Associate Professor, Department of Soil and Crop Sciences, Colorado State
University, Fort Collins, CO 80523
3
Professor, Department of Bioagricultural Sciences and Pest Management, Colorado State
University, Fort Collins, CO 80523
4
USDA-ARS Soil Scientist – Agricultural Systems Research Unit, Fort Collins
5Research Associates, Colorado State University
6
Research Scientist, Plainsman Research Center at Walsh, Colorado
7USDA-ARS Research Leader - Great Plains Systems Research Unit
8
Former Research Associate, Colorado State University, presently Soil Scientist, USDA-ARS
Central Great Plains Research Station
**Mention of a trademark or proprietary product does not constitute endorsement by the Colorado Agricultural Experiment Station** Colorado State University is an equal opportunity/affirmative action institution and complies with all Federal and Colorado State laws, regulations, and executive orders regarding affirmative action requirements in all programs. The Office of Equal Opportunity is located in 101 Student Services. In order to assist Colorado State University in meeting its affirmative action responsibilities, ethnic minorities, women, and other protected class members are encouraged to apply and to so identify themselves.
ii
Contents
Subject
Pages
Project History
1-2
Introduction
3-4
Materials and Methods
4-9
Section A
Dryland Cropping Systems Production – 2003 Results and Discussion
Results and Discussion
Climate
10
Wheat
10-11
Corn and Sorghum
11-12
Millett, Proso and Hay
12
Sunflower
12
Mung bean
12
Crop Residue Base
12-13
Nitrogen Content of Grain and Stover
13
Soil Moisture
13
Entomological Data – 2003 Results and Discussion
Results and Discussion
Wheat
13
Aphids
13-14
Brown Wheat Mite
14
Other Pests
14
Predators
14
Corn and Sorghum
15
Millet
15
iii
Section B
Dryland Cropping Systems Production – 2004 Results and Discussion
Results and Discussion
Climate
16
Wheat
16-17
Corn and Sorghum
17-18
Hay Millet
18
Millet/Mung Beans
18
Sunflowers
18
Residues
19
Nitrogen Content of Grain and Stover
20
Soil Nitrate
19
Soil Moisture
20
Entomological Data – 2004 Results and Discussion
Results and Discussion
Wheat
20
Aphids
20
Brown Wheat Mite
20
Other Pests
21
Millet
21
Corn and Sorghum
21
Sunflower
21
Section C
Dryland Cropping Systems Production – 2005 Results and Discussion
Results and Discussion
Climate
22
Wheat
22-23
Corn and Sorghum
23
Barley
23
Millet
23
Hay Millet
24
Residues
24
Soil compaction
24
Nitrogen Content of Grain and Stover
25
iv
Entomological Data – 2005 Results and Discussion
Results and Discussion
Wheat
25
Corn
25
Millet
26
Data Tables Section A - 2003
30-59
Data Tables Section B - 2004
60-101
Data Tables Section C - 2005
102-134
Appendix A – Crop variety, seeding rate and planting dates
135-140
Appendix B - Annual Herbicide Programs for Each Site
141-169
v
Table Title
Page
Table 1. Elevation, long-term average annual precipitation, and evaporation characteristics for
each site.
4
Table 2a. Cropping systems for each of the original sites in 2003-2005.
27
Table 2b. Opportunity cropping history from 1985 to 2005 at the three original sites.
28
Table 2c. Cropping systems for the sites initiated in 1997 in the three new sites and in place
from 2003-2005.
29
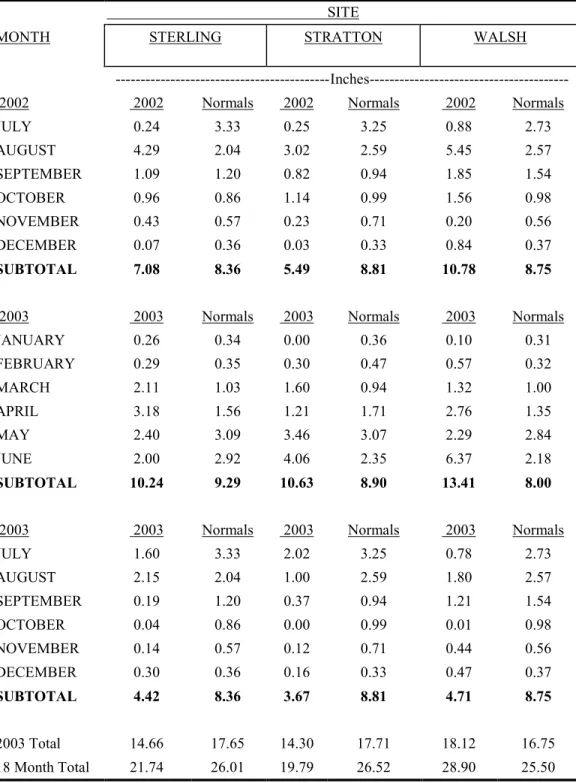
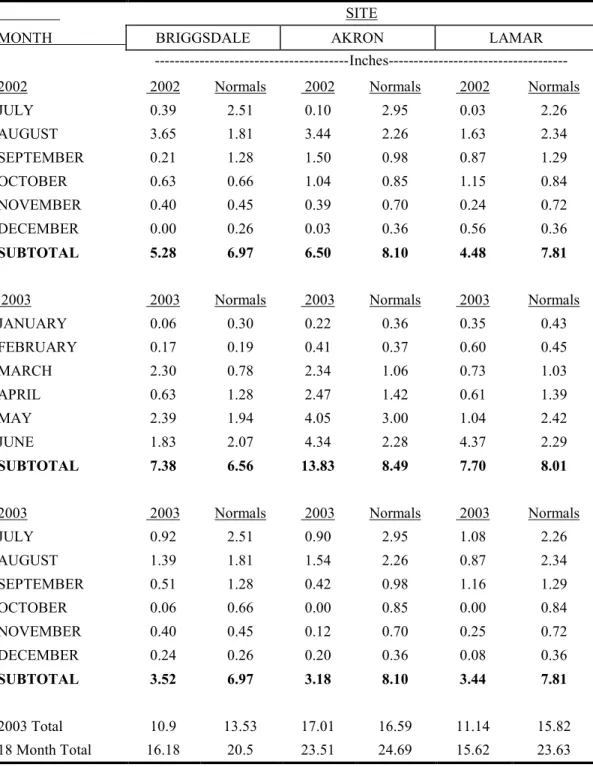
Table 3a. Monthly precipitation for the original sites for the 2002-2003 growing seasons.
30
Table 3b. Monthly precipitation for the three new sites for the 2002-2003 growing seasons.
31
Table 4a. Precipitation by growing season segments for Sterling from 1987-2003.
32
Table 4b. Precipitation by growing season segment for Stratton from 1987 -2003
33
Table 4c. Precipitation by growing season segment for Walsh from 1987-2003.
34
Table 5a. Precipitation by growing season segment for Briggsdale from 1999-2003.
35
Table 5b. Precipitation by growing season segment for Akron from 1997-2003.
35
Table 5c. Precipitation by growing season segment for Lamar from 1997-2003
35
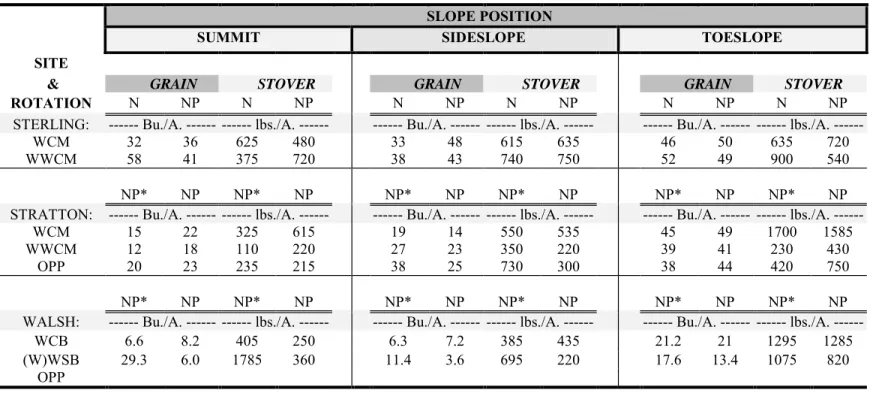
Table 6. Grain and stover (straw) yields for wheat at Sterling, Stratton, and Walsh in 2003.
36
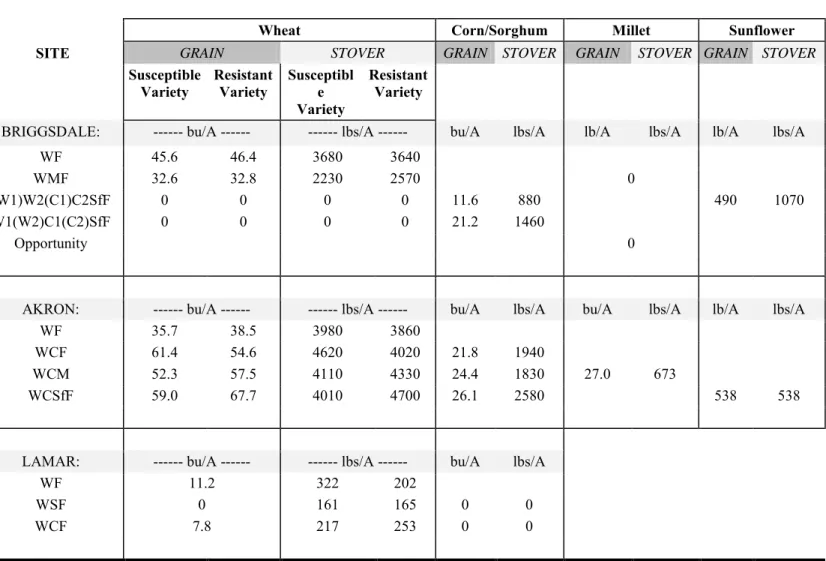
Table 7. Grain and stover (straw) yields at Briggsdale, Akron and Lamar for all crops in
English units in 2003
37
Table 8. Grain and stover yields for corn/sorghum at Sterling, Stratton and Walsh in 2003.
38
Table 9. Grain and straw yields for millet at Sterling and Stratton and mung bean at Walsh in
2003.
39
Table 10. Crop residue weights at planting of all crops at Briggsdale, Akron and Lamar
during the 2002 - 2003 crop year.
40
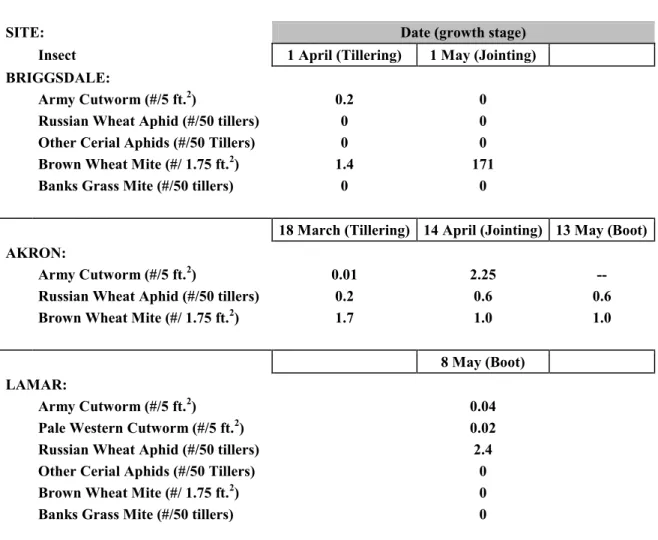
Table 11. Pest insects in wheat at various sampling dates in 2003 averaged across systems.
41
Table 12. Insects in corn or sorghum at various sampling dates in 2003 averaged across
systems
42
Table 13. Pest insects in sunflowers at various sampling dates in 2003.
43
Table 14. Total Nitrogen content of wheat grain in the 2002-2003 crop.
44
Table 15. Total Nitrogen content of wheat straw in the 2002-2003 crop.
45
Table 16. Total Nitrogen content of corn grain or sorghum grain in the 2003 crop.
46
Table 17. Total Nitrogen content of corn or sorghum stover in the 2003 crop
47
Table 18. Total Nitrogen content of millet grain at Sterling and Stratton 2003 crop.
48
Table 19. Total Nitrogen content of millet straw at Sterling and Stratton and mung bean at
WALSH in the 2003 crop.
49
Table 20. Available soil water by soil depth of the WHEAT phase in the WCM rotation at
Sterling and Stratton, and the WCSb rotation at Walsh in 2003.
50
Table 21. Available soil water by soil depth of the WHEAT phase in the WCF rotation at
Sterling and Stratton, and the WSF rotation at Walsh in 2003.
51
Table 22. Available soil water by soil depth of the WHEAT 1 phase in the WWCM rotation at
Sterling and Stratton, and the WWSM rotation at Walsh in 2003.
52
Table 23. Available soil water by soil depth of the WHEAT 2 phase in the WWCM rotation at
Sterling and Stratton, and the WWSM rotation at Walsh in 2003.
53
Table 24. Available soil water by soil depth of the CORN phase in the WCM rotation at
Sterling and Stratton, and the WCM rotation at Walsh in 2003.
54
Table 25. Available soil water by soil depth of the CORN phase in the WCF rotation at
55
vi
Sterling and Stratton, and the Sorghum phase of the WSF rotation at Walsh in 2003.
Table 26. Available soil water by soil depth of the CORN phase in the WWCM rotation at
Sterling and Stratton, and the Sorghum phase of the WWSM rotation at Walsh in 2003.
56
Table 27. Available soil water by soil depth of the MILLET phase in the WCM rotation at
Sterling, Stratton, and Walsh in 2003.
57
Table 28. Available soil water by soil depth of the MILLET phase in the WWCM rotation at
Sterling, Stratton, and Walsh in 2003.
58
Table 29. Available soil water by soil depth of the CORN phase in the OPP rotation at
Sterling and Walsh, and the MILLET phase of OPP at Stratton in 2003.
59
Table 30a. Monthly precipitation for the original sites for the 2003-2004 growing seasons.
60
Table 30b. Monthly precipitation for the three new sites for the 2003-2004 growing seasons.
61
Table 31a. Precipitation by growing season segments for Sterling from 1987-2004.
62
Table 31b. Precipitation by growing season segment for Stratton from 1987 - 2004.
63
Table 31c. Precipitation by growing season segment for Walsh from 1987-2004
64
Table 31d. Precipitation by growing season segment for Briggsdale from 1999-2004.
65
Table 31e. Precipitation by growing season segment for Akron from 1997-2004.
65
Table 31f. Precipitation by growing season segment for Lamar from 1997-2004.
65
Table 32. Grain and straw yields for wheat at Sterling, Stratton, and Walsh in 2004.
66
Table 33. Grain and straw yields for wheat at Briggsdale, Akron, and Lamar in 2004.
67
Table 34. Grain and stover yields for corn/sorghum at Sterling, Stratton and Walsh in 2004.
68
Table 35. Grain and stover yields for all crops at Briggsdale, Akron, and Lamar in 2004.
69
Table 36. Grain and straw yields for millet at Sterling and Stratton & bean in Walsh 2004.
70
Table 37. Crop residue weights at planting of all crops at Briggsdale, Akron and Lamar in
2003 - 2004.
71
Table 38. Pest insects in wheat by day in 2004 averaged across systems.
72
Table 39. Insects in corn or sorghum by day in 2004 averaged across systems.
73
Table 40. Pest insects in sunflowers by day in 2004, averaged across systems.
74
Table 41. Total Nitrogen content of wheat grain in the 2004 crop. No wheat yield for plots in
millet in 2003 for Sterling and Stratton.
75
Table 42. Total Nitrogen content of wheat straw in the 2004 crop. No wheat yield info for
plots in millet in 2003 for Sterling. No wheat yield at Stratton.
76
Table 43. Total Nitrogen content of corn grain or sorghum grain in the 2004 crop.
77
Table 44. Total Nitrogen content of corn or sorghum stover in the 2004 crop.
78
Table 45. Total Nitrogen content of millet or mung bean grain in the 2004 crop.
79
Table 46. Total Nitrogen content of millet or mung bean straw in the 2004 crop.
80
Table 47. Nitrate-N in the soil profile at Planting for each crop during 2003-2004 crop year.
81
Table 48. Available soil water by soil depth in the WHEAT phase of the WCF rotation at
Sterling, Stratton, and WSF at Walsh in 2004.
82
Table 49. Available soil water by soil depth in the WHEAT 1 phase of the WWCM rotation at
Sterling, Stratton, and WWSM at Walsh in 2004.
83
Table 50. Available soil water by soil depth in the WHEAT phase of the WCM rotation at
Sterling, Stratton, and WCM at Walsh in 2004
84
Table 51. Available soil water by soil depth in WHEAT 2 phase of the WWCM rotation at
Sterling and Stratton, and the WWSM rotation at Walsh in 2004.
85
Table 52. Available soil water by soil depth in the CORN phase of the WWCM rotation at
86
vii
Sterling and Stratton and the SORGHUM phase of the WWSM rotation at Walsh in 2004
Table 53. Available soil water by soil depth in the CORN phase of the WCF rotation at
Sterling and Stratton and the SORGHUM phase of the WSF rotation at Walsh in 2004
87
Table 54. Available soil water by soil depth in the CORN phase of the WCM rotation at
Sterling, Stratton, and Walsh in 2004.
88
Table 55. Available soil water by soil depth in the MILLET phase of the WCM rotation at
Sterling and Stratton in 2004.
89
Table 56. Available soil water by soil depth in the MILLET phase of the WWCM rotation at
Sterling and Stratton, and WWSM rotation at Walsh in 2004.
90
Table 57. Available soil water by soil depth of MILLET in the OPP rotation at Sterling and
Stratton, and SORGHUM in the OPP rotation at Walsh in 2004.
91
Table 58. Available soil water by soil depth in the WHEAT phase of the WCF rotation at
Sterling, Stratton, and WSF at Walsh in 2004.
92
Table 59. Available soil water by soil depth in the WHEAT 1 phase of the WWCM rotation at
Sterling, Stratton, and WWSM at Walsh in 2004.
93
Table 60. Available soil water by soil depth in the WHEAT phase of the WCM rotation at
Sterling, Stratton, and WCM at Walsh in 2004.
94
Table 61. Available soil water by soil depth in WHEAT 2 phase of the WWCM rotation at
Sterling and Stratton, and the WWSM rotation at Walsh in 2004.
95
Table 62. Available soil water by soil depth in the CORN phase of the WWCM rotation at
Sterling and Stratton and the SORGHUM phase of the WWSM rotation at Walsh in 2004.
96
Table 63. Available soil water by soil depth in the CORN phase of the WCF rotation at
Sterling and Stratton and the SORGHUM phase of the WSF rotation at Walsh in 2004.
97
Table 64. Available soil water by soil depth in the CORN phase of the WCM rotation at
Sterling, Stratton, and Walsh in 2004.
98
Table 65. Available soil water by soil depth in the MILLET phase of the WCM rotation at
Sterling and Stratton in 2004.
99
Table 66. Available soil water by soil depth in the MILLET phase of the WWCM rotation at
Sterling and Stratton, and WWSM rotation at Walsh in 2004.
100
Table 67. Available soil water by soil depth of MILLET in the OPP rotation at Sterling and
Stratton, and SORGHUM in the OPP rotation at Walsh in 2004.
101
Table 68a. Monthly precipitation for the original sites for the 2004 - 2005 growing season.
102
Table 68b. Monthly precipitation for the three new sites for the 2004 - 2005 growing season.
103
Table 69a. Precipitation by growing season segments for Sterling from 1987-2005
104
Table 69b. Precipitation by growing season segment for Stratton from 1987 - 2005.
105
Table 69c. Precipitation by growing season segment for Walsh from 1987-2005.
106
Table 69d. Precipitation by growing season segment for Briggsdale from 1999-2005.
107
Table 69e. Precipitation by growing season segment for Akron from 1997-2005.
107
Table 69f. Precipitation by growing season segment for Lamar from 1997-2005.
108
Table 70. Grain and straw yields for wheat at Sterling, Stratton, and Walsh in 2005.
109
Table 71. Grain and stover yields for corn/sorghum at Sterling, Stratton, and Walsh in 2005.
110
Table 72. Grain and stover (straw) yields at Briggsdale, Akron, and Lamar in 2005.
111
Table 73. Grain and stover yields for MILLET at Sterling, Stratton, and Walsh in 2005.
112
Table 74. Measure of Compaction (in millimeters) by cropping system and grazing using a
viii
Table 75. Crop residues prior to planting 2005 crops at Akron.
113
Table 76a. Pre-Plant residue levels at wheat planting fall 2004.
114
Table 76b. Pre-Plant residue levels at wheat planting fall 2005.
115
Table 76c. Pre-Plant residue levels at millet planting fall 2005.
116
Table 77. Total Nitrogen content of corn stover in the 2005 crop.
117
Table 78. Total Nitrogen content of corn grain in the 2005 crop.
118
Table 79. Total Nitrogen content of wheat grain in the 2005 crop.
119
Table 80. Total Nitrogen content of wheat straw in the 2005 crop.
120
Table 81. Total Nitrogen content of millet grain in the 2005 crop.
121
Table 82. Total Nitrogen content of millet grain in the 2005 crop.
122
Table 83. Available soil water by soil depth in the CORN phase of the OPP rotation at
Sterling and Walsh, and the MILLET phase of the OPP rotation at Stratton in 2005.
123
Table 84. Available soil water by soil depth in the CORN phase of the WCM rotation at
Sterling and Stratton and the SORGHUM phase of the WCM rotation at Walsh in 2005.
124
Table 85. Available soil water by soil depth in the CORN phase of the WWCM rotation at
Sterling and Stratton and the SORGHUM phase of the WWSM rotation at Walsh in 2005.
125
Table 86. Available soil water by soil depth in the MILLET phase of the WWCM rotation at
Sterling, Stratton, and Walsh in 2005.
126
Table 87. Available soil water by soil depth in the WHEAT 1 phase of the WWCM rotation at
Sterling, Stratton, and the WWSM rotation at Walsh in 2005.
127
Table 88. Available soil water by soil depth in the WHEAT 2 phase of the WWCM rotation at
Sterling, Stratton, and the WWSM rotation at Walsh in 2005.
128
Table 89. Available soil water by soil depth in the WHEAT phase of the WCF rotation at
Sterling, Stratton, and the WSF rotation at Walsh in 2005.
129
Table 90. Available soil water by soil depth in the WHEAT phase of the WCM rotation at
Sterling, Stratton, and the WCSb rotation at Walsh in 2005.
130
Table 91. Available soil water by soil depth in the CORN phase of the WCF rotation at
Sterling and Stratton and the SORGHUM phase of the WSF rotation at Walsh in 2005.
131
Table 92. Available soil water by soil depth in the MILLET phase of the WCM rotation at
Sterling, Stratton, and Walsh in 2005.
132
Table 93. Wheat insects at Akron for the 2004-2005 crop.
133
1
PROJECT HISTORY
The Dryland Agroecosystems Project was established in the fall of 1985 with the first
winter wheat and corn crops harvested in 1986. The long-term research objectives are to provide
producers with information that they can use to make management decisions under dryland
cropping conditions as well as to learn more about soil quality and carbon sequestration
parameters as impacted by intensive no-till dryland cropping systems in the semi arid
environment of the west central Great Plains. Grain yields, stover yields, crop residue amounts,
soil water measurements, and crop nutrient content have been reported annually in previously
published technical bulletins. This publication covers the 2003, 2004, and 2005 research results.
Common introduction and materials and methods sections are presented for these three years,
while the production parameters mentioned above are presented by year, in three sections
identified as Section A (2003), Section B (2004) and Section C (2005).
Results from past years have shown that cropping intensification, compared to traditional
stubble mulch tillage wheat fallow, is feasible and profitable in this environment if managed
under no-till or minimum-till systems. The range in cropping systems evaluated from 1986 to
1998 had intensive rotations like wheat-corn(sorghum)-fallow and
corn(sorghum)-millet-fallow with traditional corn(sorghum)-millet-fallow as the standard of comparison. Intense rotations of
wheat-corn(sorghum)-fallow and wheat-corn(sorghum)-millet-fallow more than doubled grain water use
efficiency. Increased water storage as a result of adoption of no-till systems makes cropping
intensification possible. The deletion of fallow, however, also increases the risk of water deficit
for the following crop. It is a management tradeoff between intensive cropping systems that
result in increased return and production under the traditional tilled wheat-fallow system where
risk due to moisture stress (drought) is less. Government programs can affect management
decisions greatly, particularly where producers have developed a good corn yield base.
Based on our findings with the intensive systems from 1985 to 1997 (12 cropping
seasons), we altered the systems in 1998 to reduce the amount of fallow in our cropping systems.
We now consider the 3-year (wheat-corn(sorghum)-fallow) system as the standard of comparison.
These changes will be outlined later in this report. Unfortunately, shortly after we made these
changes the region was hit with a drought. Some of the more intensive cropping systems have not
been successful during the drought. Winter wheat planted after wheat, millet, or corn harvest the
same year has suffered a high rate of crop failure or low yields due to lack of rain for germination
and inadequate stored soil moisture due to the short time period available to store water from rain
and snow.
New Research Sites:
The dryland agroecosystems project established linkage with the Department of Bioagricultural
Sciences and Pest Management in 1997. We are now evaluating the interactions of cropping
systems with both pest and beneficial insects at three new experimental sites. The new sites at
Briggsdale, Akron, and Lamar also allow us to test our most successful intensive cropping
systems at three new combinations of precipitation and evaporative demand and enable us to
study insect dynamics as influenced by cropping system. We want to know if the presence of
multiple crops in the system will alter populations of beneficial insects and provide new avenues
of biological pest management of Russian Wheat Aphid in wheat as well as insect pests in other
crops.
2
Adoption of Intensive Cropping Systems:
Producers in northeastern Colorado have been adopting the more intensive cropping systems at
an increasing rate since 1990, until 2002, the first year of the drought. The drought that started in
September-October of 2001 had a devastating effect on dryland crop yields in 2002, particularly
summer crops. Corn is one of the principal crops grown in the more intensive systems; thus we
use its acreage as an index of adoption rate by producers. Colorado Agricultural Statistic reported
that there were only 55,000 acres of dryland corn harvested in 2002 (See table below) in
Colorado. However, many thousands of additional acres were planted and not harvested. Since
dryland corn is almost exclusively grown under no-till in a three or four year rotation, the actual
acreage under intensive no-till dryland cropping systems is at least 3-4 times greater than the total
dryland corn acreage. The average economic impact is an increased return to land, labor, capital,
and management of $14.85/acre (Kann et al., 2002), under an “average” rainfall environment.
Dryland Corn Acreage in Eight Northeastern Colorado Counties and state total from 1971 to 2005.
Year Eight NE Counties* Total for State
Acres 1971-1988 21,200 23,700 1989 27,000 28,000 1990 26,000 26,000 1991 32,500 33,000 1992 48,500 50,000 1993 79,000 90,000 1994 92,500 100,000 1995 95,500 100,000 1996 104,000 110,000 1997 138,500 150,000 1998 191,000 240,000 1999 220,000 290,000 2000 198,000 340,000 2001 233,000 305,000 2002 50,000 55,000 2003 150,700 205,000 2004 183,700 325,000 2005 140,900 235,000
*Data from Colorado Agricultural Statistics (Adams, Kit Carson, Logan, Morgan, Phillips, Sedgewick, Washington, Yuma)
3
The drought has had a dramatic effect on producers’ ability to operate under intensive no-till
cropping systems management. After 2002, the dryland corn acreage increased to 205,000 in
2003, to 325,000 in 2004, and then decreased in 2005 to 235,000.
INTRODUCTION
Colorado agriculture is highly dependent on precipitation from both snow and rainfall. In
the dryland environment each unit of precipitation is critical to production. At Akron each
additional inch (25 mm) of water above the initial yield threshold translates into 4.5 bu/A of
dryland winter wheat (12 kg/ha/mm), consequently profit is highly related to water conservation
(Greb et al., 1974). These data point to the need for maximum precipitation use efficiency in this
semi-arid cropping environment and the importance of this project to producers.
The dryland cropping systems research project was established in 1985 to identify
systems that maximize efficient water use under dryland conditions in Eastern Colorado. A
more comprehensive justification for its initiation can be found in Peterson, et al. (1988). A
summary of our general understanding of the climate-soil-cropping systems interactions can be
found in a recent publication by Peterson and Westfall (2004).
The general objective of the project is to identify no-till dryland crop and soil
management systems that will maximize water use efficiency of the total annual precipitation
and economic return.
Specific objectives are to:
1. Determine if cropping sequences with fewer and/or shorter summer fallow periods are
feasible.
2. Quantify the relationships among climate (precipitation and evaporative demand), soil
type, and cropping sequences that involve fewer and/or shorter fallow periods.
3. Quantify the effects of long-term use of no-till management systems on soil structural
stability, micro-organisms and faunal populations, and the organic C, N, and P
content of the soil, all in conjunction with various crop sequences.
4. Identify cropping or management systems that will minimize soil erosion by crop
residue maintenance.
5. Develop a data base across climatic zones that will allow economic assessment of
entire management systems.
Peterson, et al. (1988) document details of the project in regard to the "start up" period
and data from the 1986-87 crop year. Previous year’s results have been reported in CSU
Agricultural Experiment Station Technical Bulletins that are available at the following web site:
http://www.colostate.edu/Depts/aes/pubs_list.html
. Other publications related to this project
have been published by various graduate students, faculty, and post doctoral students: Wood, et
al. (1990), Croissant, et al. (1992), Peterson, et al. (1993a & 1993b), Nielsen, et al. (1996),
Farahani, et al. (1998), Peterson and Westfall (2004).
MATERIALS AND METHODS
From 1986 -1997 we studied interactions of climate, soils and cropping systems at three
sites, located near Sterling, Stratton, and Walsh, in Eastern Colorado, that represent a gradient in
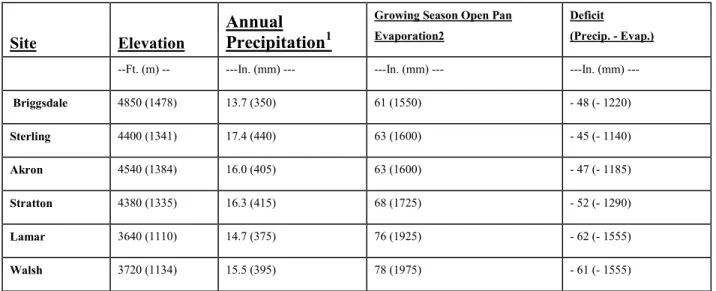
potential evapotranspiration (PET) (Fig. 1). Elevation, precipitation and evaporative demand are
5
shown in Table 1. All sites have long-term precipitation averages of approximately 16-18 inches
(400-450 mm), but increase in PET from north to south. Growing season open pan evaporation is
used as an index of PET.
Table 1. Elevation, long-term average annual precipitation, and evaporation characteristics
for each site.
Site
Elevation
Annual
Precipitation
1Growing Season Open Pan Evaporation2
Deficit (Precip. - Evap.) --Ft. (m) -- ---In. (mm) --- ---In. (mm) --- In. (mm) Briggsdale 4850 (1478) 13.7 (350) 61 (1550) - 48 (- 1220) Sterling 4400 (1341) 17.4 (440) 63 (1600) - 45 (- 1140) Akron 4540 (1384) 16.0 (405) 63 (1600) - 47 (- 1185) Stratton 4380 (1335) 16.3 (415) 68 (1725) - 52 (- 1290) Lamar 3640 (1110) 14.7 (375) 76 (1925) - 62 (- 1555) Walsh 3720 (1134) 15.5 (395) 78 (1975) - 61 (- 1555)
1
Annual precipitation = 1961-1990 mean;
2Growing season = March - October
Each of the original three sites (Sterling, Stratton, and Walsh) was selected to represent a
catenary sequence of soils common to the geographic area. Textural profiles for each soil at each
location are shown in Figures 2a, 2b, and 2c. There are dramatic differences in soils across slope
position at a given site and from site to site. We will contrast the summit soils at the three sites to
illustrate how different the soils are. Each profile was described by NRCS personnel in summer
1991. Note first how the summit soils at the three sites differ in texture and horizonation. The
surface horizons of these three soils (Ap) present a range of textures from loam at Sterling, to silt
loam at Stratton, to sandy loam at Walsh. Obviously the water holding capacities and infiltration
rates differ. An examination of the horizons below the surface reveals even more striking
6
The summit soil profile at Sterling (Figure 2a) changes from a clay content of 21% at the surface
(Ap) to 31% in the 3-8" depth (Bt1) to a clay content of 38% in the layer between the 8-12" depth
(Bt2). At the 12" depth the clay content drops abruptly to 27%. The water infiltration in this soil
is greatly reduced by this fine textured layer (Bt2). At about the 36" depth (2Bk3) there is an
abrupt change from 21% clay to 32% clay in addition to a marked increase in lime content. The
mixture of 32% clay and 45% sand with lime creates a partially cemented zone that is slowly
permeable to water, but relatively impermeable to roots. Profile plant available water holding
capacity is 9" in the upper 36 inches of the profile. This had limited crop production on this soil.
7
Figure 2a. Soil profile textural characteristics for soils at the Sterling site.
Sterling Summit Soil Profile
Horizon Depth; Inches
Ap Bt1 Bt2 Bt3 Bk1 Bk2 2Bk3 2Bk4 Clay = 21%; Sand= 45% Clay = 31%; Sand =33% Clay = 27%; Sand = 27% Clay = 22%; Sand =30% 0 12 24 36 48 60 72 Clay = 21%; Sand =43% Clay = 32%; Sand = 45% Clay = 23%; Sand =37% Clay = 38%; Sand=24% Partially cemented with lime
Sterling Sidelope Soil Profile
Horizon Depth; Inches
Ap1 Ap2 Bt Btk Bk1 2Bk2 2Bk3 2Bk4 Clay = 21% ; Sand= 54% Clay = 26% ; Sand =44% Clay = 28% ; Sand = 27% Clay = 22% ; Sand =36% 0 12 24 36 48 60 Clay = 9%; Sand =67% Clay = 3%; Sand = 79% Clay = 2%; Sand =86% Clay = 31% ; Sand=32%
Sterling Toeslope Soil Profile
Horizon Depth; Inches
Ap1 Ap2 Bt1 Bt2 Bk1 Bk2 2Bk3 2Bk4 Clay = 18%; Sand= 42% Clay = 20%; Sand =47% Clay = 25%; Sand = 40% Clay = 27%; Sand =30% 0 12 24 36 48 60 72 Clay = 20%; Sand =38% Clay = 14%; Sand = 59% Clay = 10%; Sand =76% Clay = 24%; Sand=46%
8
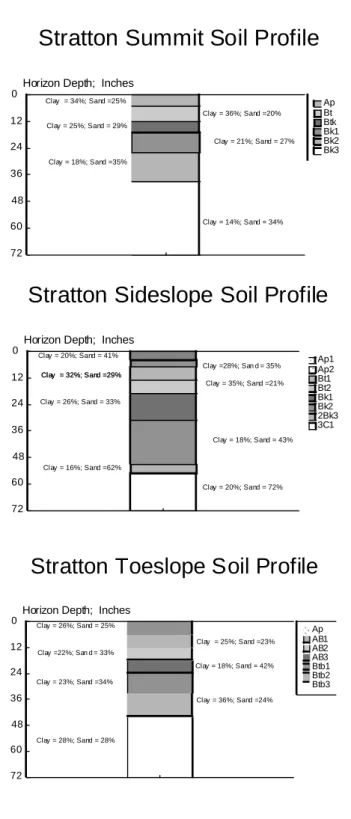
Figure 2b. Soil profile textural characteristics for soils at the Stratton site.
Stratton Sideslope Soil Profile
Horizon Depth; Inches
Ap1 Ap2 Bt1 Bt2 Bk1 Bk2 2Bk3 3C1 Clay = 32%; Sand =29% Clay = 35%; Sand =21% Clay = 26%; Sand = 33% Clay = 16%; Sand =62% 0 12 24 36 48 60 72 Clay = 18%; Sand = 43% Clay = 20%; Sand = 72% Clay = 32%; Sand =29% Clay =28%; San d = 35% Clay = 20%; Sand = 41%
Stratton Toeslope Soil Profile
Horizon Depth; Inches
Ap AB1 AB2 AB3 Btb1 Btb2 Btb3 Clay = 23%; Sand =34% Clay = 18%; Sand = 42% Clay = 36%; Sand =24% 0 12 24 36 48 60 72 Clay = 28%; Sand = 28% Clay = 25%; Sand =23% Clay =22%; San d = 33% Clay = 26%; Sand = 25%
Stratton Summit Soil Profile
Horizon Depth; Inches
Ap Bt Btk Bk1 Bk2 Bk3 Clay = 34%; Sand =25% Clay = 36%; Sand =20% Clay = 25%; Sand = 29% Clay = 18%; Sand =35% 0 12 24 36 48 60 72 Clay = 21%; Sand = 27% Clay = 14%; Sand = 34%
9
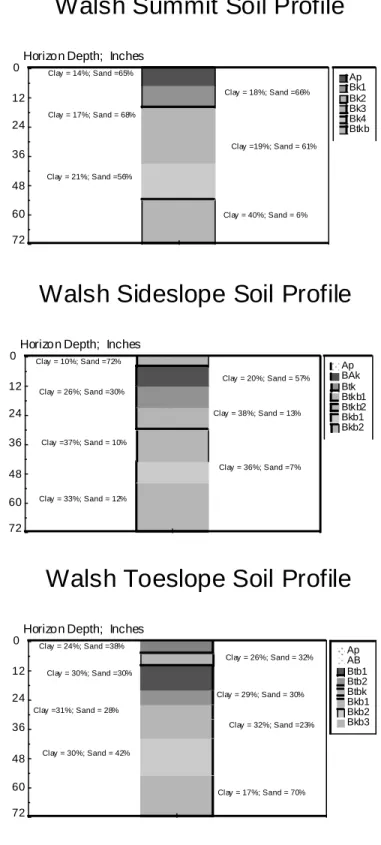
Figure 2c. Soil profile textural characteristics for soils at the Walsh site.
Walsh Summit Soil Profile
Horizon Depth; InchesAp Bk1 Bk2 Bk3 Bk4 Btkb Clay = 14%; Sand =65% Clay = 18%; Sand =66% Clay = 17%; Sand = 68% Clay = 21%; Sand =56% 0 12 24 36 48 60 72 Clay =19%; Sand = 61% Clay = 40%; Sand = 6%
Walsh Sideslope Soil Profile
Horizon Depth; InchesAp BAk Btk Btkb1 Btkb2 Bkb1 Bkb2 Clay = 10%; Sand =72% Clay = 26%; Sand =30% Clay = 38%; Sand = 13% Clay = 36%; Sand =7% 0 12 24 36 48 60 72 Clay =37%; Sand = 10% Clay = 33%; Sand = 12% Clay = 20%; Sand = 57%
Walsh Toeslope Soil Profile
Horizon Depth; InchesAp AB Btb1 Btb2 Btbk Bkb1 Bkb2 Bkb3 Clay = 24%; Sand =38% Clay = 30%; Sand =30% Clay = 29%; Sand = 30% Clay = 32%; Sand =23% 0 12 24 36 48 60 72 Clay =31%; Sand = 28% Clay = 30%; Sand = 42% Clay = 26%; Sand = 32% Clay = 17%; Sand = 70%