Implementing inventory
control in practice – AQ
Electric Suzhou
Introduction
Managing inventory has been critical to the operations of many companies, especially in the current climate of global markets. Companies are often located at extensive distances from their customers and suppliers which means that the cost in both time, money and customer satisfaction can become an issue when materials, components and/or products are not available.
Inventory control is an application of the field of mathematics to the area of logistics and has been applied by many companies to manage their inventory in order to reliably match their supply to the demand of their customers. Although the theory of inventory control is available through various articles, books and courses the practice of inventory control is not as developed, documented and available. This article details the theory and practice of inventory control as it was applied during its implementation at AQ Electric Suzhou located in Suzhou, China.
Methodology
The impact of TAKT agreements on the
inventory system
Most of the products at AQ Electric Suzhou are assembled according to a so called TAKT agreement. TAKT agreements can briefly be described by the following points
The customer agrees to only place orders at certain time slots, where one unit of a product can be ordered, with a fixed number of days in between them as decided by the takt. A takt of 5 would thus allow one slot per work week and a takt of 1 would allow 5
slots per work week. Customers do not have to place an order at a slot, but seldom chose not to.
The takt can be changed at the customers wish. There is however a four work week implementation period immediately after this decision during which the old takt still holds. There is a minimum of one workweek between takt change decisions. The takt must be changed in
accordance to a takt flexibility matrix. This prevents the customer from changing from the highest takt to the lowest and vice versa as the takt can only change by a limited amount of steps at a time.
The supplier commits to a certain percentage on time delivery One of the main benefits of this type of contract is that one knows the demand during a period of four weeks from the current date. As such components with a lead time shorter than four weeks do not have to be kept in stock due to uncertain demand in theory. However, due to minimum order quantities exceeding the demand occasionally several units of components will usually be have to kept in inventory. If the component is prone to break a safety stock might be merited for this reason as well.
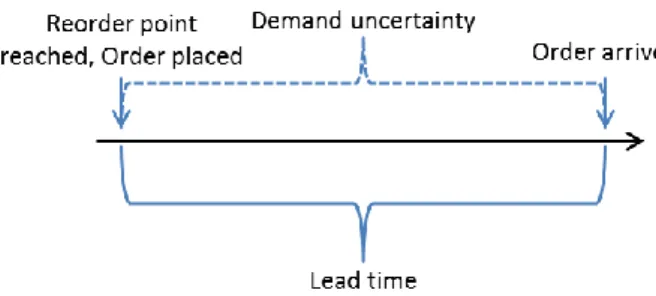
Components with a lead time longer than four weeks also benefit from this type of contract. Since the demand is known four weeks beforehand the inventory position can also be determined four weeks before. This enables one to place an order four weeks earlier than otherwise which means that the period of time during which the inventory has to satisfy demand after having exceeded the reorder point is the difference between lead time and the change over time of four weeks.
Figure 1: Demand uncertainty without takt
Figure 2: Demand uncertainty with takt Thus for calculation purposes one can consider the difference between lead time and change over time as the effective lead time, assuming that the component is only used in products with similar takt changeover times.
Current inventory system
AQ is currently using a system resembling a combination of occasionally using (R,Q)-policy or an (s,S)-policy1 albeit with seemingly arbitrary policies for determining R or S. At least once every day in conjunction with picking from inventory the inventory positions for each component are inspected and noted in the ERP system Monitor. Since inspection occurs frequently after picking the system will be modeled as a continuous review (R, Q)-policy.
Minimizing total cost for inventory or
optimizing service level?
A method for optimizing inventory systems is determining all relevant cost parameters for a set of components and finding the set of inventory parameters that yield the minimum cost. The cost parameters are typically:
1 If at or below inventory position s order up to S.
holding cost per unit and unit of time, backorder cost per unit and unit of time (and/or backorder cost per unit) and order cost.
Holding cost per unit and unit of time is simply the cost for storing and handling the
component as well as the opportunity cost for the tied up capital (although different
interpretations and definitions exist). Holding costs can usually be calculated from
component price, direct costs and by distributing overhead costs according to e.g. activity based costing.
The two backorder cost definitions represent the cost of shortages such as having expensive leased machinery standing still, exempt customer orders and express deliveries. These factors can be hard to quantify and translate to monetary costs (e.g. the cost of an unsatisfied customer).
The order cost is simply the cost of placing an order.
During discussions with AQ Electric Suzhou it was deemed that the process of determining holding and backorder costs would be difficult, inaccurate and inconsistent in comparison to utilizing target service levels, target turn rates and maximum inventory levels as constraints for optimization. All of these figures were available and were tied to strategic goals for both AQ Electric Suzhou and their customers.
Finding suitable measurements for service
levels
The purpose of holding stock is to be able to satisfy demand from customers, both internal and external, reliably. While increasing the amount of stock typically increases the fraction of demand that can be satisfied directly from stock, it also increases costs of holding inventory (holding costs) and increases tied up capital. Thus it is critical to find a suitable balance between low inventory levels and high service levels for each
There are several different measurements for service level and the choice of service level measurement is dependent on what the purpose of the inventory system is. AQ Electric Suzhou had targets of on time delivery. While many processes contribute to whether a delivery is on time such as order processing, assembly, inventory and production capacity planning, during discussion with AQ Electric Suzhou the consensus was that an order was almost always completed on time if the necessary components were in stock in the required amount. Due to this reason on time delivery can be considered to be
approximately dependent on the inventory system solely. Thus it is only natural to find a suitable measurement of service level to equate with on time delivery.
There were two main choices for
measurement of service level: order fill rate and order line fill rate. The order fill rate being the fraction of full orders that can be
completely satisfied directly from stock and the order line fill rate being the fraction of order lines of an order that can be completely satisfied directly from stock. While the order fill rate resembles the targets of on time delivery better the methods that are available for calculating order fill rates are not
applicable to the inventory system in question. This is because AQ Electric Suzhou does not utilize a base stock policy and the number of components that they have would result in complex calculations. This resulted in the order line fill rate being chosen as the measurement for service level instead.
Developing a program
An important part of the implementation was that the method of determining inventory parameters needed be repeatable, structured and simple to use. This was accomplished through the development of a program that mathematically models the metrics that serve as the targets in the operations of AQ Electric Suzhou, such as inventory levels, inventory value, service levels and turn rates, and
optimizes reorder points based on these targets.
Due to the implementation being for a vast amount of different components it needs to be able to be run for sets of components and data that are different from what one currently has access to. Normal procedure may involve performing modelling and calculations for a set of components and data once for a specific set of components and data during a specified period of time. This is comparatively simple since if the modelling and calculations are correct for that set of components and data then that’s all that is necessary. In this application there was also a need to ensure that the program was
adaptable and flexible to the degree that it could perform calculations for components and data that one has not had access to previously. This can be quite deceiving and difficult since calculations may work perfectly for a previous set of components and data but suddenly when there is an update
complications may arise. An example could be a component that yields a ratio between its mean and variance in such a way that calculations become too time consuming. Such problems are difficult to consider since they are reliant on experience to identify and are difficult to predict.
Previous applications of inventory control during our studies were usually on a single component were computational complexity was not an issue. The calculations in this implementation had to be performed on thousands of components which meant that computation complexity became a real and tangible issue. Many adaptations and decisions had to be made in order to reduce computational complexity and reduce the number of iterations that had to be
performed. One solution was that in certain cases we utilized a negative binomial distribution instead which alleviated the computational complexity in those cases but was not as suitable to the original demand distribution as the empirical compound
Poisson distribution. Another solution was the half-interval search. Originally when the program was being developed for a sample of components all searches were exhaustive searches were the reorder point would start at the lower bound and increased by
increments of one up to the upper bound until the target service level was achieved. This became far too time consuming when the interval between the lower bound and the upper bound could consist of thousands of integers and there were thousands of components. An adaptation had to be made on the basis of the target function being either strictly decreasing (turn rate) or increasing (order line fill rate). Another problem that frequently occurred was that the format of the data being exported from Monitor would vary. Either due to different people providing it from a different source(s) and/or in a different format(s) or because the format itself would vary slightly when exporting it (such as variations in indentation, columns and rows). It is a particularly difficult problem since it is difficult developing code that performs calculations and commands automatically when the format differs.
Adaptations had to be made in the program to consider and adapt to these variations in format that could occur. Although such adaptations only prevent that specific issue from occurring again. A related issue that was present through the project was the quality, quantity and availability of data. In certain cases we had data that was conflicting, incomplete and inconsistent while
simultaneously being of different formats. In general the process of implementing inventory control is not as linear in practice as it would seem in theory. The initial approach was to find perfect probability distributions for the demand of each component by using the chi-squared method. This proved futile as there were many components and in certain cases the data would seem to follow a distribution well when plotted but would not be approved by the chi-squared method. Since
the purpose was not to find distributions that would satisfy the chi-squared method but distributions that captured the critical qualities of the demand of the component (such as mean, variance, discrete and/or if it was lumpy) that method was abandoned in favor of a simplified and standardized method based on the empirical compound Poisson distribution.
Program Results
The calculations were performed by the program on the components used in the electrical cabinets provided to Tetra Pak in order to determine the benefits that can be attained from using it. Since AQ Electric Suzhou focuses on service levels and turn rates of 98% and 16 times a year respectively these were the target parameters that were set for optimization.
The components that were chosen for this comparison were those that were used for AQ Electric Suzhou’s highest volume product families, since these components have the most reliable historical data available and the results are therefore more representative.
Table 1: Comparison of historical data with the results of the program
Although it is obvious that there exists a trade-off between service levels and turn rates the purpose was to investigate what the
Target: 16 turns per year Target: 98% on time delivery Historical inventory data Average Inventory Value 457 976 1 056 201 2 185 024 Average Turn Rate 18.18 7.82 - Average Service Level 0,609 0,984 -
Min Service Level 0 0.98 -
impact would be on average inventory
values,service levels and turn rates so that AQ can make an informed decision regarding their targets.
The result was that achieving the target of 16 turns per year for each component results in a significant decrease in service levels which is inconsistent with AQ Electric Suzhou’s target of an on time delivery of 98% for their products since it can’t be higher than the highest service level of an individual component present in the assembly of the product. It’s worth mentioning that the decrease in average inventory is off-set by a decrease in average service level at a rate of 598 225 CNY to 0.375 in this case. Finally, it is clear that the program can result in significant savings while maintaining the target for on time delivery. If the target service level for each component is set to 98% it results in a reduction of the average inventory value by 1 128 823 CNY and the difference remains high even when optimizing for high target service levels. This confirms the suspicion that AQ Electric Suzhou simply has too much of what they don’t need and too little of what they do need. In addition, it would seem that a more suitable approach to increasing the average turn rate would be to negotiate with suppliers in an attempt to reduce the minimum order
quantities for components. In many cases there are large quantities for components with low demand resulting in turn rates that are low. Reducing the minimum order quantities would result in an increase in turn rates without decreasing the service levels, for example.
The results indicate that the goals of 98% on time delivery and 16 turns per year are difficult to achieve simultaneously. The average service level does not provide a suitable approximation for on time delivery since the on time delivery will be bottlenecked by those components with a low service level. Indeed, certain components have a service level of 0 when optimizing for 16 turns per year since the only way to achieve or exceed this target is to have nothing in inventory at all.
In order to achieve greater results one must instead turn to improving other parameters such as lead time, minimum order quantity or takt change time. The service levels for individual components do not necessarily have to be identical either. Low cost components can for example have higher service levels than the high expense components which could lead to higher on time delivery without the total cost increasing significantly. It is however not feasible to achieve 98% on time delivery and an average turn rate of 16 with the above method since the on time delivery is approximately the minimum of the individual components’ service levels as discussed in the Finding suitable measurements for service levels chapter.
The program should prove to be valuable for AQ Electric Suzhou and its role as an analytical tool proved to be valuable during our stay in Suzhou where the program identified multiple lead times and minimum order quantities that AQ Electric Suzhou deemed to be
unacceptable. Table 2: Using a minimum order quantity equal to
1 for all components
All MOQs are set to 1 Target: 98% on time delivery Target: 16 Turns per year Average Inventory Value 914 866 437 822
Average Turn Rate 9.03 18.69
Average Service Level 0,984 0.804
Min Service Level 0.98 0