Technical Bulletin TB-13-01
Ag
ricultural
Experiment Station
College of Agricultural Sciences Department of Soil and Crop CSU Extension
Agronomic & Entomological Results
from 7 Years of Dryland Cropping
Systems Research at Briggsdale,
Colorado
i
F. B. Peairs2, N. C. Hansen3, D. Poss4 , D. G. Westfall3 , G. A. Peterson3, J. C. Herman6, L. Sherrod5, T. M. Shaver6, T. Randolph6, J. Rudolph6
A Cooperative Project of the
Colorado Agricultural Experiment Station Department of Soil and Crop Sciences
Department of Bioagricultural Sciences and Pest Management Colorado State University
Fort Collins, CO and the
USDA – Agriculture Research Service Natural Resources Research Center Great Plains Systems Research Unit
Fort Collins, CO
1
Funding is provided by the Colorado Agricultural Experiment Station and USDA-ARS. 2
Professor, Department of Bioagricultural Sciences and Pest Management, Colorado State University, Fort Collins, CO 80523
3
Professors, Department of Soil and Crop Sciences, Colorado State University, Fort Collins, CO 80523
4
Research Support Scientist – Central Great Plains Research Station at Akron, CO 5
USDA-ARS Technician – Great Plains Systems Research Unit 6
Research Associate, Colorado State University
**Mention of a trademark or proprietary product does not constitute endorsement by the Colorado Agricultural Experiment Station.**
Colorado State University is an equal opportunity/affirmative action institution and complies with all Federal and Colorado State laws, regulations, and executive orders regarding affirmative action requirements in all programs. The Office of Equal Opportunity is located in 101 Student Services. In order to assist Colorado State University in meeting its affirmative action responsibilities, ethnic minorities, women, and other protected class members are encouraged to apply and to so identify themselves.
ii
Table of Contents
Abstract ...1
Introduction ...1
Objectives ...2
Materials & Methods ...2
Results & Discussion–Agronomic Data ...5
Climatic Data ...5
Wheat ...5
Corn...7
Sunflower ...7
Foxtail Millet ...8
Soybeans & Forage Soybeans ...8
Austrian Winter Peas ...8
Grain Sorghum ...8 Triticale ...8 Spring Barley ...8 Weed Counts ...9 Soil Moisture ...10 Conclusion ...11
Results & Discussion - Entomological Data ...12
Wheat ...12 Corn...14 Sunflower ...16 Foxtail Millet ...16 Soybeans ...16 Conclusion ...17 References cited ...18 Appendix ...19
Suction Trap Data ...19
Pheromone Data ...23
iii
List of Tables
Table # Title Page
1 Rotations by year and objective since 1999 at Briggsdale, CO ... 3
2 Seeding rate, nitrogen rate and planting date for all crops at Briggsdale ... 4
3 Soil profile (0-6') NO3-N by crop and year at Briggsdale. ... 4
4 Monthly precipitation received at Briggsdale since 1999... 6
5 Precipitation by growing season segment for Briggsdale from 1998-2005 ... 6
6 Wheat grain yields summarized from 2000 – 2005 ... 7
7 Summary of summer crop yields from 1999 – 2005 ... 7
8 Crop residues by crop, rotation and year at Briggsdale ... 9
9 Percent weed cover Post-Wheat harvest by rotation and year for Briggsdale ... 10
10 Profile (0-6') soil moistures by crop and year at Briggsdale ... 11
11 Wheat insect abundance by variety and growth stage in 1999-2000 ... 12
12 Wheat insect abundance by year, variety and growth stage for Briggsdale ... 13
13 Wheat insect abundance by year, variety and growth stage for Briggsdale ... 14
14 Corn pest and predator insects by year and sampling day for Briggsdale ... 15
15 Sunflower pest and predator insects by day and year for Briggsdale ... 15
16 Foxtail Millet pest and predator insects by day and year for Briggsdale... 16
17 Soybean insect damage at Briggsdale in 1999 ... 17
Appendix Tables
A1 Suction Trap counts from Briggsdale 2001 ... 19A2 Suction Trap counts from Briggsdale 2002 ... 20
A3 Suction Trap counts from Briggsdale 2003 ... 21
A4 Suction Trap counts from Briggsdale 2004 ... 21
A5 Suction Trap counts from Briggsdale 2005 ... 22
A6 Pheromone trap catches for corn and sunflower insects at Briggsdale in 2002... 23
A7 Pheromone trap catches for corn and sunflower insects at Briggsdale in 2003... 23
A8 Pheromone trap catches for corn and sunflower insects at Briggsdale in 2004... 24
A9 Weed control methods including herbicide rate, cost and date applied at Briggsdale in 1999 season ... 25
A10 Weed control methods including herbicide rate, cost and date applied at Briggsdale in 2000 season ... 26
iv
A11 Weed control methods including herbicide rate, cost and date applied at Briggsdale in 2001 season ... 27 A12 Weed control methods including herbicide rate, cost and date applied at Briggsdale in
2002 season ... 28 A13 Weed control methods including herbicide rate, cost and date applied at Briggsdale
in2003 season ... 29 A14 Weed control methods including herbicide rate, cost and date applied at Briggsdale in
2004 season ... 31 A15 Weed control methods including herbicide rate, cost and date applied at Briggsdale in
- 1 -
Abstract
Dryland crop production in the semi-arid Great Plains is limited by both the quantity and timing of precipitation. Sustainable dryland cropping systems maximize precipitation use
efficiency by managing precipitation capture, storage, and use. Pest management approaches are also critical for efficient crop production in water limited environments. Notill based cropping systems improve precipitation use efficiency and allow for more intensive crop rotations with fewer fallow periods. The primary purpose of this long-term study was to determine if the stressful environment in the Briggsdale, CO area would support intensified cropping systems. We knew that some systems might fail but we wanted to “stretch” the system to its limit. The results were revealing and answered many questions that we had asked about intensive cropping systems in this climatic stressful environment.
The objectives of this research were to evaluate productivity and insect dynamics for different notill crop rotations in an environment with less than 15 inches of annual precipitation. Specifically, this research was designed to study integrated pest management tactics to control Russian wheat aphid (RWA) and to evaluate beneficial insect population abundance within more intensive cropping systems. Another objective of the study was to evaluate alternative crops for this environment. The research project was established in 1998, 1999 was the first crop year,
and it was discontinued in 2005. The study compared four notill crop rotations ranging from one summer fallow every other year to continuous cropping with no summer fallow.
During the study period the Briggsdale area had annual precipitation several inches the long-term average of 13.7 inches. This in turn led to many crop failures and low crop grain yields. The dry conditions in the study environment did not sustain insect pest populations large enough to be of economic concern.
Reductions in wheat yields of 11-78% were observed in the most intense rotations as compared to the traditional 2-year system. Consequently, crops such as corn, sunflower, soybean, grain sorghum, Austrian winter pea, and forage soybean, all which were used at least once in the 6-year cropping system, had low yields and were found to be too risky for dryland production in this stressful environment.
These results indicate that the stressful environment coupled with intense cropping systems had a negative impact on the potential production for this location. The most suitable cropping systems found were those with fallow every other year or every third year (2-4 year systems). Well adapted annual forage crops may be a reasonable choice for rotation in winter wheat-based systems.
Introduction
The traditional dryland cropping system in Colorado is a winter wheat-summer fallow rotation. The purpose of the summer fallow period is to conserve limited water for the
subsequent crop. Although summer fallow reduces the risk of crop failure, it is an inefficient use of precipitation. A research project was established in eastern Colorado in 1986 to explore the viability of more intense cropping systems in the semiarid climate of that region (Peterson et.al., 1986-2002). This research concluded that with adoption of notill practices, a crop rotation with fallow every third or fourth year provided a 25-40% increase in net annual income, compared to that of the traditional wheat fallow rotation (Peterson etal., 2002). These findings have resulted in a relatively large adoption of more intensive crop rotations in Eastern Colorado. Commonly, producers are implementing 3-year cropping systems with a winter wheat-summer crop-summer fallow rotation. Summer crops used in this rotation included corn, proso millet, sunflower, or sorghum. The dryland cropping system study (Peterson et al., 2002) also showed that more
- 2 -
intensive crop rotations increased soil carbon content(Sherrod, et al., 2003) and improved soil physical properties (Shaver, et al., 2013). The original study did not, however, evaluate pest and beneficial insect populations.
Pest dynamics are an important consideration in the dryland cropping systems of the Great Plains. The Russian wheat aphid (RWA) can have a major economic impact in wheat based cropping systems. The RWA arrived in Colorado in 1986 and has become a major concern for small grain production throughout Eastern Colorado. In 2002, NASS reported that there were 1.7 million acres of dryland winter wheat in the state, which could potentially be infested by RWA. A potential solution for controlling RWA and other pests may be Integrated Pest Management tactics (Holtzer et.al., 1996). These management tactics include chemical, host plant resistance, cultural and biological control methods. Due to the cost of the chemical control, this option is usually not economically viable. Host plant resistance has shown some promise, however RWA can adapt to these plants if it is the only tactic used. Biological control through the release of predators has shown to be ineffective when predators are without prey for more than 2-3 weeks (Donahue, 1996). In the traditional winter wheat-fallow cropping system beneficial insect survival is minimal. However, if more intense cropping systems were used they may provide more suitable environment for insect presence and survival. The major objective of this study was to evaluate the dynamics of beneficial and pest insects in notill dryland crop rotations.
The specific objectives of this research were to:
1. To determine if intensive notill dryland cropping systems are adapted to this semi-arid environment.
2. Determine the importance of summer fallow and its needed frequency to sustain production.
3. Identify nontraditional crops that can be profitably grown in these dryland systems. 4. Determine the effectiveness of more diverse cropping systems at achieving an integrated
approach to Pest Management.
Materials & Methods- Agronomic Studies
Briggsdale is located in Weld County in north-central Colorado. The field site is three miles south of Briggsdale on county road (CR) 84, between CR 77 and 79, at an elevation of 4850 ft with an average annual precipitation of 13.7 inches. A weather station was installed at the experimental site in 1999. The soil type is a Platner loam (fine, smectitic, mesic Aridic
Paleustolls). Prior to experiment establishment in 1999, the cropping system used at this site was wheat/foxtail millet/fallow (WMF), proceeded by a traditional winter wheat/summer fallow crop rotation. The experimental cropping systems were initiated in 1998, with the first crop harvest in 1999 (Table 1). Each phase of each crop rotation was present every year and was replicated four times in a randomized complete block design.
- 3 -
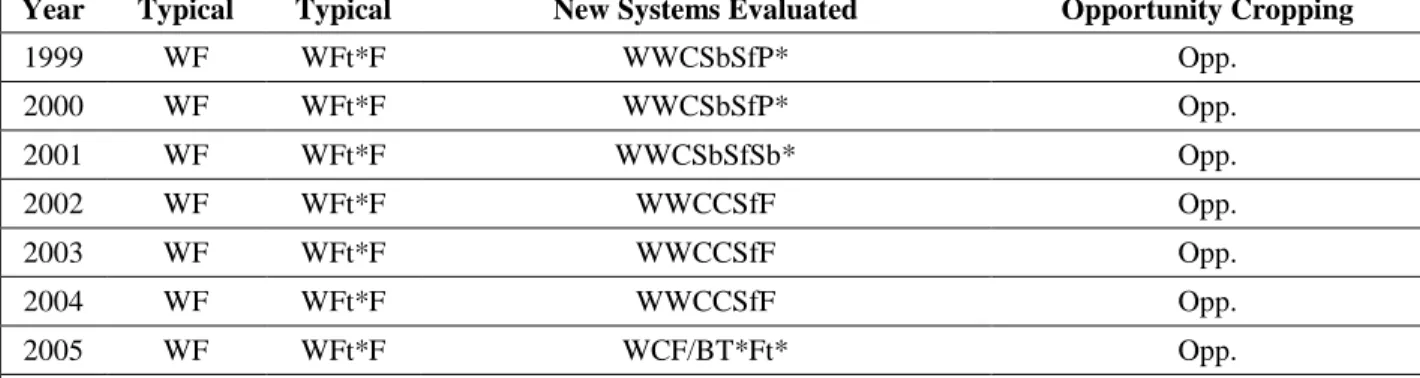
Table 1. Experimental crop rotations by harvest year from 1999 to 2005 at Briggsdale, CO.
Year Typical Typical New Systems Evaluated Opportunity Cropping
1999 WF WFt*F WWCSbSfP* Opp. 2000 WF WFt*F WWCSbSfP* Opp. 2001 WF WFt*F WWCSbSfSb* Opp. 2002 WF WFt*F WWCCSfF Opp. 2003 WF WFt*F WWCCSfF Opp. 2004 WF WFt*F WWCCSfF Opp. 2005 WF WFt*F WCF/BT*Ft* Opp. * Harvested as forage
Key: Wheat (W), Corn (C), Soybean (Sb), Sunflower (Sf), Austrian Winter Peas (P), Barley (B), Triticale (T), Foxtail Millet (Ft), Fallow (F).
The WF and WFtF rotations were used as the control systems which compare
nontraditional systems to common practices for the area; in addition allowing a comparison of two-year vs. three-year traditional practices. From Table 1, the experimental rotations were six-year systems evaluating various potential alternative crops. The opportunity rotation was used to take advantage of environmental conditions that might benefit a given crop in a particular year. The specific crop grown in this system varied and was chosen based on soil moisture conditions. Below normal rainfall conditions throughout the study period reduced opportunity crop choices more than anticipated.
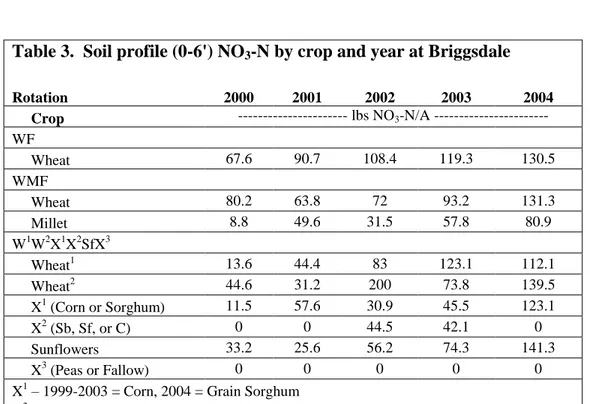
Planting information for each crop including seeding and nitrogen (N) rates over the 7 study years, and the median planting date are reported in Table 2. Nitrogen fertilizer (32-0-0) was applied by dribbling in a band at the soil surface directly above the seed at planting. Soil sampling for residual profile-N was performed prior to planting of each crop by collecting soil cores to six feet (Table 3) and separating into one foot increments; N was applied based on crop requirements. Phosphorus (P) fertilizer (10-34-0) was band applied with the wheat seed at 30 lb P2O5/A on an annual basis. No P was applied to summer crops in any rotation.
Two winter wheat varieties were planted in each rotation. One was resistant to biotype RWA1, while the other was susceptible. Throughout the study period RWA aphid abundance was almost nonexistent and thus it was not possible to measure the benefit of using a resistant variety in these systems. Since little RWA activity was observed and because very few varietal yield differences were noted, wheat yields reported for each cropping system are means of the two varieties.
A suction trap was maintained at the Briggsdale site to monitor aphid flights from May to October, 2001-2005.
Crop residue samples were collected using a 1 meter quadrat (1m x 1m) from two positions in each plot prior to the planting of each crop. These measurements allowed us to monitor crop residue changes in these systems.
- 4 -
Table 2. Average seeding rate, nitrogen fertilizer application rate, and median planting date for all crops grown at Briggsdale from 1998 to 2005.
Crop Seeding Rate N Rate Planting Date
Winter Wheat 58 lbs/acre 49 lbs/acre September 22 Austrian Winter Peas/W.Wheat 90 lbs Peas + 30 lb Wheat/acre 0 lbs/acre October 13 Spring Barley 50 lbs/acre 0 lbs/acre February 24 Sorghum Sudan/Foxtail Millet 14 lbs/acre 30 lbs/acre May 14 Corn 14K seeds/acre 76.9 lbs/acre May 19 Soybean 91K seeds/acre 0 lbs/acre May 21 Forage Soybeans 105 K seeds/acre 0 lbs/acre May 24 Sunflower 14K seeds/acre 40.5 lbs/acre June 1 Grain Sorghum 39K seeds/acre 50.5 lbs/acre June 5 Foxtail Millet 14 lbs/acre 29 lbs/acre June 15
Table 3. Soil profile (0-6') NO3-N by crop and year at Briggsdale
Rotation 2000 2001 2002 2003 2004 Crop --- lbs NO3-N/A --- WF Wheat 67.6 90.7 108.4 119.3 130.5 WMF Wheat 80.2 63.8 72 93.2 131.3 Millet 8.8 49.6 31.5 57.8 80.9 W1W2X1X2SfX3 Wheat1 13.6 44.4 83 123.1 112.1 Wheat2 44.6 31.2 200 73.8 139.5 X1 (Corn or Sorghum) 11.5 57.6 30.9 45.5 123.1 X2 (Sb, Sf, or C) 0 0 44.5 42.1 0 Sunflowers 33.2 25.6 56.2 74.3 141.3 X3 (Peas or Fallow) 0 0 0 0 0 X1 – 1999-2003 = Corn, 2004 = Grain Sorghum
X2 – 1999-2001 = Soybeans, 2002-2003 = Sunflower, 2004 = Corn X3 – 1999-2001 = Peas, 2002-2004 = Fallow
- 5 -
Results & Discussion - Agronomic Studies
Climatic Data
The 1998-1999 cropping season was the only favorable climate year for crop production in the seven-year period of the study (Table 4). Precipitation remained well below normal after the 1998-1999 season. With the exception of the 2000-2001 season, precipitation has only been 25-50% of normal. The normal precipitation pattern is such that the majority of the precipitation is received from April through September. This was true for the study period; however less frequent and more intense events were the primary sources of precipitation instead of the more frequent, less intense events. This type of rainfall pattern had a substantial impact on the moisture/temperature stress of summer crops. When rainfall is received in only a couple of events throughout the summer, desiccation of summer crops is likely to occur because of the course-textured nature of the soil and high temperatures that persist from June through August. The mean maximum air temperatures from 2003-2005 were 78°F in June, 94°F in July and 87°F in August. If the long-term precipitation pattern had occurred, summer crops would have been favored by the “spoon-feeding” of moisture received in more frequent events from June through August. Low moisture and high temperature conditions throughout each summer was the reason for the low crop yields.
The amount of precipitation received during the vegetative and reproductive growth stages for wheat, corn and foxtail millet crops is shown in Table 5. The data indicate that the vegetative growth stage for wheat and corn and the reproductive stage for wheat were the only stages in which moisture conditions favored crop production. Given the environmental
conditions that have persisted at this location in the last seven years, finding crops and cropping systems that are more drought tolerant is critical for economic sustainability at this location.
Wheat
Winter wheat was the most productive crop grown at Briggsdale. It produced a
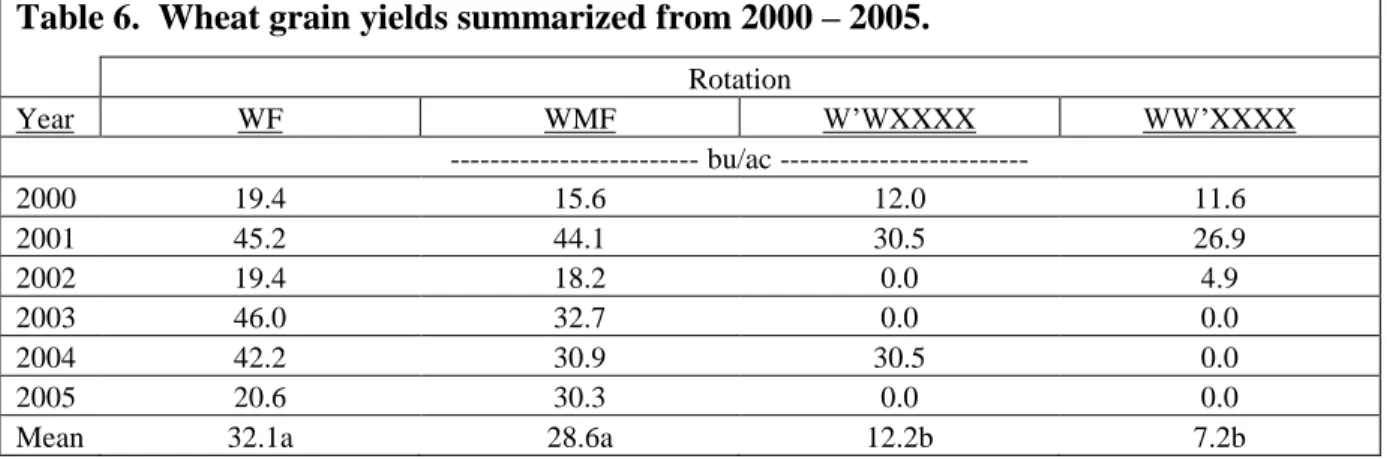
harvestable amount of grain even in years of extreme drought when preceded by a fallow period (Table 6). Wheat yields in the WF system averaged 32 bu/acre, followed by WMF at 29 bu/acre. The first-year wheat crop in the six-year rotation yielded 12 bu/acre and the second-year wheat crop yielded 7 bu/acre; thus the six-year system did not produce sustainable wheat grain yields. These phases of the six-year rotation did not produce any wheat grain in 2001-2002, 2002-2003 and 2004-2005. Precipitation received in 2001-2002 was 5 inches below that of the expected normal, but the precipitation received in the other two non-yielding years was near the normal amount. This illustrates the impact of the exhaustive six-year system and suggests that this environment may not sustain six-year intense cropping systems even under “normal” precipitation conditions.
On the other hand, when comparing the two traditional two and three systems, there were no significant differences. These findings provide some promise that crop productivity can be increased with the use of a more intense system in this environment.
It should be noted that the 1999-2000 wheat crop had significant frost damage from a mid-May snow storm and the 2001-2002 and 2004-2005 wheat crops were severely stressed from drought. The 2001-2002 growing season was one of the driest years on record.
- 6 -
Table 4. Monthly precipitation received at Briggsdale since 1999.
---Inches--- 1999 2000 2001 2002 2003 2004 2005 Normal September 2.63 0.91 1.01 0.21 0.51 1.35 0.32* 1.28 October 0.39 0.19 0.54 0.63 0.06 0.60 2.66* 0.66 November 0.18 0.10 0.00 0.04 0.24 0.54 0.66* 0.45 December 0.00 0.27 0.00 0.00 0.24 0.08 0.08 0.26 2000 2001 2002 2003 2004 2005 2006 January 0.10 0.28 0.07 0.06 0.28 0.14 0.00 0.30 February 0.41 0.07 0.19 0.17 0.36 0.04 0.00 0.19 March 1.00 0.41 0.10 1.75 0.14 0.37 0.36 0.78 April 0.75 1.85 0.06 0.63 0.88 1.23 0.12 1.28 May 2.63 3.85 0.56 2.39 2.24 0.85 0.36 1.94 June 0.33 2.30 1.62 1.83 1.23 3.56 0.16 2.07 July 0.51 2.04 0.39 0.92 0.50 0.44* 2.16** 2.51 August 0.32 0.54 3.65 1.39 0.77 0.86* 0.86** 1.81 Yearly Total 9.25 12.81 8.19 10.02 7.45 10.06 7.82 13.53
*Data provided by the USDA-ARS Area-wide Pest Management of Russian Wheat Aphid and Greenbug Project.
**Data provided by the National Weather Service at Briggsdale, CO
Table 5. Precipitation by growing season segment for Briggsdale from 1998-2005.
Wheat Corn Millet
Veg. Reprod. Veg. Reprod. Veg. Reprod. Year Sept. - Mar Apr. - June Apr. – June July - Sept. June - July August
---Inches--- 98-99 4.60 8.40 8.40 8.61 3.79 4.33 99-00 4.70 3.70 3.70 1.74 0.84 0.32 00-01 2.20 8.00 8.00 3.59 4.34 0.54 01-02 1.90 2.20 2.20 4.25 2.01 3.65 02-03 2.90 4.90 4.90 2.82 2.75 1.39 03-04 2.00 4.40 4.40 2.62 1.73 0.77 04-05 3.10 5.60 5.60 1.62 4.00 0.86 Average 3.06 5.31 5.31 2.77 2.78 1.69 Normal 3.90 5.30 5.30 5.60 4.58 1.81
- 7 -
Table 6. Wheat grain yields summarized from 2000 – 2005.
Rotation Year WF WMF W’WXXXX WW’XXXX --- bu/ac --- 2000 19.4 15.6 12.0 11.6 2001 45.2 44.1 30.5 26.9 2002 19.4 18.2 0.0 4.9 2003 46.0 32.7 0.0 0.0 2004 42.2 30.9 30.5 0.0 2005 20.6 30.3 0.0 0.0
Mean 32.1a 28.6a 12.2b 7.2b
Corn
The 1999 corn crop was exceptional and was the highest yield achieved for corn throughout the experiment (Table 7). This was the only year corn was profitable based on
information published by Kaan et.al. (2002) that indicated 53-55 bu/acre was the breakeven yield for dryland corn. Drought, rodent damage, and high plant populations affected corn yields for the next six years. In 2005, skip-row corn was planted to examine its potential in this arid climate. It looked promising early in the season, but fell short of expectations at harvest time with an average yield of 13.3 bu/acre. The overall site average for corn through seven years was 15.5 bu/acre; when 1999 is excluded, the average yield drops to 7.7 bu/acre. It is evident that dryland corn is not a feasible option for an alternative crop at this location.
Table 7. Summary of summer crop yields from 1999 – 2005.
Crop
Corn Sunflower Hay Millet
Year bu/ac lb/ac lb/ac
1999 62.20 1290 4095 2000 0.00 0 n/a 2001 5.70 559 3500 2002 11.00 456 1500 2003 16.40 490 0 2004 0.00 0 475 2005 13.30 Not available 1000 Mean 15.51 466 1510 Sunflower
Sunflower was grown as an alternative crop in the fifth year of the six-year rotation. Sunflower is a good scavenger of soil water and seemed to be an appropriate fit as one of the crops in the six-year rotation. However, sunflower, like most summer crops, yielded poorly (Table 7). A sunflower crop was only harvested four of the six years they were planted and the average yield was only 466 lbs/acre. With the exclusion of the 1999 crop, the average dropped to 301 lbs/acre. Sunflower was discontinued in 2005, when the six-year rotation was
- 8 -
Foxtail Millet
Foxtail millet forage is one of the traditional options for the second year crop in a three-year system. In the seven three-year study period at this site foxtail millet averaged 1500 lbs/acre, including one year when the crop was not harvested due to drought and another year in which it was not planted due to drought. In 2005 and 2006 foxtail was planted as a mixture with a Sorghum-Sudan hybrid. The theory was that this mixture would reduce the risk of a complete crop failure due to early or late season drought and improved emergence. The larger seeded sorghum would help break surface soil crusting and improved emergence of the smaller seeded millet. The forage sorghum would rely on precipitation received later in the season, whereas the foxtail millet relied more on the early season precipitation. This would give the producer another month of time to receive rain to produce a crop. In June of 2005 over 3.5 inches of precipitation was received, but the month of July had an extended period of over 100F air temperatures and only 0.44 inches of precipitation. The combination of these climatic conditions caused the hay crop to mature early and yield less than a 0.5 ton/a.
Soybean and Forage Soybean
Soybean was planted in the 4th year phase of the six-year rotation in 1999, 2000 and 2001. In 1999, the soybean crop was infested with Kochia, which eventually smothered the crop. From 2000-2001 the soybean crop was damaged by rodents and drought. Soybean never produced a harvestable seed crop and was dropped from the six-year rotation in 2002. Forage soybean was planted in the sixth year phase of the six-year rotation in 2001; it did not produce enough biomass and was not planted in subsequent years.
Austrian Winter Pea
Austrian winter pea was planted as a mixture with winter wheat in the late fall of 1998 and 1999. This forage mixture was the original sixth year phase of the six year rotation. This mixture did not produce enough biomass to be harvested in either year and was dropped as an alternative crop option.
Grain Sorghum
Grain sorghum was planted in the opportunity system in 2002, 2003, 2004, and in the six year rotation in 2006. These crops also failed to produce any grain and were not harvested. This crop was eliminated as an alternative crop option.
Triticale and Spring Barley
In 2005, the six-year system was split into two three-year systems based on its performance through six years. The two new rotations were Spring Barley/Triticale/Forage Sorghum and Foxtail Mixture and WCF. The triticale was not planted in 2005. Spring barley yielded 22 bu/acre, which was more than anticipated. This crop is now included in the new systems at this location and has shown some promise for future productivity.
Crop Residue Accumulation
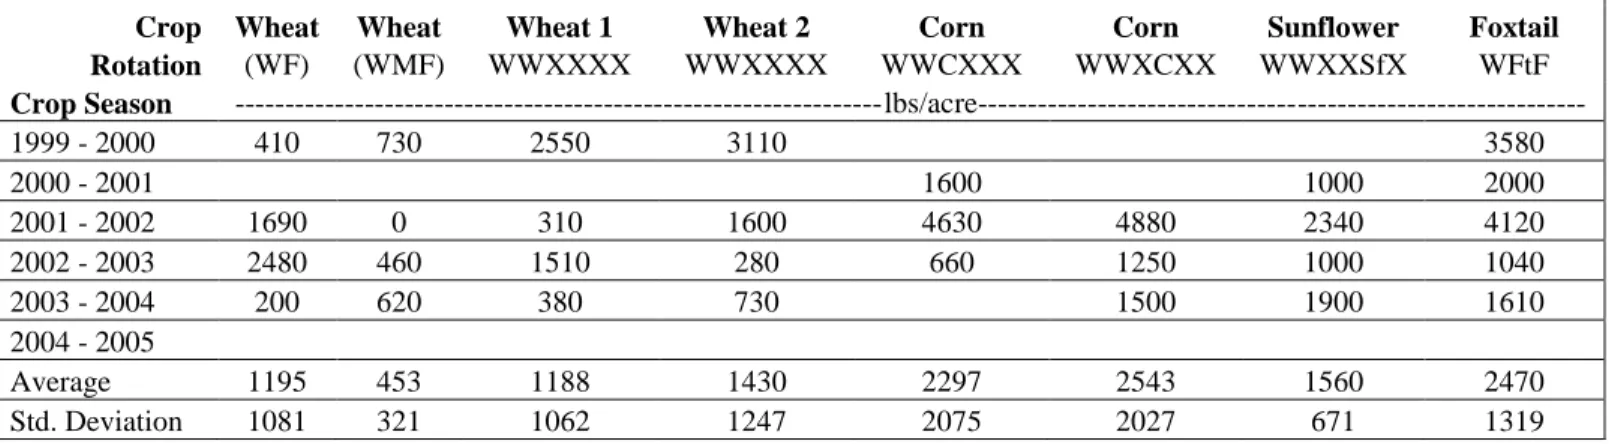
The crop residue weights for all crops, rotations and years are reported in Table 8. The data indicate that crop residue levels were inconsistent, resulting in relatively large standard deviations. Comparison of the crop residue weights taken in 1999 to the average over the course of six years indicates that no rotation permitted an accumulation of crop residue.
- 9 -
Table 8. Crop residue weights by crop, rotation, and year at Briggsdale.
Crop Wheat Wheat Wheat 1 Wheat 2 Corn Corn Sunflower Foxtail Rotation (WF) (WMF) WWXXXX WWXXXX WWCXXX WWXCXX WWXXSfX WFtF
Crop Season ---lbs/acre--- 1999 - 2000 410 730 2550 3110 3580 2000 - 2001 1600 1000 2000 2001 - 2002 1690 0 310 1600 4630 4880 2340 4120 2002 - 2003 2480 460 1510 280 660 1250 1000 1040 2003 - 2004 200 620 380 730 1500 1900 1610 2004 - 2005 Average 1195 453 1188 1430 2297 2543 1560 2470 Std. Deviation 1081 321 1062 1247 2075 2027 671 1319 Weed Counts:
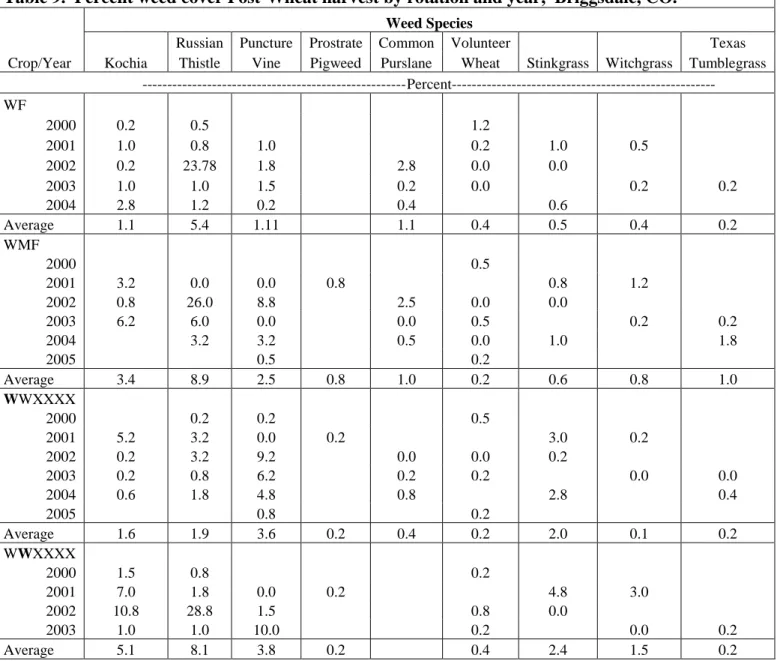
Percent weed cover was determined after the harvest of each crop within each season. This was measured by using a 100 m beaded cable. Beads are spaced at 1 m and weed species present at each bead were noted. Table 9 provides the percent weed cover for each rotation and year after wheat harvest. Due to the inconsistency of stand establishment of the summer crops, percent weed cover for these crops will not be presented. Weed species not listed in the table were not consistent throughout the experiment. Kochia, Russian thistle, and puncture vine were the most prevalent broadleaf species. Among the grass species were volunteer wheat, stinkgrass, witchgrass and Texas tumblegrass. As mentioned previously, 2002 was the driest year on
record, this is evident in the percent weed cover values, as Russian thistle populations reached >20% cover. In dry conditions, Russian thistle is extremely difficult to control, due to its ability to scavenge for moisture and to with stand extremely hot and dry conditions. There were no differences in percentage weed cover among the rotations or any consistent reduction in percent cover of any weed. One year with poor weed control allows for a significant increase in the seed bank for the following year. Timely herbicide applications are critical for weed control in this arid environment.
- 10 -
Soil Moistures
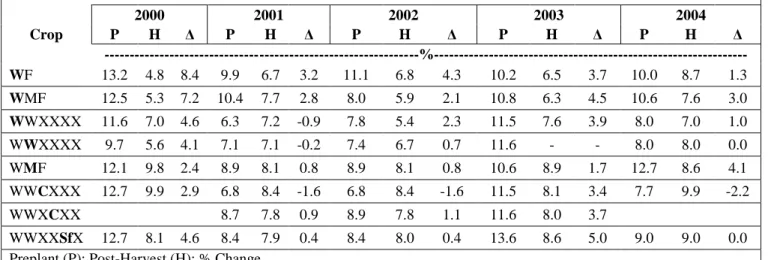
Soil samples were collected at planting and harvest of each crop to determine soil water content in the six foot soil profile. The water contents and change in soil water from planting to harvest are reported from the spring of 2000 through the fall of 2004 in Table 10. There were no discernible soil moisture changes in the 6-year system plots relative to that of 2- or 3-year
systems. The greatest changes in water content from planting to harvest occurred in 2000.
Table 9. Percent weed cover Post-Wheat harvest by rotation and year, Briggsdale, CO.
Weed Species
Russian Puncture Prostrate Common Volunteer Texas Crop/Year Kochia Thistle Vine Pigweed Purslane Wheat Stinkgrass Witchgrass Tumblegrass ---Percent--- WF 2000 0.2 0.5 1.2 2001 1.0 0.8 1.0 0.2 1.0 0.5 2002 0.2 23.78 1.8 2.8 0.0 0.0 2003 1.0 1.0 1.5 0.2 0.0 0.2 0.2 2004 2.8 1.2 0.2 0.4 0.6 Average 1.1 5.4 1.11 1.1 0.4 0.5 0.4 0.2 WMF 2000 0.5 2001 3.2 0.0 0.0 0.8 0.8 1.2 2002 0.8 26.0 8.8 2.5 0.0 0.0 2003 6.2 6.0 0.0 0.0 0.5 0.2 0.2 2004 3.2 3.2 0.5 0.0 1.0 1.8 2005 0.5 0.2 Average 3.4 8.9 2.5 0.8 1.0 0.2 0.6 0.8 1.0 WWXXXX 2000 0.2 0.2 0.5 2001 5.2 3.2 0.0 0.2 3.0 0.2 2002 0.2 3.2 9.2 0.0 0.0 0.2 2003 0.2 0.8 6.2 0.2 0.2 0.0 0.0 2004 0.6 1.8 4.8 0.8 2.8 0.4 2005 0.8 0.2 Average 1.6 1.9 3.6 0.2 0.4 0.2 2.0 0.1 0.2 WWXXXX 2000 1.5 0.8 0.2 2001 7.0 1.8 0.0 0.2 4.8 3.0 2002 10.8 28.8 1.5 0.8 0.0 2003 1.0 1.0 10.0 0.2 0.0 0.2 Average 5.1 8.1 3.8 0.2 0.4 2.4 1.5 0.2
- 11 -
Table 10. Average water content in the 0-6 ft. soil profile by crop and year at Briggsdale. 2000 2001 2002 2003 2004 Crop P H Δ P H Δ P H Δ P H Δ P H Δ ---%--- WF 13.2 4.8 8.4 9.9 6.7 3.2 11.1 6.8 4.3 10.2 6.5 3.7 10.0 8.7 1.3 WMF 12.5 5.3 7.2 10.4 7.7 2.8 8.0 5.9 2.1 10.8 6.3 4.5 10.6 7.6 3.0 WWXXXX 11.6 7.0 4.6 6.3 7.2 -0.9 7.8 5.4 2.3 11.5 7.6 3.9 8.0 7.0 1.0 WWXXXX 9.7 5.6 4.1 7.1 7.1 -0.2 7.4 6.7 0.7 11.6 - - 8.0 8.0 0.0 WMF 12.1 9.8 2.4 8.9 8.1 0.8 8.9 8.1 0.8 10.6 8.9 1.7 12.7 8.6 4.1 WWCXXX 12.7 9.9 2.9 6.8 8.4 -1.6 6.8 8.4 -1.6 11.5 8.1 3.4 7.7 9.9 -2.2 WWXCXX 8.7 7.8 0.9 8.9 7.8 1.1 11.6 8.0 3.7 WWXXSfX 12.7 8.1 4.6 8.4 7.9 0.4 8.4 8.0 0.4 13.6 8.6 5.0 9.0 9.0 0.0 Preplant (P); Post-Harvest (H); % Change
(Δ)
Cropping System Conclusions
Our original goal was to determine what type of intensive cropping system might be sustainable in this stressful environment. As we had hypothesized, we had many crop failures due to our intent to “stretch” the system to its limit. The results were revealing and answered many questions that we had asked about intensive cropping systems in this stressful
environment.
Through seven years of experimentation with alternative crops at Briggsdale, corn, soybean, sunflower, grain sorghum and forage soybean were eliminated as alternative options. The forage crops Foxtail millet and Austrian winter peas may succeed in this environment if proper management techniques are used. Mixing the foxtail with forage sorghum showed promise in recent years and mixing Austrian winter pea with fall seeded triticale has reportedly worked quite well in similar climatic situations. With the use of triticale in the place of winter wheat, an earlier forage harvest can be expected.
Examination of the rotations, based on wheat grain yield, indicates that the six-year system was too exhaustive of soil moisture and was not sustainable. There was no difference in wheat grain yield for the WF and WMF rotations, implying that the primary crop for the rotation (wheat) is not significantly affected by intensifying the rotation for a two- three-year system. However, the short coming is that most summer crops failed to yield consistently. However, with the changes that have been made to the type of summer crops planted, the three-year traditional rotation may be beneficial. Perhaps one of the easiest conclusions made from this research is that it is extremely difficult and risky to grow any crop in a moisture stressed
environment like Briggsdale, CO. The millet tribe is one of the most drought tolerant groups of crops that can be grown in the high plains. Its repeated failure is a strong indicator of the severity of the drought experienced at this location. Although, intensifying cropping systems in this region to provide greater net annualized income has some legitimacy.
- 12 -
Results & Discussion - Entomological Studies
Wheat
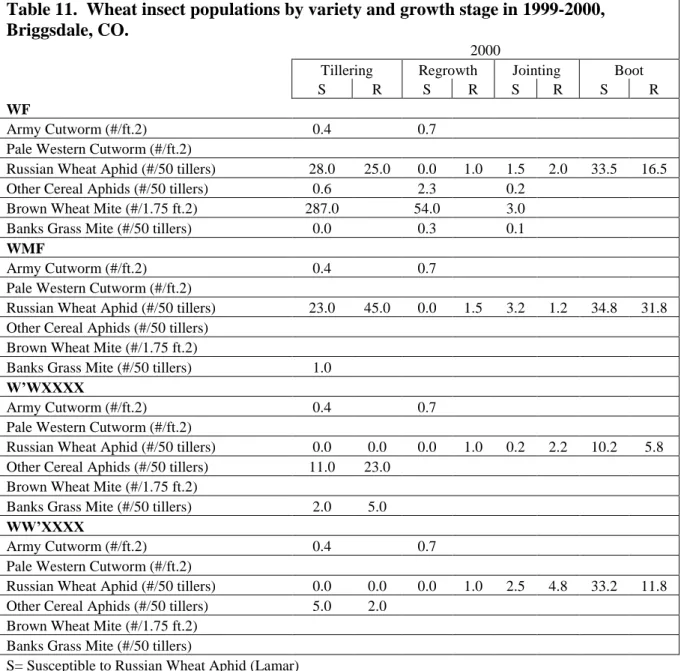
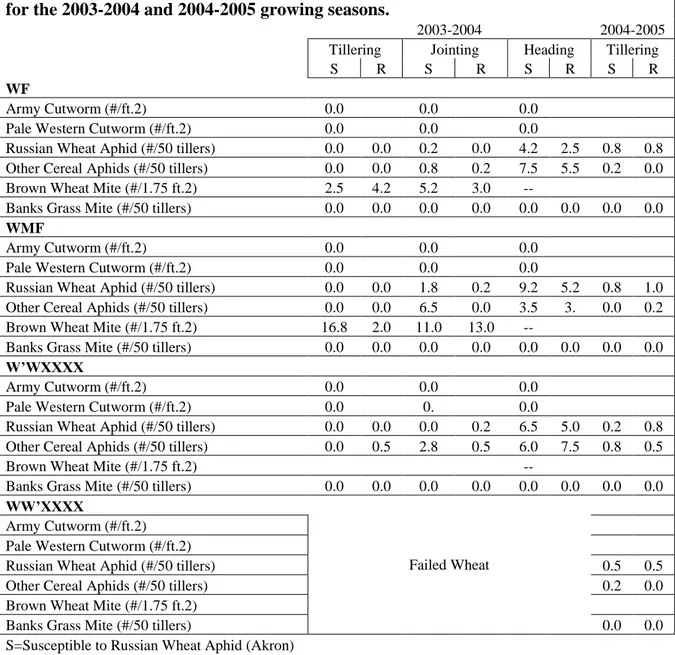
Winter wheat was sampled at various growth stages throughout each year. Fifty random tillers were collected from each plot and phytophagous insect diversity and abundance were determined from these samples using Berlese funnels. Predators were assessed by observations during a 30 second interval. Tables 11-13 provide insect results by variety treatment, growth stage and year, and Tables A1-A5 provide weekly suction trap captures for alates of RWA and other cereal aphids. The number of samples varied each year. This is due to crop failures or very low insect populations at the initial sampling.
In 1999-2000, minimal RWA abundance was observed in the wheat. This is mostly attributed to the late spring frost that occurred on May 13th. Predatory insects comprised a few coccinellids. Again in 2000-2001, few RWA were observed. This was attributed to a snow storm. At no point during the season did RWA or other pest insect reach a level of economic concern. With the exception of brown wheat mites in 2002-2003, wheat pest and predator insects remained scarce; primarily due to late-spring freezes and severe summer drought.
Table 11. Wheat insect populations by variety and growth stage in 1999-2000, Briggsdale, CO.
2000
Tillering Regrowth Jointing Boot
S R S R S R S R
WF
Army Cutworm (#/ft.2) 0.4 0.7 Pale Western Cutworm (#/ft.2) Russian Wheat Aphid (#/50 tillers) 28.0 25.0 0.0 1.0 1.5 2.0 33.5 16.5 Other Cereal Aphids (#/50 tillers) 0.6 2.3 0.2 Brown Wheat Mite (#/1.75 ft.2) 287.0 54.0 3.0 Banks Grass Mite (#/50 tillers) 0.0 0.3 0.1
WMF
Army Cutworm (#/ft.2) 0.4 0.7 Pale Western Cutworm (#/ft.2) Russian Wheat Aphid (#/50 tillers) 23.0 45.0 0.0 1.5 3.2 1.2 34.8 31.8 Other Cereal Aphids (#/50 tillers)
Brown Wheat Mite (#/1.75 ft.2) Banks Grass Mite (#/50 tillers) 1.0
W’WXXXX
Army Cutworm (#/ft.2) 0.4 0.7 Pale Western Cutworm (#/ft.2) Russian Wheat Aphid (#/50 tillers) 0.0 0.0 0.0 1.0 0.2 2.2 10.2 5.8 Other Cereal Aphids (#/50 tillers) 11.0 23.0 Brown Wheat Mite (#/1.75 ft.2) Banks Grass Mite (#/50 tillers) 2.0 5.0
WW’XXXX
Army Cutworm (#/ft.2) 0.4 0.7 Pale Western Cutworm (#/ft.2)
Russian Wheat Aphid (#/50 tillers) 0.0 0.0 0.0 1.0 2.5 4.8 33.2 11.8 Other Cereal Aphids (#/50 tillers) 5.0 2.0
Brown Wheat Mite (#/1.75 ft.2) Banks Grass Mite (#/50 tillers) S= Susceptible to Russian Wheat Aphid (Lamar)
- 13 -
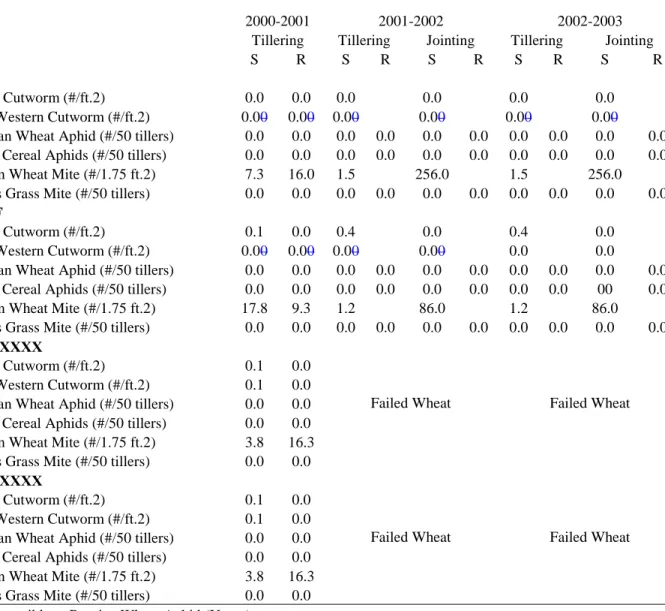
Table 12. Wheat insect abundance by year, variety and growth stage, Briggsdale, CO
for the 2000-2001, 2001-2002, and 2002-2003 growing seasons.
2000-2001 2001-2002 2002-2003
Tillering Tillering Jointing Tillering Jointing
S R S R S R S R S R
WF
Army Cutworm (#/ft.2) 0.0 0.0 0.0 0.0 0.0 0.0 Pale Western Cutworm (#/ft.2) 0.00 0.00 0.00 0.00 0.00 0.00 Russian Wheat Aphid (#/50 tillers) 0.0 0.0 0.0 0.0 0.0 0.0 0.0 0.0 0.0 0.0 Other Cereal Aphids (#/50 tillers) 0.0 0.0 0.0 0.0 0.0 0.0 0.0 0.0 0.0 0.0 Brown Wheat Mite (#/1.75 ft.2) 7.3 16.0 1.5 256.0 1.5 256.0 Banks Grass Mite (#/50 tillers) 0.0 0.0 0.0 0.0 0.0 0.0 0.0 0.0 0.0 0.0
WMF
Army Cutworm (#/ft.2) 0.1 0.0 0.4 0.0 0.4 0.0 Pale Western Cutworm (#/ft.2) 0.00 0.00 0.00 0.00 0.0 0.0 Russian Wheat Aphid (#/50 tillers) 0.0 0.0 0.0 0.0 0.0 0.0 0.0 0.0 0.0 0.0 Other Cereal Aphids (#/50 tillers) 0.0 0.0 0.0 0.0 0.0 0.0 0.0 0.0 00 0.0 Brown Wheat Mite (#/1.75 ft.2) 17.8 9.3 1.2 86.0 1.2 86.0 Banks Grass Mite (#/50 tillers) 0.0 0.0 0.0 0.0 0.0 0.0 0.0 0.0 0.0 0.0
W’WXXXX
Failed Wheat Failed Wheat Army Cutworm (#/ft.2) 0.1 0.0
Pale Western Cutworm (#/ft.2) 0.1 0.0 Russian Wheat Aphid (#/50 tillers) 0.0 0.0 Other Cereal Aphids (#/50 tillers) 0.0 0.0 Brown Wheat Mite (#/1.75 ft.2) 3.8 16.3 Banks Grass Mite (#/50 tillers) 0.0 0.0
WW’XXXX
Failed Wheat Failed Wheat Army Cutworm (#/ft.2) 0.1 0.0
Pale Western Cutworm (#/ft.2) 0.1 0.0 Russian Wheat Aphid (#/50 tillers) 0.0 0.0 Other Cereal Aphids (#/50 tillers) 0.0 0.0 Brown Wheat Mite (#/1.75 ft.2) 3.8 16.3 Banks Grass Mite (#/50 tillers) 0.0 0.0 S=Susceptible to Russian Wheat Aphid (Yuma)
- 14 -
Table 13. Wheat insect abundance by year, variety and growth stage, Briggsdale, CO for the 2003-2004 and 2004-2005 growing seasons.
2003-2004 2004-2005
Tillering Jointing Heading Tillering
S R S R S R S R
WF
Army Cutworm (#/ft.2) 0.0 0.0 0.0 Pale Western Cutworm (#/ft.2) 0.0 0.0 0.0 Russian Wheat Aphid (#/50 tillers) 0.0 0.0 0.2 0.0 4.2 2.5 0.8 0.8 Other Cereal Aphids (#/50 tillers) 0.0 0.0 0.8 0.2 7.5 5.5 0.2 0.0 Brown Wheat Mite (#/1.75 ft.2) 2.5 4.2 5.2 3.0 -- Banks Grass Mite (#/50 tillers) 0.0 0.0 0.0 0.0 0.0 0.0 0.0 0.0
WMF
Army Cutworm (#/ft.2) 0.0 0.0 0.0 Pale Western Cutworm (#/ft.2) 0.0 0.0 0.0 Russian Wheat Aphid (#/50 tillers) 0.0 0.0 1.8 0.2 9.2 5.2 0.8 1.0 Other Cereal Aphids (#/50 tillers) 0.0 0.0 6.5 0.0 3.5 3. 0.0 0.2 Brown Wheat Mite (#/1.75 ft.2) 16.8 2.0 11.0 13.0 -- Banks Grass Mite (#/50 tillers) 0.0 0.0 0.0 0.0 0.0 0.0 0.0 0.0
W’WXXXX
Army Cutworm (#/ft.2) 0.0 0.0 0.0 Pale Western Cutworm (#/ft.2) 0.0 0. 0.0 Russian Wheat Aphid (#/50 tillers) 0.0 0.0 0.0 0.2 6.5 5.0 0.2 0.8 Other Cereal Aphids (#/50 tillers) 0.0 0.5 2.8 0.5 6.0 7.5 0.8 0.5 Brown Wheat Mite (#/1.75 ft.2) -- Banks Grass Mite (#/50 tillers) 0.0 0.0 0.0 0.0 0.0 0.0 0.0 0.0
WW’XXXX
Failed Wheat
Army Cutworm (#/ft.2)
Pale Western Cutworm (#/ft.2)
Russian Wheat Aphid (#/50 tillers) 0.5 0.5 Other Cereal Aphids (#/50 tillers) 0.2 0.0
Brown Wheat Mite (#/1.75 ft.2)
Banks Grass Mite (#/50 tillers) 0.0 0.0 S=Susceptible to Russian Wheat Aphid (Akron)
R=Resistant to Russian Wheat Aphid (Ankor)
Corn
Field corn was scouted for pest and beneficial insects at five different growth stages each year (V-2, V-10, pollen shed, soft dough, and dry down). Table 14 provides the insect
populations found by day and year. Similar to wheat, there were few corn pest or beneficial insects found except for coccinellids in 1999 and Banks grass mites in 2005. This is mostly attributed to drought conditions.
- 15 -
Table 14. Corn pest and predator insects by year and sample date, Briggsdale, CO.
1999 2000 2001 2002 2003 2005
Pests (# per plant)
29-Jul 16-Aug 9-Jan 7-Jan 8-Aug 14-Aug 24-Jun 23-Aug 23-Aug 8-Sep Western corn rootworm 0.6 1.2 0.0 0.0 0.7 0.6 0.1 0.2 4.0 0.0
Banks grass mite 0.0 0.0 0.0 0.0 0. 0.0 0.0 0.0 19.0 173.0 Twp-spotted Spider Mite 0.0 0.0 0.0 0.0 0.0 0.0 0.0. 0.0 0.0 19.0
Corn earworm 0.0 0.1 0.0 0.0 0.0 0.0 0.0 0.1 0.0 0.0 Natural Enemies (total/sampling date)
Coccinellids 10.0 0.0 0.0 1.9 0.1 0.1 0.0 0.0 2.0 0.0 Lacewings 1.0 0.0 0.0 0.0 0.0 0.0 0.0 0.0 1.0 0.0 Mite destroyer 0.0 0.0 0.0 0.3 0.2 0.0 0.0 0.0 0.0 0.0 Pirate bugs 5.0 0.0 0.0 0.0 0.1 0.0 0.0 0.0 3.0 0.0 Predatory mites 0.0 0.0 0.0 0.0 0.0 0.0 0.0 0.0 4.0 0.0 Spider 0.0 0.0 1.0 0.0 0.1 0.0 0.0 0.0 4.0 0.0 Years or insects counts not included when insects were not found or the corn crop had
failed.
Sunflower
Sunflower was sampled at three growth stages throughout the season (2-3 leaf, R5 and R7). Table 15 provides the pest and beneficial insect populations found from 1999-2003. Stem and seed weevil were the only pest insects consistently observed. Neither reached a point of economic concern. The most stem weevils were found in fall of 2003; however lodging was observed. Minute pirate bugs were the most common beneficial insect, and they were most abundant in the initial 1999 sample. Persistent dry conditions contributed to the low insect populations.
Table 15. Sunflower pest and predator insects by day and year, Briggsdale, CO.
1999 2000 2001 2003
Pests (# per plant) 26-Jul 23 Aug.* 27-Jun 13 Sept. 9 Oct. 14 Aug. 15 Oct. 16 Oct. Cutworms 0.0 0.0 3.1 0.0 0.0 0.0 0.0 0.0 Stem Weevil scars 0.1 0.0 0.0 0.0 4.1 0.0 4.2 22.5
Seed weevil 0.7 0.8 0.0 0.0 3.6 0.1 2.5 0.2 Sunflower moth 0.0 0.1 0.0 0.0 1.0 0.0 0.0 0.0 Banded SF moth 0.0 0.0 0.0 0.0 0.0 0.0 0.0 0.0 Aphids 8.2 3.0 0.0 0.0 0.0 0.0 0.0 0.0 Natural Enemies (total/sampling date)
Coccinellids 1.0 0.0 0.0 0.0 0.0 0.0 0.0 0.0 Lacewings 0.0 0.0 0.0 0.0 0.0 0.1 0.0 0.0 Nabid 1.0 2.0 0.0 0.1 0.0 0.0 0.0 0.0 Pirate bugs 30.0 1.0 0.0 0.7 0.0 0.2 0.0 0.0 Mummies 0.00 0.0 0.0 0.0 0.0 0.0 0.0 0.0 Spiders 0.00 0.0 0.0 0.0 0.0 0.0 0.0 0.0 Syrphids 0.00 0.0 0.0 0.0 0.0 0.1 00 0.0 *Date of sampling of larval growth stage
- 16 -
Foxtail Millet
Fifty random tillers were collected from each plot at 2-3 leaf, boot and heading (Table 16). Foxtail millet failed in 2003 and was not planted in 2000. Consistent with wheat, corn and sunflower, only small populations of insects were found in these samples. Thrips were the only consistent pest found. Thrips can be a significant pest for millet and should be closely monitored in the future. Coccinellids, minute pirate bugs and nabids were the only beneficial insects found.
Table 16. Foxtail Millet pest and predator insects by day and year, Briggsdale, CO.
1999 2004 2005
Pests (# per row foot)
26-Jul 23-Aug 12-Jul 27-Jul
6-Sep Boot Heading Greenbug 0 0 4* Other cereal aphids 0 0 6* 1* Thrips (% damage) 2% 36* 9* 29* European corn borer 0 W. Wheat stem maggot 0 Natural Enemies (total/sampling date) Coccinellids 8 3 Lacewings 0 1 Pirate bugs 4 4 Predatory mites 0 0 Mummies 0 0 Nabid 1 0 * #/50 tillers Soybean
Soybean was scouted on three occasions in 1999 (Table 17). Minimal damage by
cutworms, flea beetles, and thrips was observed in the first sample, which declined as the season progressed. Grasshoppers and Mexican bean beetles damaged the crop later in the season. Few predatory insects were found.
Spring Barley, Triticale, Austrian Winter Pea, Grain Sorghum
None of these crops were sampled for insects.
Grasshoppers
Grasshoppers can damage all the crops grown in this area, however, economically significant grasshopper damage was not observed during this seven year period.
- 17 -
Table 17. Soybean insect damage, Briggsdale, CO, 1999.
Date
Pests (% damage)
6-Jul 26-Jul 23 Aug. Cutworms 2% Flea beetle 1% Thrips 5% Grasshoppers 2% 1% Mexican bean beetle 0% 2% Earworm 0
Aphids 0 0 0 Natural Enemies (total/sampling date) Coccinellids 0 0 Lacewings 0 0 Pirate bugs 0 0 Mummies 0 0 Nabid 0 1
Conclusion- Entomological Studies
Seven years of late spring freezes and/or severe summer drought provided an inhospitable environment for insects, and none reached levels of economic concern. Most insects were
collected in the late spring and early summer, when plant vigor was at its highest. As the air temperatures rose and the soil moisture was depleted, insect abundance declined.
With new cropping systems in place and timely summer moisture, larger insect
populations could be favored by the crops now grown. This would provide the opportunity to evaluate and implement appropriate IPM tactics for the cropping systems. Additional insect observations and herbicides used on the various cropping systems are presented in the Appendices.
- 18 -
References Cited
Department of National Agricultural Statistics Service, United States Department of Agriculture. Census of Agriculture-Volume 1 Geographic Area Series Census, US-State. 2002. Online. Available: www.nass.usda.gov/census
Department of Natural Resources Conservation Service, United States Department of Agriculture. Soil Series Classification. Online. Available:
http://soils.usda.gov/technical/classification
Donohue, M.R. 1996. Influence of cropping system on the establishment of natural enemies of the Russian wheat aphid. M.S. Thesis. Colorado State University
Holtzer, T.O., R.L. Anderson, M.P. McMullen, F.B. Peairs. 1996. Integrated pest management of insects, plant pathogens, and weeds in dryland cropping systems of the Great Plains. J. Prod. Ag. 9:2 pp. 200-208.
Kaan, D.A., D.M. O’Brien, P.A. Burgener, G.A. Peterson, D.G. Westfall. 2002 An Economic Evaluation of Alternative Crop Rotations Compared to Wheat-Fallow In Northeastern Colorado. Colorado Agriculture Experiment Station TB 02-1.
Peterson, G.A., D.G. Westfall, F.B. Peairs, L. Sherrod, D. Poss, W. Gangloff, K. Larson, D.L. Thompson, L.R. Ahuja, M.D. Koch, C.B. Walker. 2002. Sustainable Dryland
Agroecosystems Management. Colorado Agriculture Experiment Station Publications Technical Bulletin.
Shaver, T. M., G. A. Peterson, L. R. Ahuja, and D. G. Westfall. 2013. Soil sorptivity
enhancement with crop residue accumulation in semiarid dryland no-till agroecosystems. Geoderma 192:254-258
Sherrod, L. A., G. A. Peterson, D. G. Westfall, and L. R. Ahuja. 2003. Cropping intensity enhances soil organic carbon and nitrogen in a no-till agroecosystems. Soil Sci. Soc. J. 67:1533-1543.
- 19 -
Appendix
Table A1. Suction Trap counts from Briggsdale, CO, 2001.
DATE RWA BCO GB CLA RGA EGA YSA NON --- Number trapped in one week ---
1-May 0 0 1 0 0 0 0 0 17-May 0 0 0 0 0 0 0 2 7-Jun 0 0 13 1 0 0 0 16 14-Jun 0 46 7 2 0 0 0 10 22-Jun 0 24 9 0 0 0 0 10 11-Jul 0 2 0 0 0 0 0 1 18-Jul 0 1 3 0 0 0 0 1 24-Jul 0 1 10 0 0 6 0 4 2-Aug 0 43 36 0 0 1 0 1 7-Aug 0 30 5 0 0 7 0 0 13-Aug 0 29 5 0 0 5 0 4 21-Aug 1 21 24 1 0 6 0 12 27-Aug 0 19 4 0 0 25 0 6 4-Sep 1 12 0 1 0 5 0 5 11-Sep 0 3 0 1 0 2 0 0 18-Sep 0 20 0 1 0 1 0 14 9-Oct 3 186 3 7 0 8 0 67 TOTAL 5 437 120 14 0 66 0 153
Note all suction trap and pheromone data were provided by Terri Randolph. RWA = Russian wheat aphid, BCO = bird cherry-oat aphid, GB = greenbug, CLA = corn leaf aphid, RGA = rose grass aphid, EGA = English grain aphid, YSA = yellow sugarcane aphid, and NON = other, non-cereal aphids.
- 20 -
Table A2. Suction Trap counts from Briggsdale, CO
2002.
DATE RWA BCO GB CLA RGA EGA YSA NON --- Number trapped in one week ---
3-May 0 0 0 0 0 0 0 0 9-May 0 0 0 0 0 0 0 1 16-May 0 0 0 0 0 0 0 0 14-Jun 2 3 1 0 0 2 0 246 20-Jun 0 0 0 0 0 0 0 0 27-Jun 0 0 0 0 0 0 0 0 3-Jul 0 0 0 0 0 0 0 0 11-Jul 0 0 0 0 0 0 0 0 25-Jul 0 0 0 0 0 0 0 0 1-Aug 0 0 0 0 0 0 0 0 7-Aug 0 0 0 0 0 0 0 0 15-Aug 0 0 0 0 0 0 0 0 21-Aug 0 0 0 0 0 0 0 0 29-Aug 0 0 0 0 0 0 0 0 5-Sep 0 6 0 0 0 3 0 8 13-Sep 0 8 1 3 0 1 0 10 19-Sep 0 3 0 7 0 0 0 33 27-Sep 0 11 0 0 0 2 0 50 4-Oct 0 4 0 0 0 0 0 11 11-Oct 0 0 0 0 0 1 0 1 18-Oct 0 2 0 3 0 0 0 26 24-Oct 0 1 0 0 0 2 0 15 TOTAL 2 38 2 13 0 11 0 401
RWA = Russian wheat aphid, BCO = bird cherry-oat aphid, GB = greenbug, CLA = corn leaf aphid, RGA = rose grass aphid, EGA = English grain aphid, YSA = yellow sugarcane aphid, and NON = other, non-cereal aphids.
- 21 -
Table A3. Suction Trap counts from Briggsdale, CO, 2003.
DATE RWA GB BCO CLA EGA RGA NON --- Number trapped in one week ---
30-May 7 10 67 9 3 0 12 6-Jun 1 0 0 0 0 0 1 13-Jun 0 0 0 0 0 0 0 17-Jul 1 3 1 0 5 0 3 25-Jul 0 1 1 1 5 0 6 31-Jul 0 0 8 0 1 0 0 15-Aug 0 0 0 0 0 0 0 18-Aug 1 1 8 1 3 0 4 21-Aug 0 0 1 0 1 0 0 28-Aug 0 0 0 0 3 0 0 5-Sep 1 0 0 0 0 0 4 12-Sep 0 1 1 0 7 0 0 18-Sep 1 0 1 0 1 0 2 30-Sep 1 1 18 6 6 0 92 TOTAL 13 17 106 17 35 0 124
RWA = Russian wheat aphid, BCO = bird cherry-oat aphid, GB = greenbug, CLA = corn leaf aphid, RGA = rose grass aphid, EGA = English grain aphid, YSA = yellow sugarcane aphid, and NON = other, non-cereal aphids.
Table A4. Suction Trap counts from Briggsdale, CO, 2004.
DATE RWA GB BCO CLA EGA RGA NON --- Number trapped in one week ---
3-Jun 25 18 12 1 1 1 19 11-Jun 20 1 9 0 1 2 4 25-Jun 4 2 1 0 0 0 0 7-Jul 376 3 10 0 4 10 23 13-Jul 3 0 3 0 0 0 2 22-Jul 0 0 0 0 0 0 1 6-Aug 0 0 9 0 0 0 1 12-Aug 0 1 13 0 1 0 0 3-Sep 0 0 12 2 5 1 4 8-Sep 0 0 0 0 3 0 4 10-Sep 0 0 0 0 1 0 0 16-Sep 0 0 1 0 0 0 3 23-Sep 0 0 10 0 1 9 12 7-Oct 0 0 9 3 3 3 20 15-Oct 0 0 19 0 0 5 6 22-Oct 3 0 7 0 0 0 2 TOTAL 428 25 105 6 20 31 101
RWA = Russian wheat aphid, BCO = bird cherry-oat aphid, GB = greenbug, CLA = corn leaf aphid, RGA = rose grass aphid, EGA = English grain aphid, YSA = yellow sugarcane aphid, and NON = other, non-cereal aphids.
- 22 -
Table A5. Suction Trap counts from Briggsdale, CO, 2005.
DATE RWA GB BCO CLA EGA RGA NON --- Number trapped in one week ---
30-May 44 0 3 0 0 0 16 6-Jun 14 0 3 1 0 0 6 13-Jun 135 5 2 0 0 0 4 20-Jun 585 2 11 7 2 0 5 27-Jun 41 0 8 1 1 0 5 4-Jul 13 2 3 0 0 0 1 11-Jul 0 0 0 0 0 0 0 18-Jul 0 0 11 0 0 0 0 25-Jul 2 0 1 1 0 0 0 2-Aug 0 0 0 0 0 0 0 27-Sep 0 0 17 0 2 2 11 14-Oct 0 0 2 0 0 1 2 TOTAL 834 9 61 10 5 3 50
Notes: Trap was not functional until the end of May.
Due to time constraints, trap catches were done monthly August-October. Trap was not turned on for the August trap so nothing was collected.
RWA = Russian wheat aphid, BCO = bird cherry-oat aphid, GB = greenbug, CLA = corn leaf aphid, RGA = rose grass aphid, EGA = English grain aphid, YSA = yellow sugarcane aphid, and NON = other, non-cereal aphids.
- 23 -
Table A6. Pheromone trap catches for corn and sunflower insects, Briggsdale, CO, 2002.
European Western Banded
Corn Bean Corn Sunflower Sunflower Date Borer Cutworm Earworm Moth Moth --- # trapped since previous date (about 1 week) ---
23-May 2 30-May 2 6-Jun 0 13-Jun 2 20-Jun 1 27-Jun 1 0 0 0 3-Jul 1 0 0 0 11-Jul 0 2 0 0 18-Jul 0 7 0 0 25-Jul 0 5 0 0 1-Aug 0 0 0 0 7-Aug 0 0 3 0 0 15-Aug 0 0 15 0 0 21-Aug 0 0 2 0 0 29-Aug 0 2 1 0 5-Sep 1 50 1 0 13-Sep 0 106 0 0 20-Sep 11 27-Sep 2 TOTAL 8 14 189 1 0.0
Table A7. Pheromone trap catches for corn and sunflower insects, Briggsdale, CO,2003.
European Western Banded Pale
Corn Bean Corn Sunflower Sunflower Army Western Date Borer Cutworm Earworm Moth Moth Cutworm Cutworm --- # trapped since previous date (about 1 week) ---
7-Jun 0 0 -- 0 0 -- -- 2-Jul 0 1 -- 0 0 -- -- 17-Jul 0 4 7 1 2 -- -- 25-Jul 0 0 11 3 1 -- -- 31-Jul 0 0 21 1 0 -- -- 8-Aug 0 3 37 5 2 0 3 15-Aug 1 1 28 2 2 2 2 21-Aug 1 0 2 1 0 3 1 28-Aug 0 0 -- 1 1 4 3 5-Sep 0 0 27 3 1 7 16 12-Sep 2 -- 3 0 1 13 39 18-Sep 0 -- 0 0 3 8 43 30-Sep -- -- -- -- -- 34 70 9-Oct -- -- -- -- -- 35 45 17-Oct -- -- -- -- -- 9 4 TOTAL 4 8 136 14 12 114 224
- 24 -
Table A8. Pheromone trap catches for corn and sunflower insects, Briggsdale, CO,2004.
E.C. Corm Sfl. B.S. Army P.W. F.A. Date Borer Earworm Moth Moth Cutworm Cutworm Cutworm --- # trapped since previous date (about 1 week) ---
21-Jun 0 6-Jan 0 2-Jul 0 8-Jul 2 0 22-Jul 0 9 30-Jul 36 0 9-Aug 42 0 0 12-Aug 17 0 1 1 0 1 6 25-Aug 2 7 0 2 4 10-Sep 1 28 0 16-Sep 0 2 0 TOTAL 96 9 3 8 30 3 10
- 25 -
Table A9. Weed control, Briggsdale, CO, 1999.
Crop Herbicide/Tillage Rate (English) Rate (Metric) Weed Pressure Cost Date Applied
Rotation: Wheat-Fallow Wheat: Ally 2,4-D 4# Fallowmaster* Fallowmaster* Atrazine 4L 0.1 oz/A 8 oz/A 32 oz/A 32 oz/A 19 oz/A(0.67#) 7.0 g/ha 0.58 l/ha 2.33 l/ha 2.33 l/ha 1.39 l/ha(302g) II II I I III $2.27 $0.89 $4.40 $4.40 $3.57 4 May 1999 4 May 1999 5 July 1999 17 Aug. 1999 17 Aug. 1999
Fallow: Tillage - 18" sweeps Tillage - Disc
Fallowmaster* 32 oz/A 2.33 l/ha
I I I $3.57 27 May 1999 6 July 1999 17 Aug. 1999 Rotation: Wheat-Millet-Fallow Wheat: Ally 2,4-D 4# Fallowmaster* Fallowmaster* Atrazine 4L 0.1 oz/A 8 oz/A 32 oz/A 32 oz/A 19 oz/A(0.67#) 7.0 g/ha 0.58 l/ha 2.33 l/ha 2.33 l/ha 1.39 l/ha(302g) II II I I III $2.27 $0.89 $4.40 $4.40 $3.57 4 May 1999 4 May 1999 5 July 1999 17 Aug. 1999 17 Aug. 1999
Millet: Round-up Ultra*
2,4-D 4# Round-up Ultra* 16 oz/A 8 oz/A 16 oz/A 1.17 l/ha 0.58 l/ha 1.17 l/ha I I I $4.88 $0.89 $4.88 14 May 1999 14 May 1999 27 June 1999
Fallow: Tillage - 18" sweeps Tillage - Disc
Fallowmaster* 32 oz/A 2.33 l/ha
I I I $3.57 27 May 1999 6 July 1999 17 Aug. 1999 Rotation: Wheat-Wheat-Corn-Soybeans-Sunflowers-Peas: Wheat: Ally 2,4-D 4# Fallowmaster* Fallowmaster* Maverick 0.1 oz/A 8 oz/A 32 oz/A 32 oz/A 0.66 oz/A 7.0 g/ha 0.58 l/ha 2.33 l/ha 2.33 l/ha 46.3 g/ha II II I I I $2.27 $0.89 $4.40 $4.40 ? 4 May 1999 4 May 1999 5 July 1999 17 Aug. 1999 2 Nov. 1999 Wheat: Ally 2,4-D 4# Fallowmaster* Fallowmaster* Atrazine 4L 0.1 oz/A 8 oz/A 32 oz/A 32 oz/A 19 oz/A(0.67#) 7.0 g/ha 0.58 l/ha 2.33 l/ha 2.33 l/ha 1.39 l/ha(302g) II II I I II $2.27 $0.89 $4.40 $4.40 $3.57 4 May 1999 4 May 1999 5 July 1999 17 Aug. 1999 17 Aug. 1999 Corn: Prowl Atrazine 4L Fallowmaster* 32 oz/A 32 oz/A(1#) 32 oz/A 2.33 l/ha 2.33 l/ha(454g) 2.33 l/ha I I I $6.56 $3.57 $4.40 14 May 1999 14 May 1999 14 May 1999 Soybeans: Landmaster BW* Round-up Ultra* Round-up Ultra* 40 oz/A 24oz/A 20 oz/A 2.92 l/ha 1.75 l/ha 1.46 l/ha I I I $5.88 $7.31 $6.09 14 May 1999 27 June 1999 17 Aug. 1999 Sunflowers: Prowl Landmaster* 48 oz/A 40 oz/A 3.50 l/ha 2.92 l/ha I I $9.84 $5.88 14 May 1999 14 May 1999
Peas(Millet) Round-up Ultra* 2,4-D 4# Round-up Ultra* 16 oz/A 8 oz/A 16 oz/A 1.17 l/ha 0.58 l/ha 1.17 l/ha I I I $4.88 $0.89 $4.88 14 May 1999 14 May 1999 27 June 1999 Rotation: Opportunity
Millet: Round-up Ultra*
2,4-D 4# Round-up Ultra* 16 oz/A 8 oz/A 16 oz/A 1.17 l/ha 0.58 l/ha 1.17 l/ha I I I $4.88 $0.89 $4.88 14 May 1999 14 May 1999 27 June 1999
*Applied 17 lbs. Ammonium Sulfate/100 gallons water with Round-up products.
Weed Pressure Ratings: I =Farmer would need to spray. II = Farmer would delay application. III =Farmer would not plan a spray application.
- 26 -
Table A10. Weed control, Briggsdale, CO, 2000.
Crop Herbicide/Tillage Rate (English) Rate (Metric) Weed Pressure Cost Date Applied
Rotation: Wheat-Fallow Wheat: Ally 2,4-D ester 4# 0.1 oz/A 8 oz/A 7.0 g/ha 0.58 l/ha II II $2.30/A $0.82/A 4 May 2000 4 May 2000 Fallow: Fallowmaster* Fallowmaster* 44 oz/A 44 oz/A 3.2 l/ha 3.2 l/ha I I $6.49/A $6.49/A 13 May 2000 21 June 2000 Rotation: Wheat-Millet-Fallow Wheat: Ally 2,4-D ester 4# 0.1 oz/A 8 oz/A 7.0 g/ha 0.58 l/ha II II $2.30/A $0.82/A 4 May 2000 4 May 2000 Millet: Fallowmaster* Round-up Ultra* 44 oz/A 24 oz/A 3.21 l/ha 1.75 l/ha I I $6.49/A $7.23/A 13 May 2000 21 June 2000 Fallow: Fallowmaster* Fallowmaster* 44 oz/A 44 oz/A 3.21 l/ha 3.21 l/ha I I $6.49/A $6.49/A 13 May 2000 21 June 2000 Rotation: Wheat-Wheat-Corn-Soybean-Sunflower-Pea: Wheat: Ally 2,4-D ester 4# Fallomaster* 2,4D ester 0.1 oz/A 8 oz/A 32 oz/A 8 oz/A 7.0 g/ha 0.58 l/ha 2.33 l/ha 0.58 l/ha II II I I $2.30/A $0.82/A $4.72/A $0.82/A 4 May 2000 4 May 2000 2 Aug. 2000 2 Aug. 2000 Wheat: Ally 2,4-D ester 4# 0.1 oz/A 8 oz/A 7.0 g/ha 0.58 l/ha II II $2.30/A $0.82/A 4 May 2000 4 May 2000 Corn: Prowl Atrazine 4L Fallowmaster* 32 oz/A 32 oz/A(1#) 44 oz/A 2.33 l/ha 2.33 l/ha(454g) 3.21 l/ha I I I $5.11/A $2.80/A $6.49/A 13 May 2000 13 May 2000 13 May 2000
Soybeans: Round-up Ultra* Round-up Ultra* 32 oz/A 24oz/A 2.33 l/ha 1.75 l/ha I I $9.64/A $7.23/A 13 May 2000 22 June 2000 Sunflowers: Landmaster* Prowl 40 oz/A 48 oz/A 2.92 l/ha 3.50 l/ha I I $5.54/A $7.66/A 13 May 2000 13 May 2000 Peas Fallowmaster* 2,4-D ester 4# 44 oz/A 8 oz/A 3.21 l/ha 0.58 l/ha I I $6.49/A $0.82/A 21 June 2000 21 June 2000 Rotation: Opportunity Soybeans: Round-up Ultra*
Round-up Ultra* 32 oz/A 24oz/A 2.33 l/ha 1.75 l/ha I I $9.64/A $7.23/A 13 May 2000 22 June 2000
*Applied 17 lbs. Ammonium Sulfate/100 gallons water with Round-up products.
Weed Pressure Ratings: I =Farmer would need to spray. II = Farmer would delay application. III =Farmer would not plan a spray application.
- 27 -
Table A11. Weed control, Briggsdale, CO, 2001.
Crop Herbicide/Tillage Rate (English) Rate (Metric) Cost Date Applied
Rotation: Wheat-Fallow Wheat: (Stubble) Ally 2,4-D ester 4# FallowMaster* Round-up* 0.1 oz/A 8 oz/A 44 oz/A 24 oz/A 7.0 g/ha 0.58 l/ha 3.2 l/ha 1.75 l/ha $2.30/A $0.82/A $6.49/A $7.23/A 14 April 2001 14 April 2001 27 July 2001 4 October 2001 Fallow: (Wheat Planting) Round-up* Clarity FallowMaster* FallowMaster* Round-up 20 oz/A 6 oz/A 44 oz/A 44 oz/A 20 oz/A 1.46 l/ha 0.44 l/ha 3.2 l/ha 3.2 l/ha 1.46 l/ha $6.02/A $4.21/A $6.49/A $6.49/A $6.02/A 9 May 2001 9 May 2001 13 June 2001 27 July 2001 7 September 2001 Rotation: Wheat-Millet-Fallow Wheat: (Stubble) Ally 2,4-D ester 4# FallowMaster* Round-up* 0.1 oz/A 8 oz/A 44 oz/A 24 oz/A 7.0 g/ha 0.58 l/ha 3.2 l/ha 1.75 l/ha $2.30/A $0.82/A $6.49/A $7.23/A 14 April 2001 14 April 2001 27July 2001 4 October 2001 Millet: Round-up * Clarity Round-up* 20 oz/A 6 oz/A 24 oz/A 1.46 l/ha 0.44 l/ha 1.75 l/ha $6.02/A $4.21/A $7.23/A 9 May 2001 9 May 2001 13 June 2001 Fallow: (Wheat Planting) Round-up* Clarity FallowMaster* FallowMaster* Round-up* 20 oz/A 6 oz/A 44 oz/A 44 oz/A 20 oz/A 1.46 l/ha 0.44 l/ha 3.2 l/ha 3.2 l/ha 1.46 l/ha $6.02/A $4.21/A $6.49/A $6.49/A $6.02/A 9 May 2001 9 May 2001 13 June 2001 27 July 2001 7 September 2001 Rotation: Wheat-Wheat-Corn-Soybean-Sunflower-Pea: Wheat: (Stubble) Ally 2,4-D ester 4# FallowMaster* Round-up* 0.1 oz/A 8 oz/A 44 oz/A 24 oz/A 7.0 g/ha 0.58 l/ha 3.2 l/ha 1.75 l/ha $2.30/A $0.82/A $6.49/A $7.23/A 14 April 2001 14 April 2001 27July 2001 4 October 2001 Wheat: (Stubble) (Wheat Planting) Ally 2,4-D ester 4# FallowMaster* Round-up* 0.1 oz/A 8 oz/A 44 oz/A 24 oz/A 7.0 g/ha 0.58 l/ha 3.2 l/ha 1.75 l/ha $2.30/A $0.82/A $6.49/A $7.23/A 14 April 2001 14 April 2001 27July 2001 4 October 2001 Corn: Fallowmaster* Prowl 3.3 EC Atrazine 4L 32 oz/A 32 oz/A 32 oz/A 2.33l/ha 2.33l/ha 2.33l/ha $5.31/A $5.11/A $2.80/A 7 May 2001 7 May 2001 7 May 2001 Soybeans: Round-up* 2,4-D Ester 4 Authority Round-up* 16 oz/A 8 oz/A 2.67 oz/A 24 oz/A 1.17 l/ha 0.58 l/ha 187 g/ha 1.75 l/ha $4.82/A $0.58/A $9.91/A $7.23/A 24 April 2001 24 April 2001 9 May 2001 13 June 2001 Sunflowers: Round-up* 2,4-D Ester 4 Spartan 16 oz/A 8 oz/A 2.67 oz/A 1.17 l/ha 0.58 l/ha 187 g/ha $4.82/A $0.58/A $9.91/A 24 April 2001 24 April 2001 9 May 2001
Forage Soybeans: Round-up* 2,4-D Ester 4 Authority 16 oz/A 8 oz/A 2.67 oz/A 1.17 l/ha 0.58 l/ha 187 g/ha $4.82/A $0.58/A $9.91/A 24 April 2001 24 April 2001 9 May 2001 Rotation: Opportunity Wheat: (Stubble) Ally 2,4-D ester 4# FallowMaster* Round-up* 0.1 oz/A 8 oz/A 44 oz/A 24 oz/A 7.0 g/ha 0.58 l/ha 3.2 l/ha 1.75 l/ha $2.30/A $0.82/A $6.49/A $7.23/A 14 April 2001 14 April 2001 8 July 2001 4 October 2001
- 28 -
Table A12. Weed control, Briggsdale, CO, 2002.
Crop Herbicide/Tillage Rate (English) Rate (Metric) Cost Date Applied Rotation: Wheat-Fallow
Wheat:(Stubble) RT Master* 16 oz/ac 1.17 l/ha $2.99 20 Sept. 2002
Fallow: (Wheat Planting) RT Master* Round-up Ultra* 2,4-D Lo Vol RT Master* 32 oz/ac 16 oz/ac 8 oz/ac 16 oz/ac 2.33 l/ha 1.17 l/ha 0.58 l/ha 1.17 l/ha $5.98 $4.06 $1.17 $2.99 15 June 2002 10 July 2002 10 July 2002 20 Sept. 2002 Rotation: Wheat-Millet-Fallow
Wheat:(Stubble) RT Master* 16 oz/ac 1.17 l/ha $2.99 20 Sept. 2002
Millet: RT Master* 32 oz/ac 2.33 l/ha $5.98 15 June 2002
Fallow: (Wheat Planting) RT Master* Round-up Ultra* 2,4-D Lo Vol RT Master* 32 oz/ac 16 oz/ac 8 oz/ac 16 oz/ac 2.33 l/ha 1.17 l/ha 0.58 l/ha 1.17 l/ha $5.98 $4.06 $1.17 $2.99 15 June 2002 10 July 2002 10 July 2002 20 Sept. 2002 Rotation: Wheat-Wheat-Corn-Corn-Sunflower-Fallow: Wheat: (Wheat Planting) Round-up Ultra* 2,4-D Lo Vol RT Master* 16 oz/ac 8 oz/ac 16 oz/ac 1.17 l/ha 0.58 l/ha 1.17 l/ha $4.06 $1.17 $2.99 10 July 2002 10 July 2002 20 Sept. 2002
Wheat:(Stubble) RT Master* 16 oz/ac 1.17 l/ha $2.99 20 Sept. 2002
Corn1: Prowl Atrazine 4L RT Master* 32 oz/ac 32 oz/ac 32 oz/ac 2.33 l/ha 2.33 l/ha 2.33 l/ha $5.16 $2.54 $5.98 6 June 2002 6 June 2002 15 June 2002 Corn2: RT Master* Round-up UltraMAX* 32 oz/ac 20 oz/ac 2.33 l/ha 1.46 l/ha $5.98 $7.56 15 June 2002 5 July 2002 Sunflowers: Spartan RT Master* 2.0 oz/Ac 32 oz/ac 140 g/ha 2.33 l/ha $5.67 $5.98 23 May 2002 15 June 2002 Fallow: (Wheat planting) RT Master* Round-up Ultra* 2,4-D Lo Vol RT Master* 32 oz/ac 16 oz/ac 8 oz/ac 16 oz/ac 2.33 l/ha 1.17 l/ha 0.58 l/ha 1.17 l/ha $5.98 $4.06 $1.17 $2.99 15 June 2002 10 July 2002 10 July 2002 20 Sept. 2002 Rotation: Opportunity Grain Sorghum: RT Master*
Marksman 32 oz/ac 32 oz/Ac 2.33 l/ha 2.33 l/ha $5.98 $7.13 5 July 2002 4 June 2002 *Applied 1 qt/100 gal. of Choice ($0.25/ac) to all Round-up products and 2 qt/100 gal. of Activator 90 ($0.54/ac) with RT Master.
- 29 -
Table A13. Weed control methods including herbicide rate, cost and date applied at Briggsdale in 2003 season.
Crop Herbicide/Tillage Rate (English) Rate (Metric) Cost Date Applied Rotation: Wheat-Fallow Wheat: (Stubble) Ally XP 2,4-D LV6 Clarity RT Master 2,4-D LV6 RT Master 2,4-D LV6 Atrazine 4L RT Master 0.10 oz/A 5.3 oz/A 2.0 oz/A 20 oz/A 10 oz/A 24 oz/A 10 oz/A 24 oz/A 20 oz/A 7.02 g/ha 0.39 l/ha 0.15 l/ha 1.46 l/ha 0.73 l/ha 1.75 l/ha 0.73 l/ha 1.75 l/ha 1.46 l/ha $2.33/A $0.82/A $1.46/A $3.40/A $1.54/A $4.08/A $1.54/A $1.86/A $3.40/A 21 April 21 April 21 April 17 July 17 July 13 August 13 August 22 September 22 September Fallow: (Wheat Planting) RT Master RT Master RT Master 2,4-D LV6 RT Master 2,4-D LV6 RT Master 24 oz/A 32 oz/A 24 oz/A 10 oz/A 24 oz/A 10 oz/A 20 oz/A 1.75 l/ha 2.33 l/ha 1.75 l/ha 0.73 l/ha 1.75 l/ha 0.73 l/ha 1.46 l/ha $4.08/A $5.44/A $4.08/A $1.54/A $4.08/A $1.54/A $3.40/A 29 April 14 May 17 June 17 June 13 August 13 August 22 September Rotation: Wheat-Millet-Fallow Wheat: (Stubble) Ally XP 2,4-D LV6 Clarity RT Master 2,4-D LV6 RT Master 2,4-D LV6 Atrazine 4L RT Master 0.10 oz/A 5.3 oz/A 2.0 oz/A 20 oz/A 10 oz/A 24 oz/A 10 oz/A 24 oz/A 20 oz/A 7.02 g/ha 0.39 l/ha 0.15 l/ha 1.46 l/ha 0.73 l/ha 1.75 l/ha 0.73 l/ha 1.75 l/ha 1.46 l/ha $2.33/A $0.82/A $1.46/A $3.40/A $1.54/A $4.08/A $1.54/A $1.86/A $3.40/A 21 April 21 April 21 April 17 July 17 July 13 August 13 August 22 September 22 September Millet: (to kill) RT Master RT Master
Round-up Ultra MAX RT Master 2,4-D LV6 24 oz/A 32 oz/A 26 oz/A 24 oz/A 10 oz/A 1.75 l/a 2.33 l/ha 1.90 l/ha 1.75 l/ha 0.73 l/ha $4.08/A $5.44/A $10.76/A $4.08/A $1.54/A 29 April 14 May 17 June 13 August 13 August Fallow: (Wheat Planting) RT Master RT Master RT Master 2,4-D LV6 RT Master 2,4-D LV6 RT Master 24 oz/A 32 oz/A 24 oz/A 10 oz/A 24 oz/A 10 oz/A 20 oz/A 1.75 l/ha 2.33 l/ha 1.75 l/ha 0.73 l/ha 1.75 l/ha 0.73 l/ha 1.46 l/ha $4.08/A $5.44/A $4.08/A $1.54/A $4.08/A $1.54/A $3.40/A 29 April 14 May 17 June 17 June 13 August 13 August 22 September Rotation:Wheat-Wheat-Corn-Corn-Sunflower-Fallow:
- 30 - Wheat: (Wheat Planting) Harmony Extra 2,4-D LV6 RT Master 2,4-D LV6 RT Master 0.40 oz/A 5.3 oz/A 24 oz/A 10 oz/A 20 oz/A 28.1 g/ha 0.39 l/ha 1.75 l/ha 0.73 l/ha 1.46 l/ha $5.67/A $0.82/A $4.08/A $1.54/A $3.40/A 14 May 14 May 13 August 13 August 22 September Wheat: (Stubble) Harmony Extra 2,4-D LV6 RT Master 2,4-D LV6 Atrazine 4L RT Master 0.40 oz/A 5.3 oz/A 24 oz/A 10 oz/A 24 oz/A 20 oz/A 28.1 g/ha 0.39 l/ha 1.75 l/ha 0.73 l/ha 1.75 l/ha 1.46 l/ha $5.67/A $0.82/A $4.08/A $1.54/A $1.86/A $3.40/A 14 May 14 May 13 August 13 August 22 September 22 September Corn1: RT Master RT Master Prowl Atrazine 4L 24 oz/A 32 oz/A 32 oz/A 32 oz/A 1.75 l/ha 2.33 l/ha 2.33 l/ha 2.33 l/ha $4.08/A $5.44/A $5.54/A $2.46/A 29 April 14 May 28 May 28 May Corn2: RT Master RT Master
Round-up Ultra MAX
24 oz/A 32 oz/A 26 oz/A 1.75 l/ha 2.33 l/ha 1.90 l/ha $4.08/A $5.44/A $10.76/A 29 April 14 May 17 June Sunflowers: RT Master RT Master Spartan 24 oz/A 32 oz/A 2.0 oz/A 1.75 l/ha 2.33 l/ha 140 g/ha $4.08/A $5.44/A $5.67/A 29 April 14 May 22 May Fallow: (Wheat planting) RT Master RT Master RT Master 2,4-D LV6 RT Master 2,4-D LV6 RT Master 24 oz/A 32 oz/A 24 oz/A 10 oz/A 24 oz/A 10 oz/A 20 oz/A 1.75 l/ha 2.33 l/ha 1.75 l/ha 0.73 l/ha 1.75 l/ha 0.73 l/ha 1.46 l/ha $4.08/A $5.44/A $4.08/A $1.54/A $4.08/A $1.54/A $3.40/A 29 April 14 May 17 June 17 June 13 August 13 August 22 September Rotation: Opportunity Millet: (to kill) RT Master RT Master
Round-up Ultra MAX RT Master 2,4-D LV6 24 oz/A 32 oz/A 26 oz/A 24 oz/A 10 oz/A 1.75 l/a 2.33 l/ha 1.90 l/ha 1.75 l/ha 0.73 l/ha $4.08/A $5.44/A $10.76/A $4.08/A $1.54/A 29 April 14 May 17 June 13 August 13 August *Applied 1 qt/100 gal. of Choice ($0.25/ac) to all Round-up products and 2 qt/100 gal. of Activator 90 ($0.54/ac) with RT Master.