J
Ö N K Ö P I N GI
N T E R N A T I O N A LB
U S I N E S SS
C H O O LJÖNKÖPI NG UNIVER SITY
D o e s S w e d i s h R & D pa y o f f ?
Master thesis within Economics Author: Malin Karlsson
Tutor: Professor Ulf Jakobsson Ph. D Candidate James Dzani Jönköping June 2008
Master thesis within Economics
Title: Changes in market positions – and the role of technology Authors: Malin Karlsson
Tutors: Ulf Jakobsson, Professor James Dzani, Ph. D Candidate Date: June 2008
Keywords: Relative International competitiveness, R&D, Comparative advantages, technology gap, factor proportions
Abstract
According to the Globalizations Council the most important task Sweden has is to assess the opportunities and challenges presented by the global economy to a small, open country like Sweden. There has been dual competition, some has been able to sell the resource ser-vices of human and physical knowledge capital, and others offering to sell unskilled labor at wages way below Swedish standards. This thesis will examine the changes in market posi-tion in the manufacturing sector, and how comparative advantage and the role of technol-ogy have impacted the changes.
The empirical analysis is based on the relative international competitiveness index to exam-ine how market position in different sectors has changed during the time-period 1985-2003. In the regression measures for human and physical capital has been included as well as R&D expenditure for both Sweden and the OECD countries.
The results show that the changes in market position for most products are relatively small. What can be concluded is that it is not the sector as a whole that experience improving market positions instead it is certain products such as pharmaceutical, sulphate and elec-tronic components among others.
Sweden ranks very high in terms of resources dedicated to production of new technology and there are proofs on both side of the "Swedish Paradox"; which states that high tech-nology exports are low given the high R&D investment.
The result also indicates that Sweden has a labor-intensive disadvantage, i.e. indications that the market position for industries with high total capital-intensity has increased.
Table of Contents
1
Introduction... 1
1.1 Previous Research ...2
1.2 Purpose ...3
1.3 Limitations of data set...3
1.4 Outline of the paper ...3
2
Theoretical Framework... 4
2.1 Factor Proportions and Comparative Advantage...4
2.2 The role of technology and R&D ...4
3
Empirical Studies... 6
3.1 Relative International Competitiveness ...6
3.1.1 Change in RIC in Swedish industry, 1985-2003 ...7
3.2 Evidence on Swedish Export Performance in Technology-intensive Industries...8
4
Model Formulation... 11
4.1 Adjustment to changes in comparative advantage ...11
4.2 Definition and measurement of the variables ...12
5
An assessment of the Regression Results ... 13
6
Conclusion & Further Research ... 16
References ... 17
Appendix 1 ... 19
1 Introduction
During the last couple of years, the Swedish debate on economic policy and national com-petitiveness has mostly focused on the impact of globalization of the manufacturing sector. As growth in manufacturing jobs have been transferred to low-cost locations rather than to Sweden, policy-makers have been trying to formulate a vision for how Sweden should en-hance its international competitiveness. According to the Globalizations Council, the most important task will be to assess the opportunities and challenges presented by the global economy to a small, open country like Sweden. The main issue will be to prospect Sweden as a future knowledge society and production base, business sector renewal and develop-ment capacity (Governdevelop-ment office of Sweden).
This is also exactly how the Swedish economy has been viewed; as an economy that is characterized by a high degree of research and development activity. This is often inter-preted as proof of the Swedish economy being knowledge-intensive and well-prepared for an international trend where low-skilled manufacturing jobs are to be replaced by knowl-edge-intensive activities. In 2005 Swedish R&D expenditure totaled 3,89% of GDP com-pared to EU-15 that only put 1,86% of their GDP into R&D. (SCB, 2008) A better tech-nology means a strong competitive position on domestic and world markets. R&D as a percentage of value added or sale is viewed as an input measure of technology. Relatively larger R&D efforts may then be expected to result in a “technology gap” that would give the innovating firm at least a temporary advantage in producing and exporting its products. However it has been argued that the return on Swedish investments in research has been relatively low. This phenomenon – high technology exports are low given the high R&D investment is known as the Swedish paradox (Braunerhjelm 1998). But Erjemo & Kander (2006) have showed that the theoretical foundations of the paradox are rather weak.
A problem in Sweden has been its interaction with the international market place; Sweden is a country with abundant forest resources but is also abundant in capital and can thereby produce capital intensive manufacture. This means that there has been competition on both sides, some has been able to sell the resource service of human and physical knowl-edge capital, and others offering to sell unskilled labor at wages way below Swedish stan-dards. (Leamer & Lundberg, 1995) So how has Sweden responded to this? Which sectors in the manufacturing industry have improved alternative deteriorated their market posi-tions, and what do these shifts indicate?
1.1 Previous Research
Lundberg (1988) investigated the large shifts in relative international competitiveness and comparative advantage in the industrial sectors developed market economies during the years 1969-84. He found that the market position of Swedish producers has improved in capital-intensive industries; this is true for industries intensive in human as well as physical capital. The sectors that improved their market position were among others wood furni-ture, cars, construction machinery and manufacturing of paper. This may indicate that the pattern of comparative advantage in the Swedish economy may have shifted during the pe-riod towards capital-intensive products, and away from sectors intensive in the use of un-skilled labor. Lundberg (1988) found that the sectors that experienced a deteriorating mar-ket position were among others clothing, computer and office machinery and rubber, tires and tubes. Lars results confirmed the so called “technology gap” hypothesis which implies that a high level of R&D expenditure in Sweden, relative to competitors, improved the Swedish market position. He also concluded that Sweden increased its R&D intensity from three percent in 1969 to six percent in 1981 and that the only country that showed a higher figure is the US. But two decades later Erjemo & Kander (2006), Schneider (2007), and Hatzichronoglou (2006) all points out that Sweden is in top three among the countries that invest the most money into R&D relatively seen to GDP in the world and that the US po-sition has deteriorated.
However Lundberg (1988) did not find any indications of increasing international speciali-zation for Swedish producers in R&D-intensive goods, which can be interpreted as a proof of the Swedish paradox. Braunerhjelm (1998) stated a formulation of the Swedish paradox built on the theory of comparative advantage, a country that invests heavily in R&D should also export high-technology products. But Braunerhjelm found that this is not the case for Sweden, since the Swedish technology balance of payment had a higher surplus (in relative terms) than any other OECD-country, suggesting that Swedish technology might be capi-talized elsewhere. Braunerhjelm (1998) also reports a high concentration, about 75-80 per-cent in 1994, of Swedish R&D to multinationals. Interesting to note is that the growth of R&D expenditures of affiliates under foreign control in Sweden has grown with 223 per-cent between 1995-2003 (OECD, AFA database, May 2007). Erjemo & Kander (2006) talks about that we can not really see R&D as the sole driving force for growth in any sec-tor and by that you cannot really say that the “Swedish paradox” exist. They argue that rela-tively low export shared for high-technology manufactures depends on the Swedish com-parative advantage in natural-resource intensive export. This advantage comes from the fact that Sweden is abundant with iron and forest and has over time built up specialist competence in the refinements of these goods. Can. D Le (1987) found that the same thing applies for Canada which is also abundant in natural-resources.
Freeman (2004) takes another stand and shows how competitiveness cannot be explained by wage/price/currency rates and how that technological leadership gives absolute rather than comparative advantages.
Leamer & Lundberg (1995) found significant evidence for their H-O hypothesis; that some countries has managed through international commerce to sell services at very competitive prices that Sweden has comparative advantage in, namely human & physical knowledge capital. But even though Sweden according to Leamer & Lundberg (1995) is losing its dis-tinctiveness in capital-abundance, Sweden still remains well supplied with soft-forest prod-ucts. A problem with this could be that a country that is abundant in forest resources and also very abundant in capital can produce capital intensive manufactures in addition to pulp and paper, but a country with less capital could find most of its capital deployed in pulp
and paper and end up with a mix of goods that includes relatively large amount of labor-intensive products. This means that the forest industry could “starve” other manufacturing of human and physical capital, forcing Sweden into relatively labor intensive activities.
1.2 Purpose
This thesis is intended to explain the changes in the industry pattern of relative interna-tional competitiveness and internainterna-tional specialization in the Swedish manufacturing indus-try during the period 1985-2003, in terms of various indusindus-try characteristics assumed to re-veal comparative advantage. In particular, we focus on the role of technology and technical improvement through research and development in this development.
1.3 Limitations of data set
A major limitation of the data is that from the year 1985 up until 2003 the Swedish statisti-cal bureau (SCB) has changed their SNI classification system two times, and the two sys-tems are not really comparable to each other. In 1985 SCB used the classification system SNI69 which is much more aggregated then SNI2002 which is used in 2003. To be able to carry out the study a conversion had to be made of the manufacturing sector from SNI69 and SNI2002, I used Linda Andersson (2001) conversion as a template and then modified it to fit into my study. What to keep in mind is that for some products group it was neces-sary to calculate with an average since it is impossible to compare on product group to an-other in the different classifications systems. Then to be able to get hold of wages, value added and number of employees’ data for the ratios and indices the data was classified in a different system called KN, which had to be converted into SNI so it could fit into the rest of the data.
There is also a difference in the classification system for the R&D data. The R&D is re-trieved from OECD and is on a more aggregated level than the other data, this means that average numbers had to been used to be able to run any regressions.
How much information that has been lost in translation is hard to say and all results should be interpreted with caution.
1.4 Outline of the paper
The second section of this paper will expand the readers’ understanding about the underly-ing theories for the purpose of this thesis.
In the third section the empirical studies will be presented. The relative international com-petitive index and Sweden’s relationship to R&D will be discussed and presented.
In the fourth section the model formulation will be presented which will lead to the equa-tion used to test the research quesequa-tion in the regression. Also, all variables included in the analysis will be introduced.
The fifth section presents the results obtained from the regression and also the variables implications of the regression will be interpreted and discussed. The regression result will be analyzed and examined in order to determine if the purpose have been fulfilled.
In the sixth and final section a conclusion will be drawn whether the pattern of Swedish in-ternational specialization has shifted during the years 1985-2003, as consequences of shifts in comparative advantages. Suggestions for further research will also be included.
2 Theoretical Framework
This section includes determinants that may shift the pattern of international competitiveness, the section also outlines different theories that could help us to explain Sweden’s export pattern of specialization.
2.1 Factor Proportions and Comparative Advantage
The label neo-classical trade theory refers to theories in which the trade flows between na-tions are based on comparative advantage, as a result from technological differences or from factor abundance.
In the factor abundance model, developed by Eli Heckscher, Bertil Ohlin and Paul Samuelson, comparative advantage is determined by cross-country differences in the rela-tive abundance of factor endowments. It also uses some additional assumptions, such as perfect competition, homogeneous goods, production with constant return to scale, no transport cost associated with the trade of goods, and mobility of factors of production be-tween industries, but not bebe-tween countries.(Brakman et.al, 2006). Since the factor abun-dance theory of trade is one of the most influential ideas in international economics, it has been subject of heavy empirical testing. The theory states that the country that has abun-dance in capital will be an exporter of capital-intensive goods and an importer of labor-intensive goods. For example, according to the Hecksher-Ohlin model Sweden as a capital-intensive country should also export capital-capital-intensive goods, such as cars and pharmaceuti-cal. But according to Leontief paradox this is not the case. In 1954, Leontief found that the U.S the most capital-abundant country in the world exported labor-intensive goods and imported capital-intensive goods (Krugman 2006).
Given the factor endowments of the trading country relative to the world, the relative fac-tor requirements in a particular industry will predict trade flows and international competi-tiveness. This implies that when factor endowments change in the trading countries, the pattern of trade also changes. A possible effect of the appearance of newly industrialized countries in the world trade would be a change in the comparative advantage of the Swed-ish economy. Relative to the rest of the world, Sweden would then appear as still better en-dowed with capital, especially human capital, and unskilled labor would be even more lim-ited. So what kind of effect would this have on the pattern of trade? Picture a 2x2 model of a small open economy, where factor prices equal those of the rest of the world. If we now let the capital stock grow, at a constant labor force, while conditions in the rest of the world remains unchanged and if we let the commodity prices remain constant, factor prices and technology will not change. Consequent to the Rybcznski effect we would expect capi-tal-intensive industries on average to expand, whereas labor-intensive sectors would de-cline. (Lundberg, 1988)
2.2 The role of technology and R&D
Factor proportion theories often assume technology to be given, in contrast to another group of theories, the neo-technology or technology gap theories of trade. They tend to
underline the importance of changes over time and differences in technological knowledge among countries for the explanation of international trade. (Lundberg, 1988)
According to Freeman (2004) technological leadership gives absolute rather than compara-tive advantage and technological leadership will reflect institutions supporting grouping, creating, clustering, comprehending and coping in connection with technology.
Superior technology means a strong competitive position on domestic and world markets. R&D expenditure results in innovation in the form of new products or production proc-esses which improve the competitiveness of innovating firms. R&D expenditures, in per-cent of sales or value added, are frequently used to measure not only technology intensity or the stock of technical knowledge in an industry, but also the flow of new technology. R&D expenditure can be viewed as an input flow measure of technology but there is also an output flow measure, like the number of new patents (Castellacci, 2002).
According to Lundberg (1988) the R&D variable is likely to have a dual role in the explana-tion of trade flows. It may be interpreted in terms of neo-factor theories, but it may also be interpreted in terms of the “neo-technology” or technology gap theories. According to neo-factor theories has a country where resources for producing R&D, such as scientific employees, are abundant and thereby cheap, have a comparative advantage in R&D-intensive production. And in terms of technology gap theories trade flows in any particular product group will be influenced by the actual amount of R&D expenditure in each coun-try. This means that larger R&D efforts may result in a “technology gap” that would give the innovating firm at least a temporary advantage in producing and exporting its product. Depending on the rate of flow of new technology this situation may be more or less per-manent.
An approach that combines the neo-factor and neo-technology approaches to R&D, as in Hughes (1986), can be formulated as
), (
2
1fw fs fw
r=
α
+β
+β
− (1)Where r is the market position and fs and fw are the actual R&D intensities in Swedish
industry and the OECD average. We expect that the higher the actual R&D expenditures in Swedish industry relative to its competitors, the stronger the Swedish market position will be (
β
2 f0).The level of R&D expenditure in an industry in a country is expected to influence the rate of technological progress, and by that also the growth rates of productivity and unit factor costs in that country. If this is correct, a high level of R&D in a certain industry in a coun-try, relative to its competitors, implies a high rate of decline in relative unit factor costs and thus rapid improvement in international competitiveness for producers in that country. By this reasoning the difference between domestic and foreign R&D will influence the change in r rather than absolute r.
In a regression analysis across industries, R&D intensity (i.e share of R&D expenditure of value added) should be used rather than absolute terms to adjust for differences in industry size (Deardorff, 1984). But as Lundberg (1988) points out by using the difference in R&D intensities as a marker of change in international competitiveness it neglects economies of scale in R&D. If scale of economies is large enough, R&D-induced productivity growth could be higher, and by that the competitive position is improved in a large producing country relative to a small one, even if R&D intensity is lower in the large country.
3 Empirical Studies
Here will the definition of the relative international competitiveness index be presented and how it has changed during the time-period 1985-2003. Furthermore the evidence on Swedish export performance in technology-intensive industries will be presented.
3.1 Relative International Competitiveness
There are several ways of measuring international competitiveness; one of the most used ones is the theory of “revealed comparative advantage”. This index was defined by Balassa (1965) as relative export performance, in other words, the share of world export in product i relative to the share of world exports in all goods. However as Lundberg (1988) points out this neglect the import side.
By using the relative international competitiveness index (RIC), ri, it has been taken into ac-count that an increase in rit could for example be the effect of increased import protection or subsidies and does not indicate an improved competitiveness in the usual sense. This means that we can interpret ri as an index of the market position on domestic and foreign markets.
To be able to take into account the import side we define an index of international com-petitiveness in sector i as
Ri=Qi/Ci=(Ci+Xi-Mi)/Ci=1+(Xi-Mi)/Ci (2) where Ci is domestic consumption, Qi is domestic production, Mi imports and Xi export of the products of industry i. If the country is a net exporter in product group i, then Ri>1; the higher Ri, the greater net exports are relative to domestic consumption, and the stronger the international competitiveness in sector i and the degree of international spe-cialization on the i’th product. Which also implies that if we have R<1 there is a deficit on the trade balance in manufactures.
We will then define relative international competitiveness as
ri=Ri/R (3)
where R=ΣQjΣCj shows the balance of trade in all manufactures. This means that we have an index ri for international competitiveness in industry i, adjusted for the overall surplus or deficit in manufactured products.
3.1.1 Change in RIC in Swedish industry, 1985-2003 -0,6 -0,4 -0,2 0 0,2 0,4 0,6 0,8 1 1,2 1,4 1,6 1,8 2 0 50 100 150 200
Food, drinks & Tobacco
Wearing apparel, textile & shoes
Forrest Products
Engineering
Chemicals & Minerals
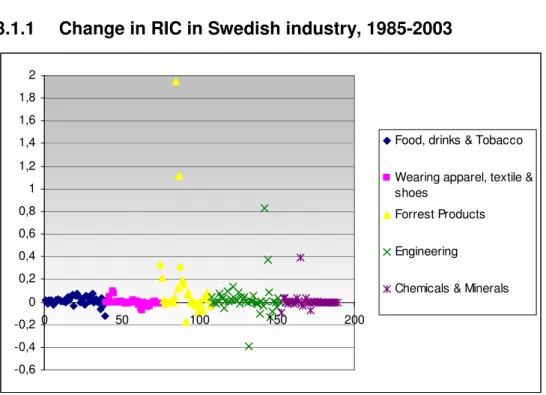
Figure 1 Changes in relative international competitiveness by industry, 1985-2003
When presenting the results, the manufacturing industry has been divided into five differ-ent subsectors. Each subsector then contains differdiffer-entiated industries within that sector. For example, the food sector is a part of the manufacturing industry, but within the food sector we have different product groups like the sugar or coffee industry.
Figure 1 shows the change in market position or relative international competitiveness, measured by the change in ri as defined in equation 2, during the period 1985-2003, by 5 digit industry, arranged by SNI code number. At the first glance we can see that there has been a relative small change in the market position for most of the products. The sectors that stands out is the forest products and engineering, where we actually both have had im-proved and deteriorating market positions. Both the food and textile sector has had a fairly constant change in RIC during the years 1985-2003.
In the forest product sector the sulphate-industry (where pulp is processed) has experi-enced an amazing improved market position and is now also the fifth largest producer in the world. This also indisputably leads to an increase in the magazine and journal paper-industry market positions. The Swedish forest paper-industry reports that 12% of Sweden’s total exports came from the forest industry and investments in the sector amounts to 20% of to-tal output. This large amount is due to the fact that the forest industry is very capito-tal- capital-intense. Sweden is thus an important player in the global supply of forestry products; the world’s third largest exporter of paper and sawed wood products and the world’s fourth largest exporter of wood pulp. (Skogsindustrierna, 2006)
In the engineering sector it is the industry for electronic components together with the in-dustry for radio and TV –receivers which has improved. According to the Swedish institute (2006) engineering is the base of Swedish manufacturing sector. In total value added, the engineering sector accounted for 52%, this sector is very important since it drives other business through subcontractors. Of Sweden’s engineering sector production, about 65% is exported and one of the characteristic features of the Swedish engineering industry is just its very high degree of internationalization and exposure to international competition. One
effect of the competition has been that Swedish companies have chosen to locate simpler production abroad, a reason for this is that most sales occurs abroad, but also that Swedish wages and salary levels makes it increasingly difficult to manufacture in Sweden while re-maining competitive. (Swedish institute, 2006)
In chemicals & minerals it does not come as a surprise that the pharmaceutical industry shows an improved market position. The Swedish pharmaceutical industry has grown rap-idly during the last two decades, and has become one of Sweden’s most important growth industries. According to the Swedish Institute (2007) more then 90% of its sales was ex-ported, which amount up to 5% of Sweden’s total export. Due to mergers and acquisitions the pharmaceutical industry today is dominated by one large multinational company, Astra-zenica. Large public and private investments in medical research have put Sweden in a lead-ing position in medical sciences; it is one of the countries publishlead-ing the largest number of life sciences articles per capita. This has benefited Swedish pharmaceutical companies, which have been able to establish partnership in their own country with globally well-known research teams. (Swedish institute, 2007)
Industries or product groups that all shows a deteriorating market position is corrugated cardboard-, office machines-, coach of cars- and tobacco- industries.
Also worth mentioning is that the biggest fluctuations in market position all occurs inside the same sectors, forest products and engineering.
In the next section evidence of the Swedish export in high-technology industries will be presented. The section will investigate if there is any clear evidence of the so called Swedish paradox, where high technology exports are low given the high R&D investment.
3.2 Evidence on Swedish Export Performance in
Technology-intensive Industries
The expected sign of
β
1 in equation (1) depends on the assumption we make about Swe-den’s comparative advantage in R&D-intensive industries in general. Compared to other countries, Sweden ranks rather high in terms of resources dedicated to production of new technology.Change in R&D as a percentage of GDP 1985-2003 0,00 1,00 2,00 3,00 4,00 5,00 6,00 1 9 8 6 1 9 8 7 1 9 8 8 1 9 8 9 1 9 9 0 1 9 9 1 1 9 9 2 1 9 9 3 1 9 9 4 1 9 9 5 1 9 9 6 1 9 9 7 1 9 9 8 1 9 9 9 2 0 0 0 2 0 0 1 2 0 0 2 2 0 0 3 Year Denmark Finnland Iceland Japan Norway Sweden Great Britain US Eu-15 Israel
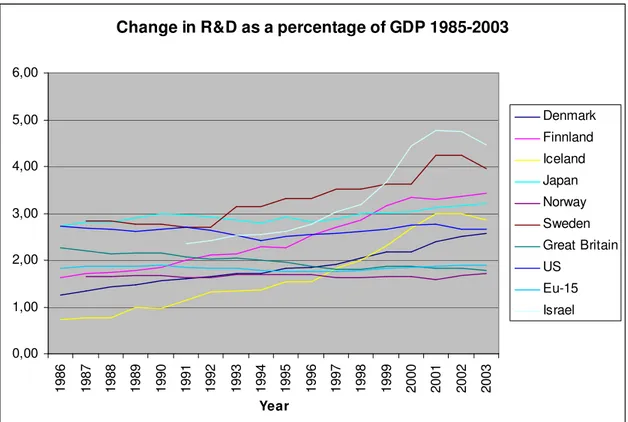
Figure 2 Change in R&D as a percentage of GDP 1985-2003
As seen in figure 2, Sweden puts a lot of money into R&D relatively to other countries. The impression of high Swedish R&D amount is reinforced by the fact that small countries in general seem to have less R&D as a proportion of their manufacturing sectors than large countries. This can also been viewed in fig 2, in 1986, Sweden, US and Japan all lies on the same level but both the US and Japan has kept their R&D intensity on a fairly constant level during the years meanwhile Sweden, Israel and Finland has shown a remarkable im-provement
So we have concluded that Sweden devote a lot of resources into R&D, but how about the output? If we take a look at R&D in percentage of value added the increase from 1985 to 2003 is only 0, 56 percentage. This might reinforce the statement about “the Swedish para-dox” (Erjemo,Kander 2006). Which means that for a given “research input”, the “output” in form of international competitiveness is less than could be expected i.e our research is not efficient or productive enough. However another explanation has been put forward to, and that is the location of R&D by multinational firms. If Swedish multinational companies tend to focus their spending of R&D in parenting companies and then focus their manu-facturing in subsidiaries or branches in other countries where the production costs are lower the output is not really showed in Sweden’s value added.
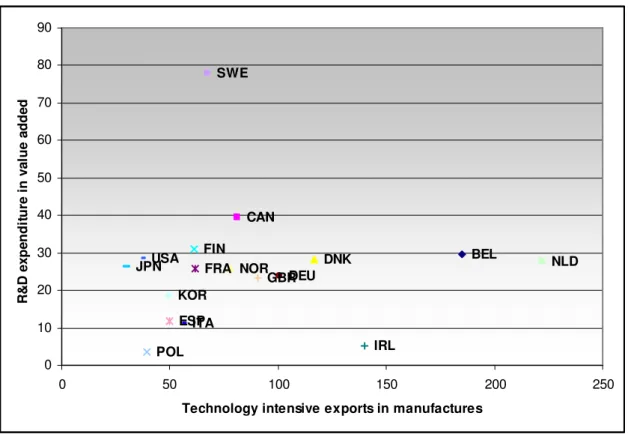
Figure 3 R&D intensity in manufacturing industry and share of technology-intensive products in manufactured exports in OECD countries, 2001.
Following OECD classification that has been stable since 1973, we define high technology products as those coming from industries where R&D expenditure exceeds 4 percent of sales. Examples of high-technology industries are:
• Pharmaceuticals • Aircraft & spacecraft
• Medical, precision & Optimal instrument • Radio, television & communication equipment • Office accounting & computing machinery
Sweden does not seem to obtain all the benefits from R&D in terms of high-tech pro-duction. The two industries were Sweden has increased their market position of high-technology industries are pharmaceuticals and radio, television & communication equipment. But as mention before, pharmaceuticals export only stands for 5% of Swe-den’s total export and does not really push the share of technology-intensive export forward. It is also only a small part of the radio, television & communication equip-ment sector that has experienced increased market position and therefore same result applies here. Worth mentioning is that both Canada and Finland, which also are abun-dant in forest-resources, have fairly the same share of high-technology intensive export as Sweden. The data was retrieved from OECDstat.
BEL CAN DNK FIN FRA DEU IRL ITA JPN KOR NLD NOR POL SWE GBR USA ESP 0 10 20 30 40 50 60 70 80 90 0 50 100 150 200 250
Technology intensive exports in manufactures
R & D e x p e n d it u re i n v a lu e a d d e d
4 Model Formulation
In the following section the equation formula for the regression will be presented together with the different variables used in the regression.
4.1 Adjustment to changes in comparative advantage
The common way to perform a statistical analysis of trade patterns is a pure cross section analysis where data for market position rit for a given year are regressed on data for the ex-planatory variables Xit for the same year. This might be written as
it it
it x u
r =
α
+β
+ (4)Where uit is a random error term representing the influence of industry specific factors on market position. This equation presumes that actual trade data reflect an equilibrium posi-tion, but the industrial pattern of net trade rit will not adjust immediately to changes in fac-tor endowments. In reality this might take a very long time. In order to take this process into account we can use a model of partial adjustment (Gujarati 2003).
it it it x u r* =
α
+β
+ (5a) it it it it it r r r u r − −1 =δ
( * − −1)+ 2 0<δ
<1 (5b)r*it is the equilibrium market position that is determined by the combination of relative factor endowments in the trading countries at time t and relative factor requirements by in-dustries xit. The first part of equation (5b) is simply the change between relative interna-tional competitiveness from one given period to another. If
δ
=1 means that the actual market position is adjusted immediately, i.e. no lags. Typicallyδ
is expected to lie between 1 and 0 since adjustment to desired market position is expected to be incomplete due to in-activity in factor endowments, hence the name partial adjustment.If we then insert (5a) into (5b) we get
it it it it it x r u u r =
αδ
+βδ
+(1−δ
) −1+δ
1 + 2 (6)In the thesis we argue that relative factor endowments in Sweden may have shifted during the period 1985-2003. The hypothesis that we want to test is if changes in output, and by that in market position, are related to capital intensities across industries or, in other words, have capital-intensive industries improved their market position?
it it it it i r r bx u r = − = + + ∆ −1
α
re (7a) Which is equivalent to it it it it a bx gr u r = + + −1+ (7b)where g=1. This equation is similar to (6). This mean that we cannot see any difference be-tween the two cases, which implies that changes in the trade pattern during the period 1985-2003, might reflect either a lagged adjustment to previously existing patterns of com-parative advantage, or an adjustment to changing factor endowments during the period. So using equation (7b) where rit= market position for a given year are regressed on data for the explanatory variables xit for the same year. To be able to take into account the adjustment
to previously patterns of either comparative advantage or factor endowments grit-1 is also included, which simply represent the market position in 1985.
In the next section the dependent and independent variables will be presented and their impact on market position.
4.2 Definition and measurement of the variables
All the variables take the form of ratios; market shares, factor intensities, indices etc. All data apart from the R&D data have been retrieved from SCB. The R&D data was retrieved from OECDstat. Both dataset has the limitations that were stated in the beginning of the thesis.
Dependent Variable
RIC03 index of relative international competitiveness in 2003.
The dependent variable (RIC03) is rit, the index of relative international competitiveness in 2003 as defined in equation (2) and (3). This variable corresponds almost to the dependent variable most commonly used in cross-section analysis of trade patterns to test theories of comparative ad-vantage. (Deardorff A, 1984). Trade and production data for 2003 were available for 159 industries at the 5digit level of the SNI.
Independent Variables
RIC85 index of relative international competitiveness in 1985
The independent variable (RIC85) is rit, the index of relative international competitiveness in 1985 as defined in equation (2) and (3). The market posi-tion a product held in 1985 will influence what market posiposi-tion it will have in 2003.
RLAB03 index for employee per million SEK of value added in 2003
Provided that physical as well as human capital earns the same return in all sectors, value added per employee may be used as a measure of total (hu-man + physical) capital intensity. Here we have used the inverse; labor re-quirements per million SEK of value added. This variable is used as output values for the labor force, or simply how much value added the labor force contribute with.
AWAG03 wage cost per employee in 2003
Human capital intensity is measured in wage differentials, in other words the average wage. It is also a good indicator for detecting high- vs. low-skilled workers.
CAP value added minus wages per employee 2003
Physical capital intensity is measured by the amount of value added minus wages per employee. It then indicates if we have a capital- or labor-abundant work force.
FOUO R&D cost in percent of value added in OECD 2003
R&D cost in percent of value added or sale is the most common way to measure the input of R&D expenditures. To be able draw any conclusions about Sweden’s R&D input it needs to be compared to the rest of the world. R&D is very costly to conduct and because of that only the OECD countries has been taken into account since they represent high-income countries.
Data for R&D expenditure are only available on a more aggregated level than the other data, on 29 industries. This means that average R&D figure has been used and then been matched to the 159 industries for trade and production data, which also implies that the full variation in the R&D variables is not taken into account in the regression analysis and that the results must be interpreted with caution.
5 An assessment of the Regression Results
The equation used in the regression is rit =a+bxit +grit−1 +uit, to be able to see the clear
effect of the explanatory variables three different equations set have been used, in each equation set the explanatory variables used, xit, has been changed.
The low values of r-square are expected since cross-sectional data has been used. The equa-tions have also been regressed as multiplicative equaequa-tions, but the results did not differ from the additive model and has therefore been removed. The data has been tested for heteroscedastity but there where no obvious signs of problems.
For all three equations set the dependent variable will be the relative international competi-tiveness index for 2003, RIC03.
Table. 1 Regression result for equation set 1
Variables Coefficient Std. Error t-statistic Probab. R2
C -68,301 10,042 -6,802 0,000 0,295
RIC85 69,329 10,039 6,906 0,000
RLAB03 -363,049 0,000 -0,295 0,467 FOUO -1,3005 1232,374 0,730 0,769
In table 1 the index for relative international competitiveness seems to be stable, even for such a long period of time as 18 years. This can be seen through the strongly significant values of the coefficient RIC85 in all equations, which also means that a strong market po-sition in 1985 implies a positive relationship to the market popo-sition in 2003. The RLAB03 variable which is the employee per value added index is negative but not significant. This indicates that Sweden may have a labor-intensive disadvantage, i.e. there are indications of that the market position for industries with high total capital intensity during the years
85-03 has improved. This result should though be interpreted with caution since the variable is not significant.
In above equation it is hard to really establish any clear effect on the Swedish market posi-tion from looking at the R&D expenditure in OECD countries since the variable is insig-nificant. But the since the coefficient is negative it could indicate that the more money OECD puts into R&D the more competition Sweden will experience, which has a negative impact on our market position. As neo-technology theories mention, international com-petitiveness in an industry will not only be affected by the degree of technical complexity of the industry in general, but also by the amount actually spent on R&D relative to competi-tors. So in order to minimize measurement errors the variable FOUS, R&D expenditure in percent of value added in Sweden is enclosed, in the next regression, otherwise the R&D effect for Sweden well be embodied in the R&D variable for the OECD countries and may not give any clear indications how Sweden’s R&D expenditure has affected the market po-sition.
Table 2. Regression result for equation set 2
Variables Coefficient Std. Error t-statistic Probab. R2
C -62,649 10,157 -6,168 0,000 0,326
RIC85 63,674 10,155 6,270 0,000
RLAB03 -350,838 1209,803 -0,290 0,772
FOUS 0,001976 0,001 2,309 0,023
FOUO -0,00011 0,000 -2,417 0,017
In table 2 equations the FOUS variable has been submitted. The regression results then show that both the FOUS and FOUO variables are significant. The FOUS variable is as expected positive which means that R&D expenditure in Sweden has a positive impact on the market position. This is contrary to the “Swedish paradox” theory, that Sweden does not reap the benefits from the resources they put in to R&D. But as discussed earlier there is no evidence that Sweden because of comparative advantages in R&D has improved its market position in high-technology sectors, just as Lundberg (1988) and Braunerhjelm (1988) concluded in their rapports. FOUO’s coefficient is negative also as expected, since the more resources the rest of the OECD countries put into R&D increases the competi-tion from Sweden and thereby worsen our market posicompeti-tion. RIC85 and RLAB03 coeffi-cients have the same sign as in equation 1 and RIC85 is still significant which shows a sign of stability. What have been detected are problems with some multicollinearity between FOUS and FOUO. According to Gujarati (2003) although high zero-order correlations may suggest collineartiy, it is not necessary that they have to be high to have collinearity in any specific case. In models involving more than two explanatory variables, the simple cor-relation will not provide a reliable guide to the presence of multicollinarity. There is a trade off between omitted variable and multicollineratiy but since significant results and a low
R-square are presented it can be interpreted that the obvious signs for mulitcollineratiy are not there. (Gujarati, 2003)
But then continuing to equation 3, the FOUO variable has been omitted since when the AWAG03 and CAP variable is included the FOUO “crowds out” the results from FOUS, and AWAG03 and the CAP variable increase the collineratiy between FOUO and FOUS. The AWAG03 variable, wage cost per employee, is positive and significant. This can be in-terpreted as the higher wage cost the better market position. The higher wages can be di-rectly correlated to high-skill work, because the higher salaries the more well-educated la-bor force i.e. high human capital-intensity. This works well in line with that Sweden puts a lot of resources into R&D and that Sweden is a country that shows signs of having a labor-intensive disadvantage. Just as Hine & Wright (1998) points out high wage countries have been exposed to international competition, the growth in manufacturing exports from low-wage economies has increased the import of labor-intensive manufactures such as clothing and textile, which both Lundberg (1988) and I have concluded in our investigations. The RIC85 variable is still positive and significant, the FOUS variable is still positive but not significant, which then can be interpret that the general trend that R&D has a positive ef-fect on the Swedish market position, but in this case it can not be statistically proven. Table 3. Regression result for equation set 3
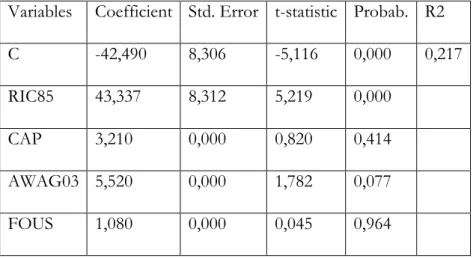
Variables Coefficient Std. Error t-statistic Probab. R2
C -42,490 8,306 -5,116 0,000 0,217
RIC85 43,337 8,312 5,219 0,000
CAP 3,210 0,000 0,820 0,414
AWAG03 5,520 0,000 1,782 0,077
FOUS 1,080 0,000 0,045 0,964
When looking at the CAP variable, value added minus wages per employee, the coefficient is positive but the variable is not significant, therefore we can not say with statistical cer-tainty that physical capital intensity improves the market position but there are signs of it. The forest industry is a good example where a lot of physical capital is used because of ma-chinery and such (Kujansivu & Lönnqvist, 2007). Earlier in the study there was evidence of that the market position for the forest industry has improved during the last eighteen years. The fact that we have indications that physical capital improves the market position and that we know for sure that Sweden has increased their market position in the forest pro-duction is contrary to what Leamer & Lundberg (1995) found and may indicate that Swe-den is still so capital-abundant that the forest does not “starve” out the rest of the manu-facturing sector.
6 Conclusion & Further Research
The purpose of this thesis was to analyze changes in the industry pattern of relative inter-national competitiveness and interinter-national specialization in the Swedish manufacturing in-dustry during the period 1985-2003. This has been done in terms of various inin-dustry char-acteristics assumed to reveal comparative advantage; in particular, we focus on the role of technology and technical improvement through research and development.
The changes in market position for most products are relatively small, which means that the relative international competitiveness index has not changed that much during the time period. The two sectors that stand out the most are the forest and engineering industry. Both the food and textile industry has held a fairly constant change in their market posi-tions. What can be concluded is that it is not the sector as a whole that experience improv-ing market position, instead it is certain products such as pharmaceutical, sulphate and elec-tric components among others.
We know that Sweden ranks very high in terms of resources dedicated to production of new technology, Sweden spend a great amount on R&D in percentage of GDP compared to other countries. But when measuring the output from R&D in percentage of value added the increase from 1985 to 2003 is only 0,56%. In the regression results the FOUS variable was positive which means that R&D expenditure in Sweden has a positive effect on the market position of Swedish industries, but the coefficient was very small which goes inline with that the “real” effect that R&D expenditure has on the market position is very small. These are all evidence that reinforce the statement that the Swedish paradox does ex-ist. To conclude the R&D discussions we can add the findings that an increase in OECD R&D in percentage of value added deteriorate Sweden’s market position because of com-petition.
As expected, the regression result found a strong market position in 1985 implies a strong market position in 2003, which can be seen through the small fluctuations in the relative in-ternational competitiveness index.
The fact that wage cost per employee had a positive and significant effect on the market position in 2003 implies that higher wages leads to a stronger market position. High-skilled workers often have a higher salary than “blue-collar” workers which implies that Sweden is moving away from unskilled labor to high-skilled labor. This in turns reinforce the state-ment that Sweden has a labor-intensive disadvantage, i.e. indications that the market posi-tion for industries with high total capital-intensity has increased.
An interesting study to conduct would be to examine if the shifts in market position away from labor-intensive industries to more capital-intensive ones has increased the welfare to society as a whole or how the shift has impacted the labor-force in Sweden. Another inter-esting topic to evolve around would be to more closely take a look at which sectors that conduct the most R&D, how they get their funding (input) and how the revenue for exam-ple patents are distributed (output). In other words, to pin point down who reaps the
References
Andersson, L. (2001) Openness and Total Factor Productivity in Swedish Manufacturing, 1980-1995, Weltwirtschaftliches Archiv 2001, Vol. 137 (4) pp690-713 Balassa, B. (1965) Trade liberalization and “revealed” comparative advantage. The
Manchester School 33
Bowen, H. P., Hollander, A., Viaene, J.-M. (1998) Applied international trade analysis, Basingstoke: Macmillan
Brakman, S, Garretsen, H, van Marrevijk, C. (2006) An introduction to geographical economics, Cambridge: Cambridge University Press
Braunerhjelm P., Ekholm K., (1998) The geography of multinational firms, Kluwer academic publisher
Can D. Le (1987) The role of R&D in high-technology trade: An empirical study, Atlantic Economic Journal, vol 15 nr 4 pp 3238
Castellacci, F. (2002) Technology-gap and cumulative growth: models, results and performances, Druid Working papers 1-4
Deardorff, A. (1984) Testing trade theories and predicting trade flows, In R.W Jones & P.B Kenen (eds.), Handbook of International Economics, North-Holland Erjemo, O. Kander, A. (2006) The Swedish Paradox, CIRCLE Center for
Innovation, Research and Competence in the Learning Economy Lund University, Working papers 2006/01
Freeman, C. (2004). Technological infrastructure and international competitiveness, Industrial and Corporate Change, vol 13, pp 541-569
Government Offices of Sweden (2007) The globalisation council. Retrieved June 3, 2008 from:
http://www.sweden.gov.se/content/1/c6/08/88/00/6cfe36b5.pdf
Hine, R. Wright P. (1998) Trade with low wage economies, employment and productivity in UK manufacturing, The economic Journal, no 108 (September), pp 1500-1510
Hughes, K. (1986) Exports and Technology. Cambridge University Press
Krugman P, Obstfeld M. (2006) International Economics – Theory and Policy 7th edition, Boston: Pearsons International Edition
Kujansivu P, Lönnqvist A. (2007) Investigating the value and efficiency of intellectual capital, Journal of intellectual Capital, vol 8, no 2, pp. 272-287
Leamer, E, Lundberg, P. (1995) A Hecksher-Ohlin view of Sweden competing in the global market place, Working paper no 5114, National Bureau of Economic Research.
Lundberg, L. (1988) Technology, factor proportions and competitiveness, The Scandinavian Journal of Economics, vol 90, no2, pp.173-188
OECD (2005) Main Science and Technology Indicators, Paris: OECD Skogsindustrierna (2006) En fakta samling. Retrieved June 3 2008 from:
http://www.skogsindustrierna.org/LitiumDokument20/GetDocument.as p?archive=3&directory=1045&document=7479
Skogsindustrierna (2007) Om Skogsindustri. Retrieved June 3, 2008 from
http://www.forestindustries.se/LitiumInformation/site/page.asp?Page=1 0&IncPage=4148&IncPage2=232&Destination2=226&Destination=227
Swedish Industry (2007) Biotechnology and Pharmaceuticals in Sweden August FS 132 C Swedish Industry (2005). The Swedish Engineering Industry November FS 126 B Pe.
Retrieved June3, 2008 from
http://www.sweden.se/upload/Sweden_se/english/factsheets/SI/SI_FS 126b_Swedish_Engineering_Industry/The_Swedish_Engineering_Industr y_FS126B.pdf
Appendix 1
Conversion between SNI69 and SNI92
Sector SNI69 SNI92
Food, drinks & tobacco 313,314 15,16
Wearing apparel, textiles and shoes 321-324 17-19
Forest Products 331,332,341 20-20.203+36.1+21+
22.1-22.13+22.2
Engineering 383,384 24.65+32+31+35.1+
34+35.3+35.2+35.4+ 35.5+30
Chemicals & Minerals 352-354 23+24-24.4+24.65+
25.21+24.4+25-25.21 SNI 2002
15= Livsmedels- och dryckesvaruframställning 16= Tobaksvarutillverkning
17= Textilvarutillverkning
18= Tillverkning av kläder; pälsbereding
19= Garvning och annan läderberedning; tillverkning av reseffekter, handväskor, skodon o.d
20= Tillverkning av trä och varor av trä, kork och rotting o.d. utom möbler 21= Massa-, pappers- och pappersvarutillverkning
22= Förlagsverksamhet; grafisk produktion och reproduktion av inspelningar
23= Tillverkning av stenkolsprodukter, raffinerade petroleumprodukter och kärnbränsle 24= Tillverkning av kemikalier och kemiska produkter
25= Tillverkning av gummi- och plastvaror 30= Tillverkning av kontorsmaskiner och datorer
31= Tillverkning av andra elektriska maskiner och artiklar 32= Tillverkning av teleprodukter
34= Tillverkning av motorfordon, släpfordon och påhängsvagnar 35= Tillverkning av andra transportmedel