Impact of private labels' in-store placement on
consumers' quality perception and purchase
intention
– An empirical study investigating Apoteket AB
School of Business, Society and Engineering (EST)EFO704 – Master Thesis in Business Administration
Authors:
Sofia Helleday 930526
Claudia Kögler 910912
Supervisor:
Konstantin Lampou
Co-Assessor:
Ulf Andersson
Abstract
Title: Impact of private labels' in-store placement on consumers' quality perception and purchase intention – An empirical study investigating Apoteket AB
Date: 2016-06-03
Level: Master Thesis in Business Administration, 15 ECTS
Institution: School of Business, Society and Engineering – Mälardalen University Authors: Sofia Helleday Claudia Kögler
26th May 1993 12th September 1991
Supervisor: Konstantin Lampou
Keywords: Private labels, in-store placement, quality perception, purchase intention Research questions: How do specific in-store placements of a private label product affect
consumers' quality perception?
How do specific in-store placements of a private label product affect consumers' purchase intention?
Purpose: The purpose of this study is to investigate a potential impact of private labels' in-store placement on consumers' quality perception and purchase intention with a view to the Swedish pharmacy market – namely, Apoteket AB, which is regarded as the research's case example.
Method: Systematic observations were carried out in two Apoteket AB stores first, which facilitated the structure of the customer survey. In total, 89 completed questionnaires were received to answer the research questions and test the corresponding hypotheses.
Conclusion: Conducted observations demonstrate a certain particularity of Apoteket AB's store brands' placement. Results of the survey show that consumers perceive the quality of Apoteket AB's private label product higher if the product is placed in an off-shelf display or at eye-level, and lower if it is placed at bottom-level. Furthermore, it is indicated that an off-shelf display receives higher rankings on quality perception than an eye-level placement. In terms of purchase intention, an off-shelf display indicates a positive and a bottom-level placement a negative impact. Finally, it is evident that respondents are more likely to buy a product with a higher perceived quality. Outcomes could provide Apoteket AB with important information how to boost profits with their store brand portfolio. In order to improve the trust of its private label range and continuously enhance consumers' respective quality perception and purchase intention, Apoteket AB should increasingly place their store brands in prime locations such as off-shelf displays and at eye-level.
Acknowledgements
We would like to start by thanking all the people who willingly shared their time to answer our questionnaire and furthermore, the two Apoteket stores in Västerås, which were cooperative and kindly granted us permit to conduct our observations. In addition, many thanks are given to both seminar groups and our co-assessor Ulf Andersson for their constructive feedback in and outside of the seminar-hours. Last but not least, we would like to thank our supervisor Konstantin Lampou for his helpful comments, engagement and overall guidance during the Master thesis process.
Table of Content
1. Introduction ... 1
1.1 Private Labels in Retailing ... 1
1.2 Industry and Company Overview ... 2
1.3 Problem Statement ... 2
1.4 Purpose ... 4
2. Theoretical Framework ... 5
2.1 Importance of Category and Shelf Management in Retail Marketing ... 5
2.2 Shelf Management Research on Private Labels ... 7
2.3 Stimulus-Response Theory ... 7
2.4 Cue Utilisation Theory ... 8
2.4.1 Quality Perception Process ... 10
2.4.2 Prior Research on Intrinsic Cues ... 10
2.4.3 Prior Research on Extrinsic Cues ... 11
2.5 Hypotheses Development and Conceptual Framework ... 12
3. Methodology ... 16
3.1 Systematic Observations ... 16
3.1.1 Objective and Approach ... 16
3.1.2 Observation Schedule ... 17
3.1.3 Data Collection ... 18
3.1.4 Trustworthiness and Authenticity ... 18
3.2 Customer Survey ... 19
3.2.1 Operationalisation ... 19
3.2.1.1 Approach and Choice of Private Label Product ... 19
3.2.1.2 Dependent Variables ... 20
3.2.1.3 Independent Variables ... 21
3.2.2. Data Collection ... 22
3.2.3. Reliability and Validity ... 22
3.2.4. Limitations... 23
4. Findings & Analysis ... 25
4.1 Systematic Observations ... 25
4.1.1 Findings of In-Store Observations... 25
4.1.2 Analysis of In-Store Observations... 26
4.2.1 Coding and Evaluation of Independent Variables ... 27
4.2.2 Hypotheses Testing ... 28
4.2.2.1 Quality Perception ... 28
4.2.2.2 Purchase Intention ... 30
4.2.2.3 Relationship between Quality Perception and Purchase Intention ... 31
5. Research Discussion ... 32
6. Conclusion ... 34
6.1 Managerial Implications ... 34 6.2 Future Research ... 35References ... 36
Appendix A ... I
Appendix B... III
Appendix C ... VI
Appendix D ... IX
List of Figures and Tables
Figure 1: Black box model (Adapted source: Kotler et al., 2009) ... 8 Figure 2: Simplified model of the cue utilisation process (Adapted source: Olson & Jacoby, 1978).... 9 Figure 3: Conceptual model - Potential effects of five different in-store placements on quality
perception and purchase intention (Source: Own presentation) ... 15 Figure 4: Distribution of answers regarding shopping frequency (Source: Own presentation) ... 28 Figure 5: Distribution of answers regarding familiarity of the brand (Source: Own presentation) ... 28
Table 1: Significance regarding impact of different in-store placements on quality perception (Source: Own presentation) ... 29 Table 2: Significance regarding impact of different in-store placements on purchase intention (Source:
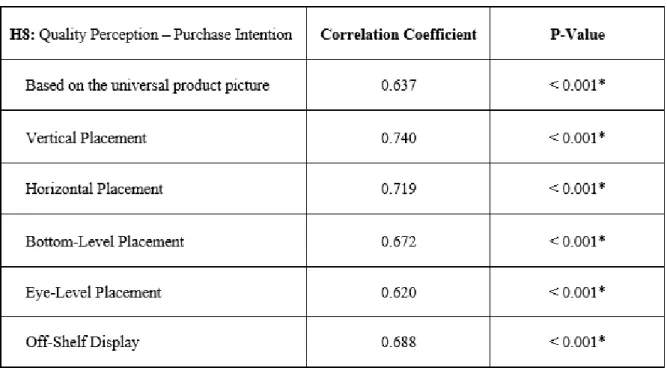
Own presentation) ... 30 Table 3: Significance of the relationship between quality perception and purchase intention (Source:
1. Introduction
1.1 Private Labels in Retailing
Private label brands or store brands, which are developed and managed by retailers (Sayman, Hoch & Raju, 2002), have clearly affected the markets since they were launched. Different companies operating in different industries are introducing their own brands to the corresponding markets as a strategic choice to compete with manufacturers and their respective brands. Due to the fact that they evoke interest among customers with their low prices and that they generate large sales margins, private labels are essential resources for retail firms (Hoch & Banerji, 1993). Accordingly, they are still generally competing first and foremost based on price where such brands are estimated to have a price up to one third lower than manufacturer brands (Bao, Bao & Sheng, 2011; The Nielsen Company LLC, 2014). Yet, over the years, they made a tremendous development and are, nowadays, not seen as cheap copies of those brands anymore but as worthy opponents (Ailawadi & Keller, 2004). Private labels' quality, for instance, is not perceived as universally lower than their manufacturer competitors. As stated in the private label report of the market research company Nielsen (2014), 71 percent of all global respondents specified that the quality of store brands has improved vastly over the years. Furthermore, “successful retailers have invested in brand management activities like those of their manufacturer peers, building significant brand equity and recognition for their products by providing value with standard and premium offerings for consumers at all price points” (The Nielsen Company LLC, p. 15, 2014). Because of that, private labels distinguish themselves from their contenders in various retail markets, and can be found nowadays, for example, in grocery retailing, in electronics stores, in the cosmetic industry as well as in the pharmacy sector.
All in all, consumers' perceptions of private labels are currently positive around the globe (The Nielsen Company LLC, 2014). Yet, corresponding value shares are not equally allocated between countries. The average contribution of private labels globally towards retail sales is 16.5 percent. However, there are great discrepancies whereby developed regions like Europe, Australia and North America exhibit much higher value shares than the rest of the world. In general, Europe is seen as the private label
leader where store brands became necessary staples in consumers' households. Thus, the penetration
of private labels is extremely high in European countries and still increasing (The Nielsen Company LLC, 2014). Due to the fact that the following study is conducted in the Swedish market, the dollar share of private labels in Sweden is especially relevant. According to the ranking presented by market research company Nielsen (2014), Sweden is occupying the 10th place with a private label value share
of 25 percent; furthermore, this number is steadily increasing with a growth rate of three percent in the years from 2009 to 2013. Consequently, store brands seem to play an increasingly important role in the Swedish retail sector.
1.2 Industry and Company Overview
This research considers store brands on the Swedish pharmaceutical market, and in particular with regard to Apoteket AB which is used as the study's case example. Today, Apoteket AB is fully-owned by the Swedish government (Euromonitor, 2016). Correspondingly, the journey towards an open pharmaceutical market in Sweden started in 2006 when the government ordered an investigation of the possibility to open up the pharmaceutical market (Statskontoret, 2013). Before July 1st 2009, Apoteket
AB was the only player on the market. This deregulation meant that more companies could enter the pharmaceutical market and it opened up the possibility of non-prescription drugs being sold by companies that were not pharmacies (Statskontoret, 2013).
Today, Apoteket AB's core business is retail sales in the chemists and pharmacies channel with a strong focus on store brands. It introduced its first private label on the Swedish pharmaceutical market in 2007 before the deregulation. The majority of private label products on the market today are not medicines but personal care products for the body, hair and skin. Lines of supplements are also available to customers in different price segments with a clear focus on quality. Private labels are a relatively new addition to the pharmaceutical market in Sweden and thus, there is still room for them to grow (Euromonitor, 2016). Accordingly, the company has already a strong focus on developing and enhancing its store brand range Apoliva that showed rapid growth in various segments. Other private labels in Apoteket AB's product assortment are Apoteket, Apoteket formula, Försvarets Hudsalva and
c/o Recipe for men. In 2015, its private label range accounted for approximately 30 percent of its
growth. Consequently, private labels at Apoteket AB are on the rise due to the trust consumers have for the company. (Euromonitor, 2016)
1.3 Problem Statement
A lot research has been accomplished in the last two decades about issues and challenges regarding the topic of private labels. Corresponding articles are notably concentrating on consumers' attitudes and perceptions towards private labels and thus, on how store brands perform against manufacturer brands while investigating different relationships and environments (Ailawadi, Pauwels & Steenkamp, 2008; Bao et al., 2011; Burton, Lichtenstein, Netemeyer & Garretson, 1998; Hoch & Banerji, 1993). In particular, prior literature focused on certain product cues and their effect on consumers' evaluation of private labels. Olsen and Jacoby (1972) are one of the first to research this in detail and thus, established the so-called cue utilisation theory where products are envisioned to comprise of a range of cues. Subsequently, those cues are providing a foundation for developing various impressions of the product itself (Olson & Jacoby, 1972). In this context, a distinction is made between intrinsic and
extrinsic cues, which are explained in greater detail in the theoretical framework chapter. Previous
research on store brands' intrinsic cues examined for instance the taste, aroma, freshness and nutrition of products (De Wulf, Odekerken-Schröder, Goedertier & Van Ossel, 2005; Omar, 1994; Veflen
Olsen, Menichelli, Meyer & Næs, 2011). Yet, greater research has been carried out towards consumers' perception of extrinsic cues of private label products – such as store image and loyalty, package design, brand name and especially price (Ailawadi et al., 2008; Bao et al., 2011; Choi & Coughlan, 2006; Richardson, Dick & Jain, 1994; Sayman et al, 2002). However, as stated in the private label report of market research company Nielsen (2014), nowadays “private labels' appeal goes beyond price” (p. 4), even though the factor “price” is still essential to most consumers as it is the primary driver of their purchase decision. Consequently, other product cues receive attention in the current literature as well. For instance, Bao et al. (2011) investigated the effects of product signatureness and quality variation on consumers' motives for purchasing private labels. Furthermore, articles suggest future research directions in terms of how other product cues could affect the consumer perspective of store brands.
In order to contribute to the research topic of how consumers perceive private labels, this study focuses on the impact of in-store placement, which has not been studied yet in this context. Correspondingly, this research is addressing a relevant gap in the literature, as Bao et al. (2011) indicated this research direction in their article, and thus presents a demand for this thesis. Considerable academic attention is being dedicated to category and shelf management in the (grocery) retail industry generally, and to insights on consumer behaviour (Desrochers & Nelson, 2006). According to Underhill's prominent book Why we buy (2009), shopping is even regarded as a science where retail space contributes to the wellbeing of customers in the store and therefore, to profit maximisation. Successful retailers are making respective decisions on which products to shelve where and in what quantity (Hansen, Raut & Swami, 2010). In particular, certain shelf positions and displays are considered as in-store stimuli, which have a tremendous effect on customers' attention and likelihood of purchasing products (Inman, Winer & Ferraro, 2009).
However, no insights are provided yet, to the authors' knowledge, whether specific placements of store brands affect how consumers perceive the quality of those products and if such placements motivate the purchase intention of customers. Solely, the optimal positioning of private labels towards (leading) manufacturer brands for retailers has already been analysed through numerical models, while taking different conditions into account (Choi & Coughlan, 2006; Morton & Zettelmeyer, 2004; Sayman et al., 2002). Beside the fact that there is little research on shelf management and product placement in terms of private labels (Nogales & Suarez, 2005), there are two main reasons for choosing and hence, investigating the in-store placement as the key indicator for this thesis. On the one hand, according to Sayman et al. (2002), positioning of private labels – in this respect, the “perceptual distance between two brands” (p. 379) – can mobilize an essential impact on their performance. On the other hand, it is demonstrated that extrinsic cues are more likely to influence perceptions of a store brand (Ailawadi & Keller, 2004) and that consumers tend to put more faith on such extrinsic cues when assessing its respective quality (Richardson et al., 1994).
As mentioned previously, major research about issues and challenges regarding private labels has been conducted towards grocery retailing and thus, relationships with different product cues and consumer evaluations of store brands in supermarkets. In order to contribute with the assessment of a different store environment and therefore, addressing another gap in this context, consumer perceptions of private brands are determined in the pharmacy market. Regarding this study's case example Apoteket AB, recent development measures emphasized the growth of their own brands, and it is stated that the company has had an aggressive pace in their private labels' performance (Superbrands Sverige AB, 2010). Furthermore, findings of systematic observations conducted for this study in two Apoteket AB stores indicated that the in-store placement of its private labels could be observed to be different from grocery stores; they were given more prominent shelf and display positions in the store and subsequently, putting less emphasis on manufacturer brands. Due to Apoteket AB's specific brand management and respective observation findings, investigating this research topic in a pharmaceutical environment is expected to provide rich data in another way compared to grocery retailing and thus, potentially more sophisticated results.
Consequently, in order to address the problem statement and fulfil the objective of the study, the following research questions are proposed:
RQ1: How do specific in-store placements of a private label product affect consumers' quality perception?
RQ2: How do specific in-store placements of a private label product affect consumers' purchase intention?
1.4 Purpose
The overall purpose of this study is to investigate a potential impact of private labels' in-store placement on consumers' quality perception and purchase intention in the Swedish pharmacy market – namely Apoteket AB, which is regarded as the research's case example. Systematic observations were carried out in Apoteket AB stores in order to emphasise the particularity of its store brands' placement. Yet, the purpose is achieved by means of a quantitative approach whereby a customer survey is implemented.
2. Theoretical Framework
2.1 Importance of Category and Shelf Management in Retail Marketing
In order to be successful as a retailer in today's business world, the ability is required of matching the environment with continuous decisions on “how much of which products to shelve where and when” (Hansen et al., 2010, p. 94). In this context, category management – “the strategic management of product groups through trade partnerships, which aims to maximize sales and profits by satisfying consumer needs” (Varley, 2006, p. 46) – is growing in importance. In particular, the retailers' product assortment and the setting in which it is presented, gives them various opportunities and an overall strength (Varley, 2006). Yet, apart from establishing the category configuration, retailers have to decide on factors such as space allocation and in-store presentation of the product range. This provides an effective way of shopping and lures interested customers into the store (Gilbert, 2003).
In general, selling space is one of the most vital assets in the retail industry where retailers strive for its optimal use in order to maximize their profits (Gilbert, 2003). An efficient use of space depends on the proper product assortment, items that are easily located as well as on a coherent store layout (Varley, 2006). Especially with regard to the layout, selling space makes a tremendous contribution. According to Underhill's famous book Why we buy (2009), it is even a part of a science where it is essential to make customers feel comfortable in the store so that they spend more time and money. The entrance, for instance, is a crucial area for the promotion of both fast-selling products and those that have a major effect on the overall retail brand image. The back of the store is equipped with items that are notably attractive to customers so that they have to go through other areas of the store to reach the target. However, in order to lure customers into quieter store sectors with lower traffic, discounted merchandise is strategically placed. Another example is the placement of impulse items near cash registers, which pose as last minute shopping possibilities and thus, are able to boost profits (Underhill, 2009; Varley, 2006).
Another demand in today's retail environment is to expose shoppers to more goods (Underhill, 2009). This can be achieved through visual merchandising, which deals with the optimal item's in-store presentation and includes a suitable shelf management of products (Varley, 2006). In particular, retail shelf-space management is regarded as a major challenge in the present retailing industry (Hansen et al., 2010; Nogales & Suarez, 2005). In order to address the issue effectively, retailers adopt progressively “sophisticated shelf management and audience measurement tools” (Egon & Vollmer, 2008 in: Chandon, Hutchinson, Bradlow & Young, 2009, p. 1). One of the traditional and most common tools is the so-called planogram, which offers a heuristic approach for the shelf layout of goods (Murray, Talukdar & Gosavi, 2010). Yet, although various models in terms of the shelf space allocation problem exist (Nogales & Suarez, 2005), shelf management is still a demanding issue in
which indefinite procedures are practiced rather than specified theories and concrete evidence (Drèze, Hoch & Purk, 1994).
Due to the fact that in-store stimuli, such as shelf-space management, encourage customers to purchase unintended products (Inman et al., 2009), it is growing in importance for retailers. Furthermore, it is documented numerous times that, nowadays, most consumers make purchasing decisions directly in the store (Drèze et al., 1994; Underhill, 2009). As a consequence, relevant literature recognised the impact on sales and the provision of valuable insights of consumer behaviour research on category and, correspondingly, shelf management; especially in terms of product placement decisions (Desrochers & Nelson, 2006). Research confirms the significance of specific item placements as an indicator in customers' purchasing behaviour while attracting more attention and therefore, positively affecting the in-store decision making (Breugelmans, Campo & Gijsbrechts, 2007; Chandon et al., 2009; Drèze et al., 1994; Inman et al., 2009). For instance, as stated by Drèze et al. (1994), changing the visibility of an item through more shelf space (more facings) or placing it on more distinctive shelf positions, consumers' awareness and thus, the likelihood of purchase increase. Nonetheless, the number of facings is not the only feature of shelf management. According to Chandon et al. (2009), other in-store factors include vertical and horizontal shelf positions. In vertical placements, items are displayed on more than one shelf level while in horizontal placements, merchandise is placed on shelves next to each other in order to present a wide range of choices (Raghubir & Valenzuela, 2008 in: Chandon et al., 2009). Notably relevant for this thesis is the fact that there is a demonstrated influence of product placement in a horizontal or vertical retail display on consumers' quality expectations and hence, on their decision making in the store (Raghubir & Valenzuela, 2008 in: Chandon et al., 2009). In general, vertical shelf positions seem to have a larger impact on consumer behaviour than horizontal placements (Breugelmans et al., 2007). Correspondingly, various studies investigated the effect of different shelf positions in terms of their height. It is verified that items at eye-level and thus, on top and middle shelves, both evoke more interest among consumers and are more likely to be selected. Already more than twenty years ago, Drèze et al. (1994) demonstrated that “a couple of facings at eye level did more for a product than five facings on the bottom shelf” (p. 324) and therefore, indicated that position carries more weight than the number of facings. Chandon et al. (2009) stated that an item placement on the top shelf, against the bottom shelf, increased attention by 17 percent and choice by 20 percent. Furthermore, Sigurdsson et al. (2009) conducted an in-store experiment in which the middle shelf position acquired the highest sales percentage.
Consequently, shelf management has a big part in creating customer awareness, simplifying purchasing choices and hence, in offering certain cues of product appeals since in-demand goods are often placed on more distinctive shelf positions (Breugelmans et al., 2007).
2.2 Shelf Management Research on Private Labels
Academic literature on shelf-space management with regard to private label brands is rather poor. As mentioned previously, prior research investigated merely the optimal positioning of store brands towards (leading) manufacturer brands for retailers in order to maximize their profitability (Choi & Coughlan, 2006; Morton & Zettelmeyer, 2004; Sayman et al., 2002). In addition, researchers started to identify conditions under which retailers are better off putting their own brands in close proximity to manufacturer brands in order to target them directly or keep them at a certain distance (Morton & Zettelmeyer, 2004; Sayman et al., 2002).
The research of Nogales and Suarez (2005) is one of the few studies that concentrate on the effect of private labels in shelf management. They established their own approach of gathering information while directly observing shelves and various variables. This exploratory study was performed through sampling food, cleaning material and perfumery stores in Spain. The primary outcome was the considerable bigger space allocation to private labels than the average assignment to all other manufacturer brands. Due to the fact that their research mainly focused on space that both brands occupied in shelves, there is still little attention on the integration of a consumer behaviour approach to retailers' own brand management. Particularly, relevant literature is hard to find with regard to the impact of different in-store placements on consumers' quality perception and purchase intention in terms of private labels. Nevertheless, it is an essential issue to address due to private labels' distinguished status in the retail industry: retailers fully distribute them and put effort into a strategic shelf placement (Nogales & Suarez, 2005). Moreover, this gap is not only a future research direction implied by Bao et al. (2011), but also supported by Desrochers and Nelson's (2006) statement that shelf presentation provides a relevant opportunity for further consumer insights.
2.3 Stimulus-Response Theory
In order to provide a short excursion into the field of psychology and consumer behaviour, the prominent stimulus-response theory and its assumptions of explaining the behavioural approach to learning is briefly described, while constituting as a foundation for the following stages.
The basic approach of the theory is viewing the mind as a “black box” due to the fact that it is not visible which processes are carried out in the brain. Correspondingly, observable aspects of the behaviour are emphasised, and comprise of things that go into the box such as stimuli or happenings perceived from the outside world, and things that come out of the box such as responses and reactions to these stimuli (Solomon, Bamossy, Askegaard & Hogg, 2010). In terms of buying behaviour, the so called black box or stimulus-response model by Kotler, Keller, Brady, Goodman and Hansen (2009) is providing insights to comprehend what affects buyers in the store, and consequentially their decision-making to purchase an item or not (see figure 1 below).
Figure 1: Black box model (Adapted source: Kotler et al., 2009)
Stimuli, which are recognised by one of the five senses (Solomon et al., 2010), can revolve around the marketing mix and other external factors such as demographics or the economic situation. Regarding specific in-store stimuli, product placement can be considered as an important visual tool, which creates the appeal to encourage customers' purchasing intentions (Inman et al., 2009). This is conditional on buyers' characteristics and internal influences such as lifestyle, learning beliefs, motivation, attitudes and most significantly perception as well as on their decision-making process including problem solving, information search, evaluation and purchase. Subsequently, customers respond to stimuli taking their black box into account, and buy the product or brand, while selecting a specific amount and payment method, or ultimately decide against the purchase (Kotler et al., 2009).
2.4 Cue Utilisation Theory
The stimulus-response theory and hence, the black box model by Kotler et al. (2009) provide a relevant starting point and interesting link to the previously mentioned cue utilisation theory.
In today's world, consumers typically judge items in the store indirectly with information that is easily available; these stimuli are commonly indicated as cues (Sullivan & Burger, 1987). It is important to comprehend how people receive and apply information about their environment in order to make purchasing decisions and correspondingly, acquire knowledge about relevant factors that affect these processes. In general, issues concerning this cue utilisation process have intrigued psychologists for almost five decades. In particular, how buyers use informational cues to perform judgement choices have aroused a great deal of interest for consumer researchers (Olson, 1978). Generally speaking, consumers want to make the right decision and to accomplish that, different cues in the environment are evaluated (Olson, 1978).
A first approach to develop a cue utilisation model was done by Cox in 1967 (Sullivan & Burger, 1987). The model consists of two values that are considered to be influential for consumers when evaluating products and that give an answer why some cues are more important than others. Predictive
value measures the consumer's belief that a certain cue is associated with an attribute (Cox, 1967 in:
Sullivan & Burger, 1987). In the research by Richardson et al. (1994), the predictive value is used to measure the capability of a cue to provide a valid indication of product quality. The second value presented by Cox (1967, in: Sullivan & Burger, 1987) is the confidence value that measures the consumer's ability to use and judge a cue correctly.
Olson and Jacoby (1972) developed this cue utilisation model further by distinguishing cues into two different categories: Intrinsic cues are physical parts of the product and cannot be changed (Olson & Jacoby, 1972; Richardson et al., 1994) such as taste, texture, aroma or ingredients of a product;
extrinsic cues are attributes that are product-related and, therefore, interchangeable, such as packaging,
price and brand (Olson & Jacoby, 1972; Richardson et al. 1994). Such cues are playing an increasingly important role in the area of consumer behaviour, and especially in terms of forming impressions about an item, such as perceived product quality (Olson & Jacoby, 1972). In turn, product quality is furthermore strongly connected to purchasing behaviour (Olson, 1978).
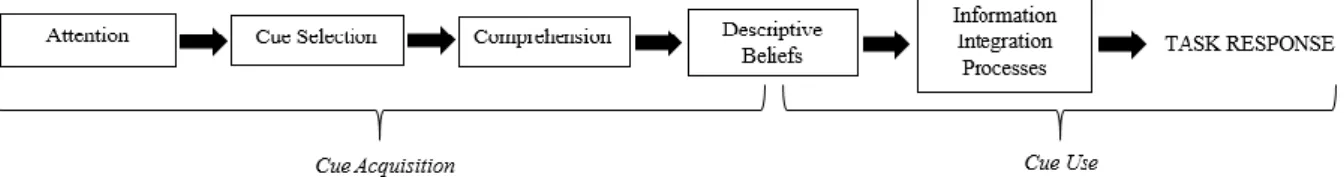
As stated by Olson (1978), the cue utilisation model includes two different processes where consumers receive cues and then, integrate the acquired information provided by those cues to form a response. This is a simplified version of what actually takes place, and Olson (1978) explains that there are a number of sub-processes occurring, which need to handle the information. The respective model combines five different steps before concluding with the respective task response (see figure 2 below).
Figure 2: Simplified model of the cue utilisation process (Adapted source: Olson & Jacoby, 1978)
The first step involved is attention where consumers pass through fairly quickly if the surrounding environment is familiar (Olson, 1978). Sullivan and Burger (1987) explain this step as the stage in which consumers are exposed to all different cues regarded as information input. As explained through the model by Olson (1978), the next step is cue selection where attributes and dimensions are selected for later evaluation. Cue selection can be described as the step when consumers choose the attributes that are perceived as most relevant to complete the task, whether it is to evaluate product quality, store loyalty or the price of an item. Comprehension is the third step and the meaning of each cue is evaluated where past experiences and already acquired knowledge affect the outcome (Olson, 1978).
The meaning of each cue is now encoded information and can then be stored as a descriptive belief, which tells consumers how much the chosen attribute is connected to the purpose of the cue evaluation. The last step is the information integration process where consumers have formed opinions regarding one or more cues. The cues are then combined or viewed separately to make the final decision (Olson, 1978). Consequently, this cue utilisation process can be considered as goal-oriented where cognitive stages are involved to receive information from the external environment and applying those in order to generate a particular behaviour (Olson, 1978), such as evaluating product quality or making purchasing decisions.
2.4.1 Quality Perception Process
The cue utilisation theory offers an appealing framework on how to evaluate consumer perceptions of private labels' quality (Richardson et al., 1994).
In general, the importance of quality for consumers, especially concerning their decision-making process, has been known for decades. Steenkamp (1990) stated that product quality is even one of the most central factors when it comes to retail competitiveness. Although Steenkamp's (1990) article was published more than 25 years ago, his proposed concepts kept their relevance, as it is a highly cited paper and, for instance, referenced by Richardson et al. (1994) and Bao et al. (2011). He developed a model that explains how consumers create perceptions about the quality of an item in buying decisions. Steenkamp (1990) proposed perceived product quality as a value judgement of consumers who process conscious and/or unconscious quality cues in relation to quality attributes. Quality cues are intrinsic and extrinsic cues that are, as described in the cue utilisation theory, acquired through attention and categorised through comprehension. This acquisition and categorisation process guides the development of descriptive beliefs which are all those beliefs occurring from direct observation. In contrast, quality attributes are either experience or credence attributes (Steenkamp, 1990), which are both considered at the point of consumption, while experience attributes exert a larger impact on the overall quality perception. Taking both factors into account, consumers integrate them, while being continuously guided by personal and situational elements (Steenkamp, 1990).
2.4.2 Prior Research on Intrinsic Cues
Previous research on store brands' intrinsic cues examined the taste, aroma, freshness and nutrition of products. In particular, taste preferences were investigated before while carrying out so-called blind and revealed taste tests, comparing performances of store brands and manufacturer brands concerning perceived quality (Omar, 1994; Richardson et al., 1994) and brand equity (De Wulf et al., 2005; Veflen Olson et al., 2011). All articles indicated similar results that manufacturer brands received higher taste preferences in the revealed test. Accordingly, as previously stated by Richardson et al. (1994), intrinsically, private labels are estimated as inferior to manufacturer brands in terms of taste
and hence, quality ingredients. However, taste preferences of store brands were overall favourable in blind tests which implied that they are able to perform the same or even better than manufacturer peers. According to that, Richardson et al.'s (1994) assumption that consumers are able to recognise the lower quality level of private brands can be consequentially refuted.
2.4.3 Prior Research on Extrinsic Cues
Greater research has been implemented towards consumers' perception of extrinsic cues of private label products since those cues are likely to have a bigger impact than intrinsic cues (Ailawadi & Keller, 2004). Examining packaging as an extrinsic cue was investigated, among other things, by Richardson et al. (1994) who found out that it influenced buyers' quality perception of private labels. With regard to differences towards manufacturer brands, the packaging and therefore, the perceived quality received lower preferences. Yet, since this research was conducted over twenty years ago, discrepancies should be marginal or non-existing today because, in recent times, retailers strive to keep feature differentiation at a minimum by “making their packaging, sizes, typeface, and labelling (of store brands) extremely similar to their respective target brands” (Choi & Coughlan, 2006, p. 80). Due to the fact that retailers started to introduce their own brands in the hope of competing with manufacturer brands for the loyalty of consumers to a large extent (Ailawadi & Keller, 2004; Richardson et al., 1994), store loyalty was a highly investigated issue. For instance, Ailawadi et al. (2008) found a significant mutual impact of private label share on various measurements of behavioural loyalty to the store. In addition, taking price positioning as another extrinsic cue into account, Gonzáles-Benito and Martos-Partal (2012) documented that the higher the price orientation of the retailer's positioning, the more beneficial is the relationship between private label consumption and store loyalty.
In terms of store image, it is established that if consumers perceive the range of different products, and especially private brands, offered by a retailer as positive, then store image receives a positive impact (Ailawadi & Keller, 2004). Furthermore, it is significantly affected by the store name and the perceived quality of private labels (Grewal, Krishnan, Baker & Borin, 1998). A subsequent conclusion, which is of utmost relevance for this thesis, is that quality perception, in turn, has a major positive influence on purchase intention (Bao et al., 2011; Grewal et al., 1998).
In order to provide further insights on this connection and thus, form a bridge to the thesis' purpose, a closer look is taken at Bao et al.'s (2011) research, which investigated the effects of three intangible extrinsic cues - store image, product signatureness and quality variation – on consumers' evaluation of store brands. A quantitative approach was applied by the use of a survey. The analysed private labels were selected from a drugstore and an electronics store. Respective measurement tools were adjusted and processed on the basis of previous literature; especially, Grewal et al. (1998) who established
image and product signatureness positively influenced the quality perception and purchase intention of private labels. In terms of quality variation, the proposed hypothesis was supported and hence, this cue exerted a negative effect on both variables. This study also concluded that quality perception significantly impacted purchase intention; in other words, consumers were more likely to buy a store brand with a higher perceived quality. In general, Bao et al. (2011) determined an implication that the product category of the private label has to be connected to the retail company; and the stronger this connection, the more favourable the perceived quality (Bao et al., 2011). This argumentation can be particularly relevant for the thesis' environment in the pharmacy market due to Apoteket AB's high involvement into its own brands. In addition, Bao et al. (2011) clearly stated the importance of quality perception when it comes to private labels, since it affects not only the market share of the brand but also the likelihood of consumers purchasing the product.
2.5 Hypotheses Development and Conceptual Framework
Relevant insights are drawn from the cue utilisation theory, while taking prior literature concerning shelf management into consideration, in order to shape the thesis' own conceptual framework.
The (in-store) stimulus or extrinsic cue investigated for this research is the in-store placement of private labels, which can be regarded as a relevant visual tool to influence customers' decision-making (Inman et al., 2009). There is little research on placement concerning store brands in the retail industry (Nogales & Suarez, 2005). To address this gap, different in-store placements are examined. In order to reveal their impact on quality perception and purchase intention, rankings of placements are compared with rankings of the universal product picture of Apoteket's private label product (see chapter three for detailed information).
In-store placements of interest are, due to results of prior literature, vertical and horizontal shelf positions. Since vertical placements are displayed on more than one shelf level (Raghubir & Valenzuela, 2008 in: Chandon et al., 2009), visibility and customers' awareness increase. Thus, vertical shelf placements strongly affect consumer behaviour (Chandon et al., 2009; Drèze et al., 1994). As a result, it is hypothesised:
H1a: A vertical shelf position receives higher rankings on quality perception of Apoteket's private label product than the universal product picture.
H1b: A vertical shelf position receives higher rankings on purchase intention of Apoteket's private label product than the universal product picture.
In terms of horizontal shelf positions, merchandise is placed on shelves next to each other to present a wide range of choices (Raghubir & Valenzuela, 2008 in: Chandon et al., 2009). Since private labels are often placed next or close to manufacturer brands in order to keep the feature differentiation
marginal (Choi & Coughlan, 2006) and hence, to target them directly (Sayman et al., 2002), it could have a favourable effect on consumer behaviour. Thus, it is hypothesised:
H2a: A horizontal shelf position receives higher rankings on quality perception of Apoteket's private label product than the universal product picture.
H2b: A horizontal shelf position receives higher rankings on purchase intention of Apoteket's private label product than the universal product picture.
Other in-store placements, which are of relevance for this thesis, are bottom-level and eye-level placements of items. It is already notably documented that products placed at eye-level capture more interest and are more likely purchased by customers than items placed at bottom-level (Chandon et al., 2009; Drèze et al., 1994; Sigurdsson et al., 2009). Correspondingly, merchandise placed at bottom level could be associated with a lower quality and products at eye level with a higher quality. Therefore, the following hypotheses are indicated:
H3a: A bottom-level shelf placement receives lower rankings on quality perception of Apoteket's
private label product than the universal product picture.
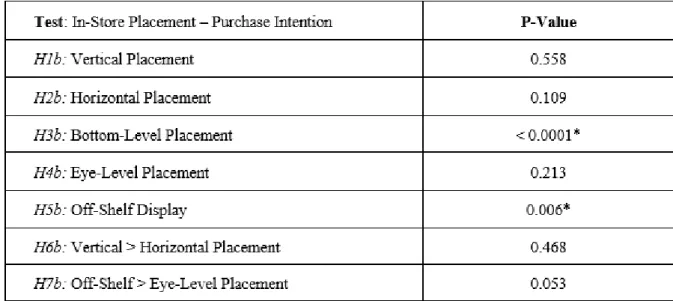
H3b: A bottom-level shelf placement receives lower rankings on purchase intention of Apoteket's private label product than the universal product picture.
H4a: An eye-level shelf placement receives higher rankings on quality perception of Apoteket's private label product than the universal product picture.
H4b: An eye-level shelf placement receives higher rankings on purchase intention of Apoteket's
private label product than the universal product picture.
As a final in-store placement possibility, so called off-shelf displays are taken into consideration. In this case, products are placed in individual, well-designed promotional booths at the entrance of the store, in aisles as slowing down bumps, or near cash registers as impulse items in order to receive more attention and hence, increase sales (Gilbert, 2003; Underhill, 2009). A positive outcome on consumer behaviour could consequently be documented. Hence, it is hypothesised:
H5a: An off-shelf display receives higher rankings on quality perception of Apoteket's private label
product than the universal product picture.
H5b: An off-shelf display receives higher rankings on purchase intention of Apoteket's private label
product than the universal product picture.
In summary, outcomes of H1 to H5 are expected due to results of prior literature and thus, can be regarded to a large extent as self-evident. However, the implementation of private labels as the
research gap requires validation of those assumptions first and hence, those hypotheses are viewed to be fundamental to investigate. Correspondingly, further implications are of greater interest since more sophisticated results for theory and practice are estimated.
In order to reveal further implications, differences between in-store placements, concerning which have a greater positive impact on quality perception and purchase intention, are explored. Regarding grocery brands, vertical shelf positions seem to have a larger effect on consumer behaviour than horizontal placements (Breugelmans et al., 2007). Thus, a similar result can be expected in terms of private labels in the pharmaceutical market:
H6a: A vertical shelf position receives higher rankings on quality perception of Apoteket's private
label product than a horizontal shelf position.
H6b: A vertical shelf position receives higher rankings on purchase intention of Apoteket's private
label product than a horizontal shelf position.
Due to the fact that off-shelf displays can be placed throughout the store while functioning as complimentary or impulse items (Underhill, 2009; Varley, 2006), customers' level of awareness and therefore, purchases of such placed products could be even larger than an eye-level item placement. As a consequence, it is hypothesised:
H7a: An off-shelf display receives higher rankings on quality perception of Apoteket's private label product than an eye-level shelf placement.
H7b: An off-shelf display receives higher rankings on purchase intention of Apoteket's private label
product than an eye-level shelf placement.
The impact of those different in-store placements is investigated on consumers' quality perception of private labels. As stated by Olsen (1978), perceived quality is of great importance due to the fact that an extrinsic cue, like in-store placement, offers a foundation for developing various impressions of the product itself. Furthermore, since it is documented that quality perception exerts a strong relationship with the actual buying behaviour (Olson, 1978), the corresponding purchase intention is the other yardstick evaluated in the thesis. Accordingly, the following hypothesis is lastly indicated:
H8: Consumers are more likely to buy a product with a higher perceived quality.
Both quality perception and purchase intention are elements of consumers' black box where quality perception is regarded as an internal influence and purchase intention as a part of the decision-making process (Kotler et al., 2009). Due to the fact that there is no determination of the actual purchase at the point of consumption, no examination of the task response is implemented in accordance with the
stimuli-response model and the simplified cue utilisation model. This is indeed practicable since the quality perception process can be divided into three sub processes (Steenkamp, 1990), where the first stage cue acquisition and categorisation fulfils the quality perception determination solely for this research's intention. In order to close the circle and provide a subsequent feedback, the relationship between quality perception and purchase intention could be conversely examined so that purchase intention exerts a possible effect on perceived quality; nevertheless, this connection will not be pursued further.
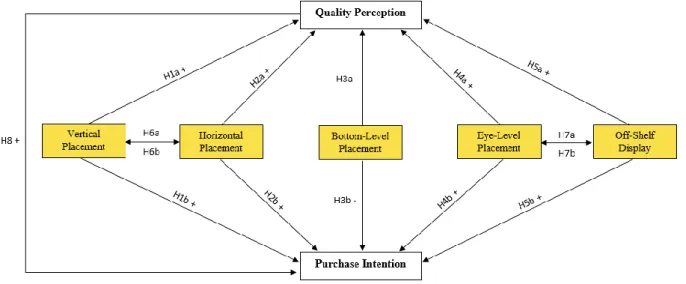
Consequently, the conceptual framework presents the proposed hypotheses and visualises the purpose of this study to investigate the impact of different in-store placements on consumers' quality perception and purchase intention of private labels (see figure 3). This was not conducted in this context before, yet implied by Bao et al. (2011) and Desrochers and Nelson (2006), as it will provide further insights on consumer perceptions regarding store brands.
Figure 3: Conceptual model - Potential effects of five different in-store placements on quality perception and
3. Methodology
In order to address the purpose of the study and thus, answering research questions how different in-store placements of a private label product affect consumers' respective quality perception and purchase intention, a quantitative approach by means of a customer survey was implemented. Yet, systematic observations were carried out first in Apoteket stores in order to demonstrate different shelf positions and displays of private labels and to emphasise the particularity of those. Subsequently, those observations facilitated the following quantitative method and built up a stronger case for the consumer perception part.
3.1 Systematic Observations
As mentioned previously, shelf management and thus, product placement is a demanding issue in which indefinite procedures are applied rather than determined theories (Drèze et al., 1994). According to Nogales and Suarez (2005), there is still a lack of academic research in that area with regard to private labels. Consequently, this issue led authors to look for starting points themselves how to obtain relevant information. As a resulting method, observations were conducted in order to collect initial data by directly observing the phenomena of interest and hence, comprehending the context of the research focus better (Nogales & Suarez, 2005). For instance, Sayman et al. (2002) tested their “game-theoretic” model in terms of positioning (in this connection, placement) strategies of store brands through observations in two leading U.S. grocery chains while observing four extrinsic cues – package design, labelling/colour, shelf placement and shelf talkers. Another case of applying observations as a research method is the work of Nogales and Suarez (2005) who directly observed the shelf space allocated by store brands while sampling food and detergent stores. They observed the number of manufacturer brands and private labels, and their respective space allocation as well as prices and promotions as further variables (Nogales & Suarez, 2005).
3.1.1 Objective and Approach
In order to obtain first-hand information of how private labels are placed in an Apoteket AB store, observations were carried out with an emphasis on evaluating prior concluded in-store placements such as vertical and horizontal, bottom-level and eye-level placements as well as off-shelf displays. The objective was to find potential differences towards available literature on the placement of grocery private labels, and to detect which Apoteket store brand of which product category could be used as the showcase product for the subsequent customer survey. In order to avoid errors between stores and to make the process more transparent and potentially repeatable, observations were systematically recorded through employing an explicitly formulated procedure and applying an observation schedule (Bryman & Bell, 2015, p. 280; Saunders, Lewis & Thornhill, 2012, p. 355), even though no
measurements were undertaken. Due to the fact that it was not evident how Sayman et al. (2002) and Nogales and Suarez (2005) implemented their observations, a new approach had to be developed with regard to in-store placement. In general, store assessments are performed in practice on a daily basis with the help of observation schedules. For instance, the Standardized Tobacco Assessment for Retail settings (STARS) is an observational tool for practitioners to instruct state and local tobacco control policies at the sales point (CounterTobacco.Org, 2016). Another practical example is the so-called NEMS-S tool, which is an observational measure to evaluate community and consumer nutrition environments in food outlets (NEMS, 2016). However, those tools are investigating far-off topics with different assessment items and are exceeding the scope of this study. Thus, although some suggestions were recorded, own observation items were constructed.
3.1.2 Observation Schedule
In line with the STARS and the NEMS-S survey, four statistical items were collected first on the observation schedule (CounterTobacco.Org, 2016; NEMS, 2016). The date of visit with the corresponding start and end times provided information about the chronology and duration of the observation, while the store address stated the location of the respective Apoteket AB store. Additionally, in order to verify the fact that permission was given to observe the store and to take pictures or not, a yes-no query was indicated.
Yet, the major part for the observation schedule about Apoteket's store brands' placements was specifically developed for this thesis. According to the prior concluded in-store positions, five tables were established in the instrument. In each table, information was gathered about all offered private labels of Apoteket: Apoteket, Apoliva, Försvarets hudsalva, Apoteket formula and c/o Recipe for men. The first row of the table stated if the specific store brand was placed in such a shelf position or display. The second row referred to the corresponding product categories that were found in those placements. Those observations were supported by the next row where comments could be noted in order to make the viewing more transparent and add relevant emphases. The last row of the table provided information about the frequency and thus, how often this specific in-store placement was applicable for a certain private label. This principle was maintained for all four different shelf positions. Yet, the table concerning off-shelf displays demonstrated a small adaption: if certain product categories were found in such a display, the row indicated supplementary if these were found near the entrance, in the centre of the Apoteket store or near cash registers. That additional information provided further insights for the respective analysis part (Underhill, 2009; Varley, 2006). As a result, the observation schedule described above can be found in appendix A.
3.1.3 Data Collection
Systematic observations, in accordance with the proposed observation schedule, were conducted on the 18th of April 2016 in the city centre of Västerås (Sweden). Two Apoteket AB stores – Apoteket
Gurkan1 and Apoteket Hjorten – were selected based on their affiliation to government owned
enterprise Apoteket AB (Euromonitor, 2016) and based on their close proximity to Mälardalens Högskola. Thus, a convenience sample (Bryman & Bell, 2015, p. 200; Saunders et al., 2012, p. 291) of merely two Apoteket stores was selected, on the one hand, in order to enhance the validity compared to only one observation, and on the other hand, because similarities in terms of store layout and product placement were expected from the start and thus, no further data collection was needed. With regard to the process, it was first asked for permission to observe the stores and take pictures. As a result, both stores were cooperative and hence, granted permit. Subsequently, different shelf positions and displays were observed considering the store layout while one observer took notes on the schedule and the other observer took pictures. As a result, each observation lasted approximately between 25 and 30 minutes.
3.1.4 Trustworthiness and Authenticity
Due to the fact that no measurements were performed, a qualitative approach of conducting observations was adopted. Therefore, based on Lincoln and Guba's proposal (1985; 1994 in: Bryman & Bell, 2015, p. 400 – 403), the criteria trustworthiness and authenticity are applied to assess those observations abstractly.
In terms of credibility, product placements can be considered as highly believable due to the fact that Apoteket AB stores were observed during daytime operations. Transferability is generally an issue for qualitative research due to the contextual uniqueness of studied individuals or settings (Bryman & Bell, 2005, p. 402). Those observations are no exception because it is almost impossible to apply findings to other contexts. Merely, findings can be generalised to a large extent to Apoteket AB stores since similarities concerning store layout and item placement were expected. With regard to dependability, observations are themselves replicable for other researchers, especially with the help of the observation schedule. Due to the fact that an extrinsic cue was observed and thus, no actual customer behaviour, discrepancies were kept to a minimum and findings can be seen as coherent. In this connection, intra-observer consistency is given (Bryman & Bell, 2015, p. 288). Solely, a prospective change in the store layout should be taken into account. In terms of confirmability, observations are characterised by the tangibility of different in-store placements and hence, not by the tendency, interest or motivation of observers. Accordingly, inter-observer consistency is a minor issue since the same two-person team conducted observations jointly (Bryman & Bell, 2015, p. 288). Beside
1 Since conducting the observation, this store closed down and on the site, another chain of Apoteket can now be
these four trustworthiness criteria, Lincoln and Guba (1985; 1994 in: Bryman & Bell, 2015, p. 403) established criteria of authenticity. Yet, since no customers and their respective behaviour were observed, no action research can be derived and thus, further evaluation criteria were insignificant.
3.2 Customer Survey
In order to operationalise the conceptual framework and thus, test the established hypotheses, a quantitative approach in the form of a survey was implemented. This approach allowed for a restructuring and reduction of the research problem to a limited number of variables (Bryman & Bell, 2015, p. 161). Due to the fact that a survey research consists of a cross-sectional design in which quantitative data is collected at a single point in time, many different variables can be compared while detecting relationships (Bryman & Bell, 2015, p. 62; Saunders et al., 2012, p. 190). According to this, consumers' quality perceptions and purchase intentions with respect to the five different in-store placements of a private label were valid as the main variables. In order to classify those variables in an effective manner, a self-completion questionnaire was selected as the research instrument.
3.2.1 Operationalisation
In order to turn research hypotheses into measurable items for the survey (Saunders et al., 2012, p. 44), findings of the conducted observations and prior literature from the theoretical framework were taken into account. As a result, the final questionnaire can be viewed in appendix B. Due to the fact that the data collection took place in Västerås (Sweden) and that the vast majority of respondents was expected to be native Swedish speakers, the questionnaire was translated into Swedish.
3.2.1.1 Approach and Choice of Private Label Product
In general, a large part of survey questions was closed “attitude questions” in order to process and compare answers more easily while simplifying the procedure for respondents and hence, receive more completed questionnaires (Bryman & Bell, 2015, p. 259). Accordingly, ordinal variables were used to order rankings between categories, drawing inferences and conclusions about the sample, (Bryman & Bell, 2015, p. 351) and hence, test proposed hypotheses with nonparametric tests at a later stage in the analysis chapter. Beneficial to respondents, 5-point and particularly 7-point Likert scales were applied to provide them with several fixed alternatives while indicating a middle point on the scale for neutral responses (Bryman & Bell, 2015, p. 165; Saunders et al., 2012, p. 436).
Survey questions were all associated with the research's case example Apoteket AB, which was indicated for respondents with an introductory sentence and its respective logo. With regard to the limited scope of the thesis and hence, to enhance comprehensibility, one of Apoteket's five private labels and correspondingly one specific private label product was selected based on observations.
During observations, the frequency of all five private labels offered by Apoteket AB was recorded relating to the five different in-store placements in order to find a store brand and product category that was strongly represented on shelves and displays. As a result, private labels Apoteket and Apoliva had most of the facings. Since observations showed that Apoliva offers mainly products in the categories of skin and body care for women only, Apoteket AB's identically named private label was chosen because it offers a much wider range of product categories including sanitary products, household goods and dietary supplements. Furthermore, the fact of having the same name could also facilitate the association without specifying the term “private label” in the questionnaire itself.
In addition, not only one private label, but also a specific product, which was offered under the Apoteket brand, was selected as the showcase product for the questionnaire. Ultimately, Apoteket AB's own sun lotion was picked due to the fact that it was, as one of few products, presented in all five in-store placements, it is a unisex product (sample can consist of male and female respondents) as well as the current seasonality (data was collected in the beginning of May) which could raise the level of awareness of sun lotion as a product universally. As a consequence, subsequent questions referred to sun lotion as a private label product of Apoteket, which was indicated with a sentence and the universal product picture on the questionnaire respectively.
3.2.1.2 Dependent Variables
In order to test hypotheses H1 to H5, it was necessary to measure consumers' quality perception and purchase intention of Apoteket's sun lotion as dependent variables in two parts: first, only based on the universal product picture and secondly, with regard to the five different in-store placements. Consequently, the application of non-parametric tests in the analysis part provided results whether certain shelf positions and displays had a suggested positive or negative impact on respondents' quality perception and purchase intention regarding Apoteket's sun lotion. Thus, question 5 measured the “universal” quality perception on a 7-point Likert scale, whilst a score of 1 stated a very low quality and 7 a very high quality – irrespective of whether respondents had bought or tried the product before. This measure was developed based on previous research such as Grewal et al. (1998) and Bao et al. (2011). In addition, question 6 evaluated the “universal” likelihood of purchasing the product on a 7-point Likert scale as well, whereby response options ranged from 1 'no, not at all' up to 7 'yes, definitely'. This measure was also adapted from Grewal et al. (1998) and Bao et al. (2011). In general, quality perception and purchase intention were measured merely on a 1-item scale. Although prior literature (Bao et al., 2011; DelVecchio, 2001; Grewal et al., 1998) applied 3 to 7-item sales respectively, the limited scope of the thesis and the irrelevance of assessing internal reliability justified the appropriate choice of a 1-item scale.
With regard to the second part, pictures were used to display the five different in-store placements while adopting the same question items and measures for consumers' quality perception and purchase intention (deduced from Bao et al., 2011; Grewal et al., 1998) through 7-item Likert scales like in
question 5 and 6. As a result, ten further questions derived subsequently, which were then able to test the remaining hypotheses H6 to H8. Even though Bao et al.'s article (2011), which provided the need and also substantial guidance for this research, evaluated their extrinsic cues through statements, “realistic” pictures were used to measure the concepts for this thesis, since conducted observations delivered impulses how private labels were displayed and shelved. Furthermore, pictures enhance the visualisation, create perceptions in respondents' minds and thus, stimulate thought (Saunders et al., 2012, p. 623) as well as increase practicality. Therefore, five blocks with each placement picture and two corresponding questions in terms of quality perception and purchase intention were established. Concerning the four different shelf positions, planograms were used for visualisation (Gilbert, 2003; Murray et al., 2010). Own presentations of planograms were set up based on item placements observed in the two Apoteket AB stores. In order to display them in the most practical way, three manufacturer brands in relation to sun lotion were illustrated as well: Vichy, Eucerin and ACO. This selection was also based on observations; yet, the placement and sequence of those in the corresponding planograms were not pursuant of a specified pattern. The bottom-level and eye-level shelf positions were presented first which occupied two of the five shelf levels. Following, vertical and horizontal shelf positions were displayed, whereby the vertical one occupied all five shelf levels and the horizontal placement only one since it was enough to show customers that different sun lotion products were placed next to each other. Beneficial for respondents, a red frame was pulled around Apoteket AB's own sun lotion in each shelf placement picture in order to add an emphasis. Finally, the off-shelf display was presented with the showcase product as the only indicator, which was also inspired by observation findings.
3.2.1.3 Independent Variables
Concerning the further structure of the questionnaire, the first two questions were initially related to demographics. For statistical reasons only, age in form of an open question and gender with three fixed alternatives – 'male', 'female' and 'prefer not to answer' – were asked. Due to the fact that demographics played no significant role for the study, no further data was necessary.
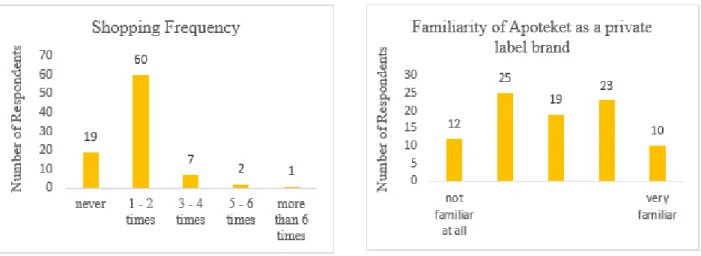
In addition, in order to receive general information about respondents' purchasing habits and their familiarity level of Apoteket as a private label brand, two closed “attitude questions” were measured by a 5-point Likert scale as independent variables (Bryman & Bell, 2015, p. 263). The first question was aimed at the shopping frequency in Apoteket stores per month, which is commonplace in survey research regarding buying behaviour (Saunders et al., 2012, p. 437). Response options ranged from 'never' up to 'more than 6 times'. The second question pointed out the familiarity of Apoteket as a private label brand itself, with possible answers ranging from 'not familiar at all' to 'very familiar'.