On a Water Supply Index: Poudre River Case Study
Robert T Milhous1Hydrologist. Torries Peak Analysis. Fort Collins, Colorado USA
Abstract. This paper explores a water supply index calculated from the present year's discharge and discharges in previous years. The paper also compares the use of a water supply index to the use of a single year as a method of classifying annual streamflows into water year classes for the purpose of allocating water to environmental flows. The third task compares the return periods of low annual flows to return periods of a low water supply index. The Cache la Poudre River in Colorado is used as a case study. The water supply index (WSI) is calculated using the equation WSI = {Q(I) + 0.5 Q(I-1) + 0.25 Q(I-2)}/1.75. The index does improve the classification of years into five classes of water years: very dry, dry, moderate dry, moderate wet, and wet. The classification using the water supply index as compared to using annual streamflows only appears to improve the ability of water manages to respond to low flow conditions. The deregulated streamflows in the Cache la Poudre River were analyzed and the 2002 year streamflows were found to have a return period of the annual discharge based on a log-Pearson Type III analysis of 426 years. For the water supply index the return period is 403 years. A long period record has been generated by NOAA using tree rings for 1615-1999. Using a long period record based on tree ring analysis (1615-1999) and deregulated streamflows (2000-2009) the return period for the annual discharge in 2002 is 58 years and 186 years for the water supply index.
1. Introduction
A water supply index is presented herein. The index is calculated from the discharge in the present year and discharges in previous years. The case study approach is employed with the Cache la Poudre River in Colorado used as the case. The Cache la Poudre is normally called the Poudre River. The Poudre River is being used as a test case for the use of a water supply index - this paper is not making a proposal for a change in water management or for allocation of water to environmental flows.
1.1. Objectives
The general objective is to present a case study of the properties and use of an index to water supply that reflects the past annual streamflows as well as the streamflow in the current year. Alternatives to a water supply index are autocorrelation and an analysis of the accumulative deviations from mean annual discharge. Three specific objectives are:
1) Present a water supply index calculated from the discharge in the present period, and discharges in previous periods. In this paper the period is a water year. 2) Compare the use of a water supply index to the use of a single year as a method of
classifying annual streamflows into water year classes. The water year classes have been used in the allocation of water to environmental flow uses.
3) Compare the return periods of low annual flows to return periods of a low water supply index. Water year 2002 will be used as an example in the comparison.
1 Retired U.S. Geological Survey. 1812 Marlborough Court. Fort Collins, Colorado 80526 email: r.milhous@att.net
1.2. Water Supply Index
The equation for the Water Supply Index presented in this paper is the following:
WSI(i)= Q(i− k + 1)F(k) k=1 n
∑
F(k) k=1 n∑
where Q( ) is the discharge and F( ) is a weighting function. In the work present herein n is 3 and F(k) is 1.0, 0.5, and 0.25. The dimension of WSI(i) is the same as the dimension of Q(i). The number of years, n, and the weighting function should be selected based on the characteristics of the watershed and the amount of carryover storage in the basin or available from inter-basin transfer. WSI(i) is the index for year i.
The conceptual basis is that a water resources system - including environmental uses - not only responds to what happens in a specific year but also to events over a number of years. For example reservoir storage, groundwater storage, and soil moisture storage will fill water shortages over one year but the ability to make up for shortages decreases as shortages persist and the water stored in reservoirs, groundwater and soil moisture decreases. For environmental flow uses – a year class of fish may be reduced by shortages but that a series of shortages may be catastrophic. Long lived fish can have longer periods of shortages than short lived fish. The human economic and social system can handle a one year shortage because of the community’s resources, but if the shortage persists there can be serious economic and social problems. This paper will concentrate on low flows but the same concepts apply to the higher flows.
1.3 Water year classes
Water year classes, as used in this paper, segregate annual streamflows or water supply indices on the basis of the magnitude of the discharge or index. The concept of using year class to allocate water to environmental flow uses has developed over the years as a way of sharing the risk of water shortages when the flows are low and have higher flows during wet years to maintain the channel and aquatic health; and to have good conditions for fish reproduction.
An example of the link between the expected annual discharge (as a frequency of occurrence) and the allocation of water to environmental flows is shown in Table 1. The volume has a set of rules for release during the year. The volume is fixed but the distribution during the year can be modified.
Table 1. Water allocation in the Trinity River, California based on the water year type. The
frequency of occurrence is for the inflows to the project (Clair Engle Lake). The information in the table is from Trinity River Restoration Program web site accessed 28 January 2010.
Water year type Frequency of occurrence Volume (ac-ft) Peak Release (cfs) Critically dry 12% 369,000 1,500 Dry 28% 453,000 4,500 Normal 20% 647,000 6,000 Wet 28% 701,000 8,500 Extremely wet 12% 815,000 11,000
The purposes of the environmental flows allocated to the Trinity River are described in the following paragraph from the Trinity River Record of Decision (ROD, 2002):
The total volume of water released from the Trinity River Division to the Trinity River will range from approximately 369,000 af to 815,000 af, depending on the annual hydrology (water-year type) determined as of April 1st of each year The recommended flow regimes link two essential purposes deemed necessary to restore and maintain the Trinity River’s fishery resources: 1) flows to provide physical fish habitat (i.e., appropriate depths and velocities, and suitable temperature regimes for anadromous salmonids), and 2) flows to restore the riverine processes that create and maintain the structural integrity and spatial complexity of the fish habitats.
1.4. Compare the return periods
The third objective is to compare the return periods of the deregulated annual discharge for 2002 and the calculated water supply index for 2002. The purpose is to determine if the water supply index gives additional insight into the severity of low flow periods. Two procedures will be used: 1) a duration relation made by plotting the data and 2) a log-Pearson Type III analysis.
The first technique is graphical using a duration relation. The Hazen equation (Linsley et al, 1949) is used to calculate the plotting location on a duration relation for an event. The plotting position for an event is the return period, Tp calculated using the equation:
Tp = n m− 0.5
where n is the number of years in the record, m is the serial number of an observations when the observations are arranged in decreasing order of magnitude. The percent exceedence, E, is calculated by inverting the return period, Tp, and multiplying by 100
The second technique is a log-Pearson Type III analysis using data skew. The equation for calculating the log of the discharge or water supply index is
logQ= M + K ⋅ S
where Q is either the discharge or the water supply index, M is the average of the logarithms of the discharge or water supply index, S is the standard deviation, and K is based on the data skew and the frequency. Tables in Bulletin 17B (Interagency Advisory Committee on Water Data, 1982) are then used to determine the value of K for a selected frequency. The next goal is to calculate the frequency of the discharge and water supply index of know for a given discharge. The value of K for any given discharge or water supply index is calculated using the equation:
K = logQ− M S
Tables in Bulletin 17B (Interagency Advisory Committee on Water Data, 1982) are then used to determine the frequency using the known value K and the value of the data skew.
2. Platte Basin Precipitation
The annual precipitation in the Platte River basin was used to selected years to look at in more detail in the in the application of the water supply index. The precipitation data is for the NOAA Platte River Basin, Colorado Climate Division and was obtained from the Western Regional Climate Center (2010). The Annual (water year) precipitation is presented in Figure 1. There are 113 years of data for the annual water year precipitation in the division and 111 years in the water supply index time series. The solid line shows the precipitation for water year 2002 and demonstrates that for precipitation in the Colorado part of the Platte River basin the precipitation in 2002 was not the lowest in the 113 years of record. The basin average precipitation was 10.3 inches in 2002; the two years with lower precipitation were 1939 (9.89 inches) and 1954 (10.09 inches). One year had almost the same as in 2002 and that was 1964 with a water year total of 10.65 inches. These four years will be used as examples in the presentation and discussion of the water supply index.
Figure 1. Annual precipitation in the Platte River Basin, Colorado. A water year is 1 October - 30
September. The solid line is at the precipitation for water year 2002. The average precipitation for 1896-2009 is 16.25 inches. The median precipitation is 16.47 inches.
3. Poudre River Case Study
The results from the Poudre River case study are present in this section. The results will be discussed in the discussion section.
The desired streamflows to use in an analysis of the classes of streamflows and the frequency of low water supply are the natural flows. Unfortunately, we do not have natural flows; what we do have are measurements of discharge that have been adjusted to remove the impact of reservoir storage, diversions, and additions to the river resulting from diversions to the Poudre watershed from adjacent basins to give the best estimate of the natural flow possible. In this paper these estimates of natural flows will be called deregulated flows. The measured streamflows can not be used because the pattern of diversions, storage and accretions has changed at random and significantly over the years. The deregulated annual streamflows are presented in Figure 2 for the gaging station at the
mouth of Poudre Canyon. This gaging station has the longest record in the watershed and is just above that lower watershed where the demand for water is the highest. The water supply index was calculated for each year except for the first two years and is presented in Figure 3.
Figure 2. Deregulated annual discharge in the Poudre River at the mouth of Poudre Canyon. The period of
record is from 1884 - 2009. The line on the diagram is the discharge equal or exceeded by 90 percent of the years.
Figure 3. Water Supply Index calculated using deregulated streamflows for the Poudre River at the mouth
of Poudre Canyon. The period of record is from 1884 - 2009. The line on the diagram is the water supply index equal or exceeded by 90 percent of the years.
3.1 Water Year Class
The water year classes used in this paper for the Poudre River at the canyon mouth are given in Table 2. The preferred approach to defining water year classes for purposes of allocation of water to environmental flows is to do an analysis of the biological system of
the stream. This was not done for this paper; what was done was to use the concepts of the ‘natural flow paradigm’ (Richter et al, 1996). The use of the 25% and 75% limits on normal-dry and normal-wet are directly from Richter et al (2003), The division of the dry 25% into a dry and very dry was based more-or-less on a break in the slope of the duration relations presented in Figure 4 at about 90%.
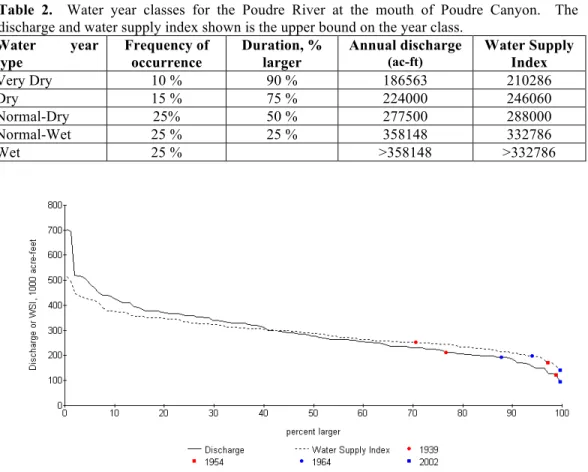
Table 2. Water year classes for the Poudre River at the mouth of Poudre Canyon. The
discharge and water supply index shown is the upper bound on the year class.
Water year type Frequency of occurrence Duration, % larger Annual discharge (ac-ft) Water Supply Index Very Dry 10 % 90 % 186563 210286 Dry 15 % 75 % 224000 246060 Normal-Dry 25% 50 % 277500 288000 Normal-Wet 25 % 25 % 358148 332786 Wet 25 % >358148 >332786
Figure 4. Duration relations for deregulated annual streamflow and for the water supply index for the
Poudre River at the mouth of Poudre Canyon.
Using the criteria in Table 2 and the data in Figure 4, the water year classes were determined for each of the four years (1939, 1954, 1964, and 2002) and the following years until either the discharge or water supply index water year class is not ‘very dry’ (with a minimum of two years). The results for 1939, 1954, and 1964 are presented in Table 3.
The water year classes for the 2002 low flow period are presented in Table 4. The first year shown (1999) is the last year before either the discharge or water supply index is dry or very dry and the table ends with both the discharge and water supply index being in the normal range.
Table 3. Water year class determined from the annual duration relation compared to the water
year class determined from the water supply index starting with the low precipitation years and ending when both the discharge and water supply index are both above very dry.
Water Year Annual Discharge Water Supply Index
1939 dry normal-dry
1940 very dry very dry
1941 dry dry
1954 very dry very dry
1955 very dry very dry
1956 normal-dry very dry
1957 wet wet
1964 dry very dry
1965 normal-wet normal-dry
1966 very dry very dry
1967 normal-dry dry
Table 4. Water year classes for the annual deregulated discharge and the water supply index
during 1999 - 2009
Water Year Annual Discharge Water Supply Index
1999 wet wet
2000 dry normal-dry
2001 dry dry
2002 very dry very dry
2003 normal-wet dry
2004 very dry very dry
2005 normal-dry dry
2006 very dry Very dry
2007 normal-dry dry
2008 normal-dry dry
2009 normal-dry normal-dry
3.2 Frequency of 2002 Low Flow Event 3.2.1 Deregulated Annual Streamflows
A log-Pearson Type III analysis of the deregulated annual streamflows data was made with the goal of calculating the frequency of the 2002 low flow event.
Table 5. Log-Pearson Type III parameters calculated using the deregulated record of annual
stream flows. The units of the calculation are 1000 acre-feet.
Parameter Annual Discharge Water Supply Index
Average of logs: 2.444 2.453
Standard Deviation: 0.153 0.102
Data Skew: -0.153 -0.149
Coefficient of Variation: 0.063 0.042
Number of Years: 126 124
The goal at this point is to calculate the frequency of the discharge and water supply index for the observed values for 2002. The value of K for any given discharge or water
supply index is calculated using the equation present in the introduction. The determination of the frequency is a table look-up using tables in Bulletin 17B.
The return period of the annual discharge in 2002 based on a log-Pearson Type III analysis is 426 years, the plotting position (Figure 4) is at a return period of 252 years. For the water supply index the return period is 403 years with a plotting position of 248 years.
3.2.2 Record extended by tree ring analysis
Woodhouse, et al (2004) reconstructed streamflows in the Poudre watershed using tree-ring chronologies. The reconstructed stream flows for the Poudre River cover the years 1615-1999. The process of reconstruction is described in Woodhouse and Lukas (2006). The deregulated data from 2000-2009 have been combined with the tree-ring chronologies
to make an annual stream flow series of 395 years (1615-2009). A review of the relation between the deregulated discharge and the tree ring discharge indicated the tree ring reconstructions underestimate the streamflows for the larger annual stream flows but appear to estimate the lower flows reasonably well. Woodhouse and Lukas (2006) say “The reconstruction models explain 63–76% of the variance in the gage records and capture low flows particularly well.” Woodhouse and Lukas (2006) also say “Analyses of the reconstructions indicate that the 20th century gage record does not fully represent the range of streamflow characteristics seen in the prior two to five centuries”.
The log-person Type III analysis yielded the results in Table 5 for the extended record. The return period for the annual discharge is 58 years and 186 years for the water supply index. The return periods determined from the graphical duration analysis was 46 years for the 2002 discharge alone and 157 years based on a water supply index that included the previous two years. These results compared to the results from the deregulated gaging record underscores the conclusion of Woodhouse and Lukas (2006) that the measured record does not fully represent the potential range in stream flows.
Table 6. Log-Pearson Type III parameters calculated using the extended record of annual
stream flows. The units of the calculation are 1000 acre-feet.
Parameter Annual Discharge Water Supply Index
Average of Logs: 2.426 2.442 Standard Deviation: 0.159 0.092 Data Skew: -1.188 -0.720 Coefficient of Variation: 0.065 0.038 Number of Years: 395 393
4. Discussion
The frequency of the 2002 low flow year discharge and water supply index are first discussed followed by a discussion the use of the water supply index.
One of the objectives was to look at the frequency of the 2000 thru 2009 low flow period on the Poudre River. Only the frequency of the lowest of the annual deregulated discharges and the water supply index are considered.
The frequency of the 2002 low flow year was calculated using a log-Pearson Type III analysis of both the deregulated streamflows and the water supply index. The return period was found to be 426 years on average for the single year and 403 years on average for the water supply index. Salas et al (2005) concluded ‘the severity of the 3-year (2000– 2002) drought……is of the order of a 1,000-year return period…’ In most watersheds we
do not have an extended record and must use the measured record which is often significantly than the record available for the Poudre River. The Salas et al (2005) analysis was a much more complete analysis than the log-Pearson Type III analysis presented in this paper because their analysis considered alternative time-series of streamflows. Never-the-less, both analyses indicate the 2002 was a rather infrequent event.
The analysis of the extended record, however, told a different story. The frequency of the single year low flow event was found to be much more frequent (1 in 58 years on average) compared to the measured period (1 in 426 years on average). The water supply index based on the extended period is less frequent (1 in 186 years) than the annual event which suggests the water allocation process may need to consider both the present year some type of index to previous years that reflects the conditions in the proceeding years. A paper by Milly et al (2008) has a title starting with ‘Stationarity Is Dead…’ and essentially says we can no longer predict the future from past observations because of climate change. This means we should not assume what have been infrequent events in the past will be infrequent in the future.
In this discussion normal is ± 25 percent from the median. It is also assumed less water is allocated to environmental flow uses as either the discharge or water supply index become drier. Each of the three periods in Table 3 is discussed now.
The water supply index was normal-dry range (1938 was almost a wet year) but the annual discharge was dry; 1939 is an example where the index would allocate more water to environmental flows than a single year annual discharge. During the period 1954-1957 the water supply index would have allowed reduced environmental flows in 1956 compared to the single year discharge which would allow other water users to recover from the two very dry years. The period 1964 - 1967 is a period where the use of a water supply index would allocate more water to other uses and less to environmental uses than would an allocation using only the current year.
Looking at Table 4, using the ± 25 percent deviation as the range of normal and both dry and very dry water year classes as a low flow period, the annual discharge bounced back and forth from low to normal starting with a low flow year in 2000 until the end of the record in 2009 with three of the ten years being very dry and six being normal. In contrast, the water supply index started a low water supply period in 2001 and did not end the low water supply period until 2009. Using the water supply index as the parameter to allocate water to environmental flows and assuming the allocation decreases from normal thru very dry classes for both the discharge and the water supply, less water would be allocated to environmental flows than would have been done using year classes based on the discharge. Using the water supply index would give other water users time to recover from the low flow years. There is a problem. Depending on the species of aquatic animals of interest, the long period of low allocations of water to environmental flows may not be good for the long term health of the aquatic system. This means the allocation process based on either annual discharge or water supply water year class may need to adjust the rules for water allocation during periods of long runs of low flows in order to maintain a healthy aquatic system.
5. Conclusions
The conclusion of the investigation of the possibility of using a water supply index in the allocation of water to environmental uses is that index may help water resource
systems recover from low flow periods. But two considerations are important. The first is that the current water should be considered alone and not just as part of the water supply index. The second is that runs in dry to very dry periods may need water to be allocated to environmental flow needs to preserve the health of the ecosystem that are more than the allocation indicated by the water year class.
6. Acknowledgements
Thanks to Donnie Dustin of the Fort Collins Utilities for supplying the deregulated annual streamflow data for the Poudre River.
7. References.
Interagency Advisory Committee on Water Data, 1982: Guidelines for Determining Flood Flow Frequency. Bulletin 17B of the Hydrology Subcommittee. Published by the Office of Water Data Coordination, US Geological Survey. Reston, Virginia. 194 pages.
Linsley, R.K., M.A. Kohler, and J.L. Paulhus, 1949: Applied Hydrology. McGraw-Hill Book Company. 689 pages.
Milly, P C D., Julio Betancourt, Malin Falkenmark, Robert M. Hirsch, Zbigniew W. Kundzewicz, Dennis P. Lettenmaier, Ronald J. Stouffer, 2008: Stationarity Is Dead: Whither Water Management? Science Vol. 319 1 February 2008. Pages 573-574.
Richter, B.D., J.V. Baumgartner, J. Powell, and D.P. Braun, 1996: A method for assessing hydrologic alteration within ecosystems. Conservation Biology, 10:1163-1174.
Richter, Brian D., Mathews, Ruth, Harrison, David L, and Wigington, Robert, 2003: Ecologically Sustainable Water Management: Managing River Flows for Ecological Integrity. Ecological Applications, 13(1), 2003, pp. 206–224
ROD, 2000: U.S. Department of the Interior. Record of Decision. Trinity River Mainstem Fishery Restoration. Final Environmental Impact Statement/Environmental Impact Report. December 19, 2000. Downloaded from http://www.trrp.net on 22 January 2010.
Salas, Jose D.; Chongjin Fu; Antonino Cancelliere; Dony Dustin; Dennis Bode; Andy Pineda; and Esther
Vincent, 2005: Characterizing the Severity and Risk of Drought in the Poudre River, Colorado. Journal
of Water Resources Planning and Management, Vol. 131, No. 5, September 1, 2005. Pages 383-393. ISSN 0733- 9496/2005/5-383–393/$25.00.
Western Regional Climate Center, 2010: Divisional Plot Data for South Platte Division, Colorado. Accessed from http://www.wrcc.dri.edu on 24 January 2010.
Woodhouse, C.A., R. Webb, J.J. Lukas, 2004: TreeFlow Colorado Streamflow Reconstructions. IGBP PAGES/World Data Center for Paleoclimatology Data Contribution Series # 2004-029. NOAA/NGDC Paleoclimatology Program, Boulder CO, USA. http://www.ncdc.noaa.gov/paleo/streamflow/index.html. Accessed 15 January 2010.
Woodhouse, C.A., and J.J. Lukas, 2006: Multi-Century Tree-Ring Reconstructions of Colorado Streamflow for Water Resource Planning. Climatic Change. Volume 78, Numbers 2-4/October, 2006. DOI 10.1007/s10584-006-9055-0. Pages 293-315