A New Insight into Data Requirements
Between Discrete Event Simulation and
Industry 4.0
- A simulation-based case study in the automotive
industry supporting operational decisions
Master thesis
30 credits, Advanced level
Product and Process Development Production and Logistics ManagementAfroz Mirzaie Shra
2018
Report code: PPU503
Commissioned by: Scania CV AB, Södertälje Tutor (company): Erik Åström
Tutor (university): Erik Flores Examiner: Antti Salonen
Akademin för Innovation, Design och Teknik
ABSTRACT
Current industrial companies are highly pressured by growing competitiveness and globalization, while striving for increased production effectiveness. Meanwhile, flustered markets and amplified customer demands are causing manufacturers to shift strategy. Hence, international companies are challenged to pursue changes, in order to continue being competitive on global markets. Consequently, a new industrial revolution has taken place, introduced as Industry 4.0. This new concept incorporates organizational improvement and digitalization of current information and data flows. Accomplished by data from embedded systems through connected machines, devices and humans into a combined interface. Thus, companies are given possibilities to improve current production systems, simultaneously saving operational costs and minimizing insufficient production development.
Smart Factories, being the foundation of Industry 4.0 results in making more accurate and precise operational decisions from abilities to test industrial changes in a virtual world before real-life implementation. However, in order to assure these functions as intended, enormous amount of data must be collected, analysed and evaluated. The indicated data will aid companies to make more self-aware and automated decisions, resulting in increased effectiveness in production. Thus, the concept will clearly change how operational decisions are made today. Nowadays, Discrete Event Simulation is a commonly applied tool founded on specific data requirements as operational changes can be tested in virtual settings. Accordingly, it is believed that simulation can aid companies that are striving for implementing Industry 4.0. As a result, data requirements between Discrete Event Simulation and Industry 4.0 needs to be established, while detecting the current data gap in operational context. Hence, the purpose of this thesis is to analyse the data requirements of Discrete Event Simulation and Industry 4.0 for improving operational decisions of production systems. In order to justify the purpose, the following research questions has been stated:
RQ1: What are the data challenges in existing production systems?
RQ2: What data is required for implementing Industry 4.0 in production systems?
RQ3: How can data requirements from Discrete Event Simulation benefit operational decisions when implementing Industry 4.0?
The research questions were answered by conducting a case study, in collaboration with Scania CV AB. The case study performed observations, interviews and other relevant data collection to accomplish the purpose. In parallel, a literature review focusing on data requirements for operational decisions was compared to the empirical findings. The analysis identified the current data gap in existing production systems, in correlation to Industry 4.0, affecting the accuracy of operational decisions. In addition, it was shown that simulation can undoubtedly give positive outcome for adaptation of Industry 4.0, and a clear insight on data requirements.
Keywords: Data Requirements, Discrete Event Simulation, Industry 4.0, Operational
ACKNOWLEDGEMENTS
The following report has been conducted at Scania CV AB in Södertälje, Sweden. Resulting in 30 credits for the final examination of the Master’s Programme within Production and Logistics at Mälardalens University.
Firstly, I am tremendously thankful for being given the opportunity to conduct this project at Scania. The project has given me a great change to test and challenge my theoretical knowledge in a practical context from 4,5 years spent at the university. Special thanks are given to everyone at the company for welcoming me, along with participating in interviews, meetings or observations. The contribution has been extremely valuable. My deepest gratitude goes to my tutor at Scania, Erik Åström for giving me the opportunity to conduct this project while providing helpful insight and feedback. Likewise, I would like to express my appreciation to Mattias Dahlqvist for your deep commitment and dedication through your spent time and resources. Your daily assistance and expertise within production technology at Scania ensured the purpose was achieved, along with accurate and high-quality results.
Secondly, I have been very fortunate to have Erik Flores as my university tutor. I am endlessly grateful for your guidance, constructive advice and spent time. Your time has resulted in higher quality on the report. Yet, I am mostly grateful for the continuous motivation during my ups and downs.
Thirdly, I would like to thank my friends and family for their unconditional love and encouragement throughout this time.
Eskilstuna, January 2019
_________________________
Afroz Mirzaie ShraContents
1. INTRODUCTION ... 1
1.1 Background ... 1
1.2 Problem formulation ... 2
1.3 Aim and Research Questions... 2
1.4 Thesis Scope and Limitations ... 3
1.5 Thesis Outline ... 3
2. RESEARCH METHOD ... 4
2.1 Research Process and Design ... 4
2.1.1 Case study ... 5 2.2 Data Collection ... 7 2.2.1 Literature review ... 8 2.2.2 Simulation ... 11 2.2.3 Interviews ... 13 2.2.4 Observations ... 15 2.3 Data analysis ... 16
2.4 Reliability and Validity ... 17
3 FRAME OF REFERENCE ... 20
3.1 Production System Development ... 20
3.2 Introducing the concept of data ... 21
3.3 Operational decisions and importance of data ... 23
3.3.1 Data systems ... 24
3.3.2 Data requirements in current production systems ... 26
3.4 Discrete Event Simulation ... 27
3.4.1 Data requirements and the value of data ... 28
3.5 Industry 4.0 ... 31
3.5.1 Definition ... 31
3.5.2 The importance of data ... 32
3.5.3 Data requirements for Industry 4.0 ... 34
3.6 Combining DES and Industry 4.0 ... 36
4 EMPIRICAL FINDINGS ... 39
4.1 Introduction to case company ... 39
4.2 Introduction to case study ... 40
4.3 Case study outline ... 42
4.4 Current state of the production line ... 43
4.4.2 Process description ... 44
4.4.3 Production performance ... 47
4.4.4 Identification of weaknesses related to production performance ... 49
4.5 Production System Development and the value of data ... 51
4.5.1 Manufacturing systems for production data ... 51
4.5.2 Current way of working ... 52
4.5.3 Importance of data and data requirements ... 53
4.5.4 Operational decisions ... 55
4.6 Attitude towards Industry 4.0 ... 58
4.7 Discrete Event Simulation Project ... 62
4.7.1 Summarization on data collection ... 62
4.7.2 Non-value added events ... 63
4.8 Conceptual model ... 67
4.9 Simulation results and experiments ... 68
4.9.1 Creating models ... 68
4.9.2 Simulation results and improvement areas ... 72
4.10 Summary on simulation results ... 75
5. ANALYSIS AND DISCUSSION ... 77
5.1 Current data challenges in existing production systems ... 77
5.2 Importance of data in Industry 4.0 supporting operational decisions ... 82
5.3 Potential benefits of applying DES when implementing Industry 4.0 ... 87
6. CONCLUSIONS AND RECOMMENDATIONS ... 93
6.1 Conclusions ... 93
6.2 Further work and recommendations ... 94
7. REFERENCES ... 96
8. APPENDICES ... 106
List of Figures
Figure 1 - Research process ... 5Figure 2 - Simulation steps according to Banks, et al. (2005) ... 13
Figure 3 - The research area and focus... 20
Figure 4 - Decision formation of information and data (Liew, 2007) ... 22
Figure 5 - Current and future view on data systems for operational decisions (Liew, 2007) .. 25
Figure 6 - Data requirements (Jonsson & Mattson, 2011) ... 27
Figure 8 - Comparison between tradition and Industry 4.0 factory (Turner, et al., 2016)
(Edited) ... 37
Figure 9 - Scania Production System ... 40
Figure 10 - Project outcome from case study ... 42
Figure 11 - Case study methodology ... 43
Figure 12 - Engine block (Nordström, 2010) ... 44
Figure 13 - Process steps ... 44
Figure 14 - Production layout on rough machining ... 45
Figure 15 - Production layout on fine machining... 46
Figure 16 - Stakeholders involved in case study ... 49
Figure 17 - Data-related issues ... 55
Figure 18 - Maturity-model for implementing Industry 4.0 ... 59
Figure 19 - Handling data from DIDRIK ... 66
Figure 20 - Simplified simulation highlighting Operation 1 ... 69
Figure 21 - Detailed simulation Operation 1 ... 69
Figure 22 - Simulation example on control stations and conveyors ... 70
Figure 23 - Detailed model on Operation 14 and 15 ... 72
Figure 24 - Suggested improvement areas from simulation ... 76
Figure 25 - Vertical integration of DES in maturity-model ... 91
Figure 26 - Summarization on research findings ... 92
List of Tables
Table 1 - Summarization on data collection ... 8Table 2 - Research topics within Industry 4.0 between year 2016 to 2018 ... 9
Table 3 - Categorization of reviewed literature ... 11
Table 4 - Performed interviews ... 15
Table 5 - Conducted observations ... 16
Table 6 - Summarization on procedures for achieving reliability and validity ... 19
Table 7 - Data requirements for DES ... 29
Table 8 - Data requirements for Industry 4.0 ... 36
Table 9 - Production performance ... 47
Table 10 - Production times ... 48
Table 12 - Data systems at case company ... 51
Table 13 - Current data requirements during production system development ... 53
Table 14 - DES input data when simulating new production lines ... 57
Table 15 - Tested techologies from Industry 4.0 at case company ... 60
Table 16 - Data requirements for implementing Industry 4.0 ... 61
Table 17 - Example on registering disturbances ... 63
Table 18 - Example on disturbance categorisation ... 64
Table 19 - Example on unsorted disturbance analysis ... 65
Table 20 - Example on sorted disturbance analysis ... 65
Table 21 - Pareto chart on disturbances ... 65
Table 22 - Simulation Setup ... 68
Table 23 - Comparison on machine utilization between DES study and case company ... 71
Table 24 - Parameters experimented in simulation models ... 73
Table 25 - Scenario matrix focused on CT reduction ... 74
Table 26 - Scenario matrix focused on disturbance breakdowns ... 75
List of Figures in Appendices
Appendix 1 – Conceptual model...114ABBREVIATIONS
Abbreviation Description
BD Big Data
CPS Cyber Physical System
CT Cycle time
DES Discrete Event Simulation
DIDRIK SCADA – system at case company ERP Enterprise Resource Planning FIFO First in First Out
ID Identification IoT Internet of Things KPI Key Performance Index
MES Manufacturing Execution System OEE Overall Equipment Efficiency OPE Overall Process Efficiency PSD Production System Development PUS ERP – system at case company SCADA Supervisory Control and Data
Acquisition
SPS Scania Production System TPS Toyota Production System TBF Time Between Failure TTR Time to Repair
1 1. INTRODUCTION
This chapter describes the background and research topic, followed by the problem formulation. Leading to the thesis aim and research questions. The chapter concludes with thesis scope, limitations and outline of the report.
1.1 Background
Current studies show high expectations about emerging technologies including digitalizing operational environments and advanced tools, related to the concept of Industry 4.0 (Stăncioiu, 2017; Sachdeva, et al., 2017). However, existing data deficiencies at manufacturing firms threaten this vision (Turner, et al., 2016; Uriarte, et al., 2018). The concept of Industry 4.0 originates as a response to changing market demands, focusing on: customization, delivery-on-time, increased quality and special products and processes (Sjödin, et al., 2018; Adamson, et al., 2017; Müller, et al., 2018). Meaning that current firms are challenged by standardized manufacturing and increased product complexity, when wanting to develop production systems (Turner, et al., 2016). Additionally, Jain et al. (2016) and Skoogh & Johansson (2008) demonstrate that present production systems struggle with equipment breakdowns, delays in queuing, reprocessing and the human factor.
Thus, Industry 4.0 aims at increasing the efficiency of manufacturing companies through digitalized products and processes, tackling these communicated challenges stated from current production systems (Kamble, et al., 2018). Consequently, Industry 4.0 will improve the traceability, optimization of existing production systems and accelerated communication between humans and machines at factories (Ferro, et al., 2017). Indicating that Industry 4.0 will optimize human-, and machining performance, to a degree where the physical and digital setting can coincide (Shao, et al., 2014). Consequently, data is essential to achieve the benefits of Industry 4.0, whereas the importance of data within current production systems for making optimal operational decisions is suggested by Jonsson & Mattson (2003), Schnieder (2018) and Bruch & Bellgran (2014). Therefore, academics foresee a transformation in the generation, communication transfer and use of data in factories (Sjödin, et al., 2018; Kamble, et al., 2018; Turner, et al., 2016; Müller, et al., 2018).
However, many current tools that have long been adopted by manufacturing companies may benefit the transition of traditional production systems to an Industry 4.0 environment (Ferro, et al., 2017; Bokrantz, et al., 2018; Kibira & Shao, 2017). One such tool is Discrete Event Simulation (DES) (Uriarte, et al., 2018; Turner, et al., 2016; Bokrantz, et al., 2018). According to Robinson (2005), Turner et al. (2016), Sjödin et al. (2018) and Jain et al. (2016), DES allows the decision-maker to gain significant insight on production, through generated data from factory floors. Furthermore, DES is currently a valuable tool for mapping processes and analysing data for developing production systems (Skoogh, et al., 2012), while minimizing scrap rates, lead times and production costs (Law, et al., 2014; Banks, et al., 2010). In addition, data provided from DES can contribute with information for understanding bottlenecks and waste in production (Atieh, et al., 2016). Thus, DES provides the ability to examine operational changes in a virtual world, without interfering real-life production (Uriarte, et al., 2018). Accordingly, the linkage between DES and Industry 4.0 is worthwhile considering. Yet despite of what is known, there remains much to understand.
2
1.2 Problem formulation
Regardless of the many solutions Industry 4.0 brings, the concept concludes in a new setting of challenges that current manufacturers are not prepared for (Sjödin, et al., 2018). The critical issue companies are facing when implementing Industry 4.0, is the importance of data compared to present production systems (Turner, et al., 2016; Sjödin, et al., 2018). Essentially, manufacturing companies must transform the current understanding of data and its requirements. Since the main core within Industry 4.0 is data-based networks as Smart Factories, new business models will emerge hence changing organizational structures (Sjödin, et al., 2018). However, this data will be generated from processes, products and services as companies will have a new perspective on data management, digitalization and data transparency. At the same time, the vision is far from current reality (Uriarte, et al., 2018; Sjödin, et al., 2018; Müller, et al., 2018). Where research claim, by possessing the correct data requirements, optimal decisions can be made (Frishammar, et al., 2013). Yet, companies encounter difficulties to manage and transform the data to make accurate decisions (Jonsson & Mattson, 2003).
These difficulties with data management is not only regarded conventional databases, but also acquisition, storage, evaluation and handling of great amount of data (Zhou, et al., 2015). Having trustworthy and up-to-date data is vital, since decisions based on deficient and mishandled data results in complicating development of production systems. On the other hand, research has shown that current operational decision-makers are not ready for data-based decisions, as managers rely more preferably on hunches or experience (McAfee & Brynjolfsson, 2012; Uriarte, et al., 2018; Kamble, et al., 2018). Consequently, manufacturing companies are not prepared to identify necessary data, its use and acquisition (McAfee & Brynjolfsson, 2012). Three issues highlight this problem. First, the novelty of this problem and the lack of studies guiding manufacturing companies towards data requirements in Industry 4.0. Second, current data issues reported in DES literature. Third, the low ability of data in modern factories floors necessary for the DES models (Sjödin, et al., 2018; Kamble, et al., 2018; Skoogh, & Johansson, 2008).
Consequently, investigating the overlap between DES and Industry 4.0 is important, considering academics have shown that this will become an essential issue for production systems.
1.3 Aim and Research Questions
The purpose of this thesis is to analyse the data requirements of DES and Industry 4.0 for improving operational decisions of production systems. To meet this purpose, the following research questions are addressed:
RQ1: What are the data challenges in existing production systems? RQ2: What data is required for implementing Industry 4.0 in production
systems?
RQ3: How can data requirements from Discrete Event Simulation benefit
3
1.4 Thesis Scope and Limitations
The scope of this thesis is defined by the analysis of data requirements for operational decisions at a specific manufacturing company, when improving an existing production system. The current data requirements are compared to present data-related issues, affecting the implementation of Industry 4.0. Thus, the DES model is used to analyse how data is collected, analysed and evaluated for operational decisions.
The concepts of data requirements, operational decisions and production system development delimits the report. Since the concept of Industry 4.0 contains many aspects, the thesis is delimited to focus on operational decisions that affects the output and reduction of cycle time (CT). Thus, a general understanding is provided on the concepts of Big Data (BD), Cyber-Physical Systems (CPS), Internet of Things (IoT) and Smart Factories.
Been conducted over a total of 20 weeks due to limited time, this thesis is based on a single case study in the automotive industry. Thereby, caution is important when generalising results. In addition, the simulation models developed in software Extendsim 9, incurred in a number of assumptions and simplifications detailed described in later sections of this report. An investigation of additional software is beyond the scope, along with implementation of DES results. Meanwhile, the DES methodologies are founded on studies from the works of highly-cited authors Banks et al. (2005), Law (2014) and Robinson et al. (2003).
The experiments done in the models identified the impact of suggested scenarios, leading into gain insight on the behaviour of the production line. Thus, these scenarios should be treated as reference if the case company decided to use the models for further work. However, the DES models cannot be considered as 100 percent representative of the real-world, as the human factor plays a huge role when applying computational tools. Meanwhile, this thesis focused solely on a specific production line where engine blocks are processed, where the previous and following production step, being raw material-, and assembly flow, is not taken into consideration. The data collection for the simulation models is constructed on historical record from the year 2018, where all data was verified and validated by Scania. On the other hand, it is crucial to highlight that an economic evaluation of the suggested proposals are not displayed, as the main focus was on performance measures. Correspondingly, sensitive data such as CT’s, recorded times, investment costs and amount of produced products has been censored due to confidentiality policy of the company.
1.5 Thesis Outline
Chapter 2 describes the applied methods to conduct this report, providing the reader with required actions in order to achieve demonstrated results. Chapter 3 presents the theoretical framework such as general concepts and ideologies, through a conducted literature review. Chapter 4 leads into the empirical framework in the context of a case study, where important findings are displayed. Chapter 5 examines and discuss the interrelation between theoretical and empirical findings, correlated to the research questions. The concluding Chapter 6 leads to the conclusions, presenting recommendations and scientific contribution of the report.
4 2. RESEARCH METHOD
The following chapter represents an overall description over the research method and how the report was carried out, along with collected data. The data collection presented is divided into the method behind the literature review, case study and simulation model. Ending with a discussion on research quality.
2.1 Research Process and Design
Research is defined by Kothari (2004) as a scientific and systematic search where information is used to detect solutions to a stated problem. Thereby, data must be collected and analysed to draw conclusions as solutions to the expressed problem. The following section provides an understanding on the research process and design, by formulating applied methods hence Kothari (2004) describes the research process as a voyage of discovery.
The research process began by selecting a research topic, and conducting an initial search including the keywords: DES, Industry 4.0, Manufacturing, Production System and Process Innovation. These keywords were detected as the main research area was chosen, being Industry 4.0 from a simulation point of view, due to novelty of the topic. According to Karlsson (2009), the initial search is beneficial for providing a careful overlook on existent and relevant literature, since theoretical knowledge is delimited in the beginning. A connecting point from the initial search indicated a strong influence on data management within manufacturing. Consequently, a problem of interest was formulated in the thesis.
Afterwards, the research questions were developed to fulfil the thesis aim as advised from Karlsson (2009). These research questions were answered by collecting both quantitative and qualitative data, since being argued as fundamental research approaches (Kothari 2004; Creswell, 2014). The qualitative approach was applied to explore social aspects such as behaviour and opinions (Ibid), whereas the quantitative approach focused on examining variables interrelations with assistance from experiments in simulation (Kothari, 2004). In order to investigate the problem of interest, the case study and DES models were developed in parallel. Meanwhile, Ejvegård (2003) stress the importance of design process for being objective and unbiased. In correlation to Eisenhardt (1989), emphasizing case study selection to extend flourishing research, while distinguishing limits for generalisation.
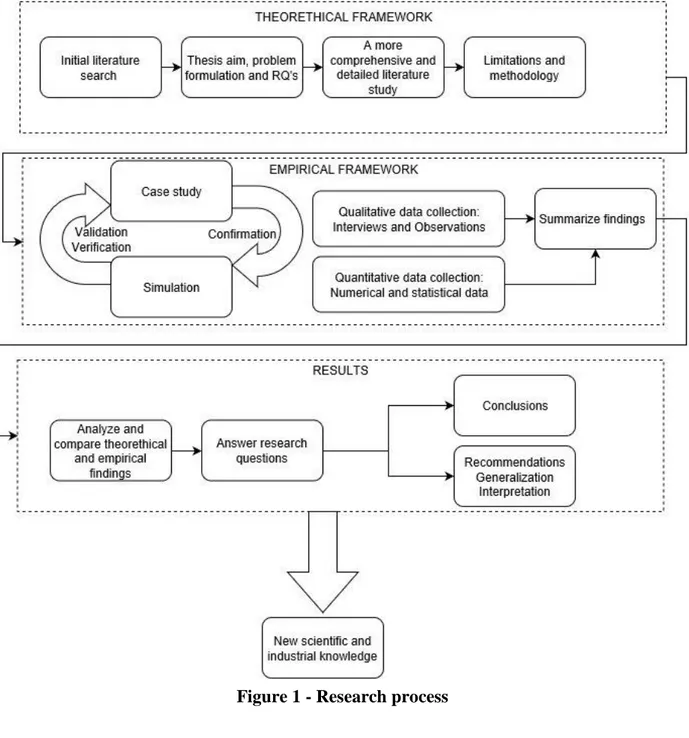
Additionally, literature was also reviewed in detail, where extra keywords evolved. Afterwards, data collection established data requirements the case company uses, while detecting data-related issues affecting implementation of Industry 4.0. Leading to the analysis, as the relationship between empirical and theoretical findings was settled. Finalized with conclusions and discussion on contributions for further research. As advised from Karlsson (2009), the conclusions were based on the comparison between theory and case company findings. The overall research process is visualized in Figure 1.
5 2.1.1 Case study
The main research method in this thesis is by performing a case study. A case study is an important method bringing various application for scientific studies, while gaining insight on cause and effect in a real-life setting (Yin, 2009; Kothari, 2004). Furthermore, the objective of conducting a case study is to expand and generalize detected theories, by several data collection forms for instance documents, interviews and observations (Yin, 2009).
6
Three reasons explain this choice of method. First, a case study method is particularly appropriate to understand questions concerning what and how phenomena occur (Yin, 2009). This was considered necessary to address the aim and research questions of this thesis. Second, there are a number of studies investigating DES and operation decisions, using case study methods. Therefore, it is important to compare how the findings of this thesis compares to others (Yin, 2009; Karlsson, 2009). Third, Industry 4.0 is a new topic with only few studies based on empirics. Meaning that, the expectations of Industry 4.0 is known, but not so much about the realities of factories on the journey of adopting Industry 4.0.
This will lead to develop new ideas and theories, resulting in new aspects within the area. The case study will examine the understanding and complexity of a phenomena in a natural setting (Bryman & Bell, 2011). According to Yin (2009), the major advantage with case studies is to investigate research questions, by attempting evidential data collection techniques. Meanwhile, Karlsson (2009), mentioned the importance of field notes, asking precise questions and being aware on how to interpret the data. Leading to assuring the quality on drawing conclusions (Ibid). In turn, Kothari (2004) claim that a case study provides the research with deep and holistic insight on interactions, outcomes and patterns of specific events.
The selected case company for this thesis has expressed a need to analyse the data gap for current operational decisions, with aid from simulation. Thereby, the case will answer “how” and “what” questions proposed by Yin (2009). Thus, a greater depth is provided by going back and forth with the research questions by observing a case (Voss, et al., 2002). The research questions are mainly based on guidance from Karlsson (2009), due to focusing on conducting valid case studies in operations management. Therefore, the book has been the primary reference for conducting the study. The case study was also selected to contribute to current gaps in recent knowledge, being an important aspect (Ibid).
Hence, the selected case study was considered appropriate, where identified behaviours and organizational management leads to improvement potentials, in line with Yin (2009). Also, Kothari (2004) underlines the fact that case studies are concentrated on localizing variables, resulting into the detected behaviour-patterns. It is also important to mention that this thesis will only conduct a single case study, performed at a world-wide automotive company in Sweden. Furthermore, the case study has applied techniques as conversations, interviews, meetings and observations. Karlsson (2009) suggested that attempting project meetings and accessing how high-level decisions are made in the organization, is crucial to investigate. The author continue that it is important to have a common view on the framework, leading to not being overwhelmed with enormous amount of data. These suggestions have been critical when conducting the case study and collecting data. At the same time, Kothari (2004) highlights the importance of collecting the appropriate data, in order to solve the real-life problem.
To that end, the data was collected from in the first half of the study, collected on a daily basis from Monday to Friday between 07.30 a.m. to 16.00 p.m. The data was collected by attending morning meetings to have an understanding on common issues in the production. The first phase was to spend two weeks at the production line along with operators. Thus, a common view on the material flow and occurred issues was established. In parallel, interviews were conducted to investigate if the view on common issues was mutual in the organization. After understanding how the process functioned, the researcher conducted flowcharts to represent the material flow.
7
The next phase was to collect organizational records and get an insight on performance regarding machines, robots, operators work process and buffers. Initially, all cycle times (CT’s) were collected from the company software named PUS. The next step was to detect the buffer sizes, which was verified by the researcher by counting units on buffers and conveyors positions. Other collected data about the production line was production volumes, lead times, batch sizes, operator capacity, production schedule, planned and unplanned stops. When the researcher had conducted an initial data collection, necessary data was sorted to analyse the process behind a simulation, described in detail in later section.
2.2 Data Collection
A mixed method approach as mentioned by Yin (2009), was adapted were a case study and a literature review was performed, in order to fulfil the thesis aim. Meaning that both quantitative and qualitative data was collected, align with suggestions by Karlsson (2009). Meanwhile, Bryman & Bell (2011) argue that the main purpose with collecting data is to provide a deeper insight. Kothari (2004), highlights the fact that collecting data provides the researcher ability to draw conclusions for the study. The mixed method approach indicates hence the use of primary and secondary data, being highly important in research studies Kothari (2004). Resulting in categorizing the purpose with the data collection into: the ability to answer research questions, as input data for DES and to understand the case company requirements.
Therefore, interlacing both data collection types lengthen the strength of findings while assuring a holistic view on the case (Yin, 2009; Kothari, 2004). The quantitative data has been presented in mathematical or statistical data (Yin, 2009; Karlsson, 2009), and input data for the simulation models. On the other hand, qualitative data presented in the thesis includes discussion, interviews and observations (Ibid). As a result, this paper has applied both primary and secondary data in form of articles, books, interviews, observations and organizational documents.
Primary data is defined as original collected data, whereas secondary data is characterised as being collected and handled by someone else (Kothari, 2004). Since secondary data is reviewed by someone else, the data sample must be reviewed with critical and cautious eyes (Ibid). However, the primary data was collected in form of observations, camera recording, interviews and discussions. The secondary data reviewed excel sheets and historical data from the case company and published literature. In order to have as realistic data as possible on a normal production, disturbance analysis and cycle times were based on the last 6 months. The data collection is summarized in Table 1.
8
Secondary data
Data form Description Example
Documents/ organizational documents Excel sheets Operational information for DES • CT’s
• Layout on production flow • Machine capacity • Operator capacity • Takt time • Maintenance • Disturbances • Machine equipment • Forecasts on production volume Literature Articles Books
Publications for frame of reference
Primary data Technique Description
Interviews Field notes Response
Conducted semi-structured interviews with key personnel from various levels in the organization
Observations Field notes Inspections
Inspected areas to gain insight in simulated process steps by participant- observing:
• Automatic material handling • Manual material handling Camera
recording
Video Field notes
To verify given data on CT’s and material handling
Meetings and discussions
Field notes Response
Encountered problems and opinions were discussed, supported the case study
Table 1 – Summarization on data collection
2.2.1 Literature review
In order to have an understanding on the chosen topic, reviewing existing literature in the field is crucial (Bryman, et al., 2018). This has helped for narrowing the research topic, setting limitations and choosing relevant keywords. As stated by Karlsson (2009), the research should begin by going through material and speed-reading relevant and interesting parts, leading to a common ground and selecting joint concerns based on frequently cited authors in the topic of this thesis. Thus, the literature search was initialized with limited knowledge on the matter (Karlsson, 2009; Bryman & Bell, 2011). According to Karlsson (2009) and Kothari (2004), the literature review is supposed to show a relationship between stated problem and current knowledge. Thus, leading to gain insight, in order to finally contextualize findings. Meanwhile, Eisenhardt (1989) argues the importance of examining contradictions and arguments when analysing a broad range of publications. These aspects were considered when reviewing past research.
The following literature search was performed by applying Mälardalens University scholarly databases. These databases were: Scopus, IEEE Xplore, ABI/ Inform and the search tool Google Scholar. However, the following report has focused mainly on the database Scopus as remaining databases were applied to find additional studies.
9
These databases were selected by covering an extensive volume of data, while Scopus is considered the largest database for finding peer-reviewed literature. By assessing peer-reviewed papers, the content was certified by experts with relevant competence in the area. The investigated topics were: Discrete Event Simulation, Digitalization, Industry 4.0 and Operational Decision. These areas resulted in various keywords being: Big Data, Bottleneck Elimination, Data Requirements, Data Handling, Internet of Things, Decision Making, Discrete Simulation, Real- time data, Smart Factories, Operational Decisions and Production System Development. These keywords were applied in various combinations and synonyms to detect relevant literature, by applying “AND”, or “OR” in-between the combinations.
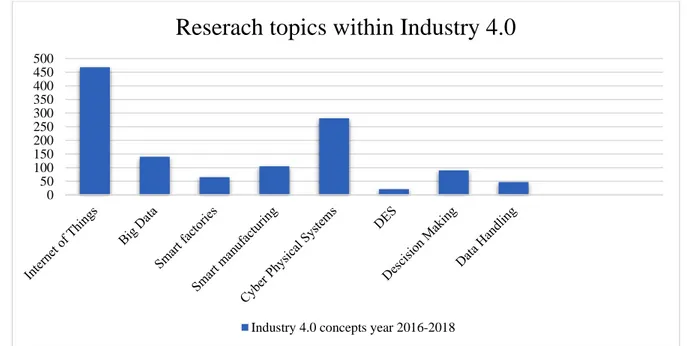
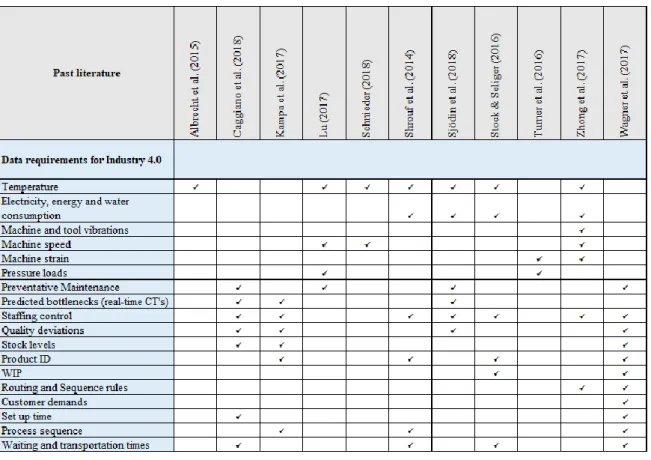
Industry 4.0 is a new topic, hence finding articles is challenging. Table 2 presents a classification of keywords and amount of publications related to the topic of this thesis, being published between the year 2016 and 2018. As visualized, the connection between DES and Industry 4.0 is scarce, strengthen the importance of bridging the gap while contributing to new, scientific knowledge.
Table 2 - Research topics within Industry 4.0 between year 2016 to 2018
Search for literature was limited to articles published within the last ten years. In addition, limitations such as “Peer-reviewed”, “Full Text Available”, “Scientific Publications and “In the Field of Engineering” was applied. The search identified highly cited authors. Once highly cited authors and articles were identified, additional publications were found through snowballing. Utilizing snowballing resulted in interesting papers and references applied by these studies. The purpose with the literature review was to detect patterns or contradiction in arguments, while attempting to bring forward a new aspect to the matter.
In that matter, the selection of articles was based on three criteria. Articles were chosen by deciding the relevance based on the title. Afterwards, the abstracts, introduction and conclusions were critically read if title was decided as relevant, otherwise being excluded. At that moment, other keywords exemplified as “Cycle Time Reduction”, “Decision-making”, and “Production Optimization”, “Performance Measures”, “Operational Changes” were used in complementary purposes. 0 50 100 150 200 250 300 350 400 450 500
Reserach topics within Industry 4.0
10
Lastly, selected articles were categorized according to main contribution shown in Table 3, with relevant keywords applied in the search. It is vital to highlight that these keywords were used in combinations and by synonyms, and some are the results from snowballing.
Overall, a total number of 85 papers and 26 books were selected, providing a broad insight on the research topic, in order to answer the research questions highlighted by Eisenhardt (1989).
Main contribution Reference
DES, data management and operational decisions
Keywords: Bottleneck Detection
Cycle Time Reduction Data Handling Data Management Data Requirements Discrete Event Simulation DES Decision Making Input data Simulation Operational Decisions Operational Changes • Adams, et al. (1988) • Atieh, et al. (2016) • Banks, et al. (1999) • Banks, et al. (2005) • Banks, et al. (2010) • Bengtsson, et al. (2009) • Bregoli, et al. (2015) • Cetindamar, et al. (2016) • Dewa & Chidzuu (2013) • Dangelmaier, et al. (2005) • El-Khalil (2005)
• Fowler & Rose (2004) • Lau, et al. (2002) • Law (2009) • Law (2014)
• McGinnis & Rose (2017) • Negahban & Smith (2014) • Popovics, et al. (2016) • Prajapat & Tiwari (2017) • Robinson (2003) • Robinson (2004) • Robinson (2005) • Robinson (2008) • Robinson (2014) • Rodic (2017) • Roser, et al. (2001). • Seleim, et al. (2012) • Skoogh & Johansson (2008) • Skoogh, et al. (2012) • Steinemann, et al. (2013) • Strickland (2011) Industry 4.0 and operational decisions
Keywords: Big Data
Cyber Physical Systems, CPS Data Handling Data Requirements Digitalization Industry 4.0 Industrie 4.0 Internet of Things Real-time data Operational decisions Smart factory • Adamson, et al. (2017) • Albrecht, et al. (2015) • Chen (2017) • Choi, et al. (2015) • Huang, et al. (2003) • Hermann, et al. (2016) • Kagermann, et al. (2013) • Kamble, et al. (2018) • Lu (2017)
• McAffe & Brynjolfsson (2012) • Mehta & Reddy (2015) • Müller, et al. (2018)
• Oesterreich & Teuteberg (2016) • Posada, et al. (2015)
• Roblek, et al. (2016) • Sachdeva, et al. (2017) • Schnieder (2018) • Stăncioiu, (2017). • Stock & Seliger (2016) • Thiede, et al. (2016) • Wagner, et al. (2017) • Wang, et al. (2016)
11
• Yang, et al. (2016) • Zhang, et al. (2018) • Zhong & Shirinzadeh (2008) • Zhong, et al. (2017) • Zhou, et al. (2015) Relationship on data handling between DES and
Industry 4.0 Keywords: Discrete Simulation Smart Factory Simulation Virtual factory Virtualization VR • Brettel, et al. (2014) • Bokrantz, et al. (2018) • Caggiano, et al. (2018) • Clemant, et al., (2017) • Ferro, et al. (2017) • Jain, et al. (2016) • Jeddi, et al. (2012) • Kampa, et al. (2017) • Kibiria & Shao (2017) • Omogbai & Salantis (2016) • Shrouf, et al. (2014) • Sjödin, et al. (2018) • Turner, et al. (2016) • Uriarte, et al. (2018) • Xu, et al. (2017)
Operational decisions and present production system development
Keywords: Production system development Operational decisions
Operational changes Effectiveness Efficiency
Manufacturing change management Production Optimization
Performance measures Key Performance Index
• Ajmal, et al. (2009) • Bellgran & Säfsten (2005) • Bellgran & Säfsten (2010) • Bruch & Bellgran (2012) • Bruch & Bellgran (2013) • Bruch & Bellgran (2014) • Brunaud & Grossman (2017) • Cochran & Bröte (1999) • Davenport & Prusak (1998) • Frishammar & Hörte (2005) • Frishammar, et al. (2013) • Hamrol, et al. (2016) • Hatami, et al. (2003) • Jonsson & Mattson (2003) • Jonsson & Mattson (2011) • Kehoe & Boughton (2001) • Liebowitz (2005)
• Lindskog, et al. (2012) • Mattson (2012)
• Robertson & Ulrich (1998) • Rösiö & Säfsten (2013) • Segerstedt (2008) • Sivard & Lundgren (2008) • Wei & Krajewski (2001) • Wu (1994)
Table 3 - Categorization of reviewed literature
2.2.2 Simulation
The DES models have been based on logical and numerical assumptions, associated with collected data. Leading to a display on how the reality might appear to be, in digital environments (Strickland, 2011; Banks, et al., 2010; Skoogh & Johansson, 2008). A DES model is defined as a representation of a system over a specific period of time, where variables change during separate events (Law, 2014). The DES models were built in the software ExtendSim 9. Whereas steps to develop a DES model were based on Banks et al. (2005).
12
The first step was to define a clear, quantified problem with relevant stakeholders (Banks, et al., 2005: Law, 2014). The case company had expressed issues with a specific production line, regarding how data is used today at the company. The company expressed concerns on raising awareness on data-related issues and investigating unnecessary production times. The simulation model should as a result, highlight bottlenecks and unnecessary times that is often forgotten during production system development. At this phase, it was important to make sure that all relevant parties were on the same page in regard of the problem definition. This was ensured and approved through discussions and meetings.
The next step was to create a conceptual model (Skoogh & Johansson, 2008) (See Appendix 2). This was done by identifying the structure of the system and various components within it. Therefore, data collection regarding parameters and determining the complexity-level, was done in this step (Banks, et al., 2010; Robinson, 2003). Likewise, assumptions and necessary data was identified. The data collection was divided into various phases, being initial and advanced data collection. Initial data was defined as batch and buffer capacity, cycle times, demand, overall capacity and production hours. Afterwards, advanced data such as disturbance probability, maintenance conditions, machine movements, operator movements and shutdowns were added. The sources of empirical evidence came from interviews, observations and organizational records. All of the collected data for the simulation model was presented in an excel sheet, called “Input-data-archive”. With the purpose of collecting all relevant data in one place, increasing traceability during encountered issues.
The next step included validating the assumptions, data and conceptual model with the specific stakeholders (Banks, et al., 2005). This was done through meetings at the company and presenting it to project and senior manager, as well as tutors. Afterwards, the model was built in the software. At first the model was a basic version of the system while as time passed, more advanced parameters were added. Thus, a new validation and verification was done by the same stakeholders, to achieve credibility and trustworthiness (Banks, et al., 2010). This was done through meetings with simulation experts at the company and university. As the final model was verified and validated, various experiments were done by testing different scenarios to detect an optimal solution. These experiments were based on the original problem formulation. Lastly, the final step resulted in documentation and presentation of the results, with help from animation, tables, graphs, charts and pictures (Law, 2014; Robinson, 2003). The overall simulation steps is presented in Figure 2.
13
Figure 2 - Simulation steps according to Banks, et al. (2005)
2.2.3 Interviews
An essential part of the thesis has been usage of semi-structured interviews, indicating prepared questions on covered topics are listed. As stated by Bryman (2015), semi-structured interviews provides opportunities to receive information from various factors, being compared and evaluated. This also facilitated asking follow-up questions, resulting in a better understanding of the current situation and issues. Besides, Yin (2009) and Karlsson (2009) suggests using field notes while asking unbiased follow-up questions. The authors continue arguing for neutral questions results in more individual insight from the interview candidate.
14
As a result, these interviews were recorded by making notes with pen and paper while highlighting important opinions. If statements were not understood during the interview, additional questions apart from prepared questions were used, to ensure correct interpretation. As soon as the interviews were done, the thesis researcher transcribed it in a document. This method ensured that critical and relevant information was not lost in the process. The various interviews were based on the employee role and relevant knowledge at the company including personnel in manufacturing-, maintenance-, industrial projects-, production development and research and development departments. Due to Eisenhardt (1989) stressing the importance of flexibility and adapting interview questions based on different roles, ensuring relevant competence was utilised. Flexible interviews lead to a greater insight on specific variables for detecting interrelations between cause and effect, with assistance from impulsive questions (Eisenhardt, 1989; Karlsson, 2009). On the other hand, the authors suggested advantages as targeting precise expertise, but also increased risk of collecting wasteful data. Therefore, interviews were done in caution, ensuring correct direction based on research aim. Table 4 visualizes an overview on the performed interviews in this thesis.
This table categorizes the role of the interviewer, duration and a word-classification based on discussed topics. These classifications have been categorized into: current material flow, data management, Industry 4.0, operational decisions and simulation. Some interviews aimed at background about the production, bottlenecks and current operational issues. Operational issues touched upon subjects such as operator capacity and work process, machine- and tooling problems and waste between operations. Interviews aiming at data management were investigated by detecting data requirements for operational decisions and current data-related issues. The last interview topic investigated the case company’s approach towards Industry 4.0 and how the company is currently working to implement it. Thus, opinions on digitalization and data handling was in focus. These interviews provided insight on smart factories and current data challenges. Interviews has also investigated previous knowledge and application of simulation.
Current title Running time [min]
Discussed topic
Workshop Manager 60 Data management
Operational decisions Current material flow
Industry 4.0 Simulation
Production Group Manager 80 Data management
Operational decisions Current material flow Production Technology
Manager
80 Data management
Operational decisions Simulation
Operators 200 Data management
Operational decisions Current material flow
Production Technician 120 Data management
Operational decisions Current material flow
15
Industry 4.0 Simulation
Workshop Technician 110 Current material flow
Data management
Maintenance Manager 45 Current material flow
Data management Maintenance Group Manager 25 Current material flow
Data management
Digitalization Manager 45 Industry 4.0
Simulation Data management Operation decisions
Simulation Expert 360 Simulation
Industry 4.0 Data management Operational decisions
Engineer Smart Factories 60 Industry 4.0
Data management Special Project Coordinator
Manager in Smart factories
60 Industry 4.0
Simulation Data management Operational decisions
Table 4 - Performed interviews
2.2.4 Observations
Another important aspect when conducting case studies is by observing variables, conditions and interactions in-between (Karlsson, 2009). The reason is since the researcher is provided with direct access to specific processes and practices (Bryman & Bell, 2011; Kothari, 2004). The purpose with performed observations has been mainly used as a complement to the other data collected methods, in order to answer the research questions and as input to the simulation. Observations were conducted to map current operational issues, bottlenecks, data handling, material flow and waste. The observation was done by participating partly while asking questions to operators during the work process. However, before asking questions, the aim with the research and observation was explained to the operators. Observations has also been conducted to ensure as natural behavior as possible, to affect the results as little as possible (Ibid).
During the first two weeks, the researcher was provided a guided tour on the production line while talking to all of the operators, field notes were written to understand the process. The purpose was to observe the material flow from entering line as raw material to exiting as a finished, processed engine block. Next, the operator’s movements were observed, to get an insight in possible unnecessary times. The researcher focused mainly on how each operator conducted tool changes in each machine, and behavior during disturbances. Afterwards, observation was dedicated on the operator’s and machine’s behavior around the possible bottlenecks. Observation were also done with the aid of camera recoding to gain insight about the production process. This was crucial to verify CT’s. In addition, various meetings were attended at the case company.
16
During these meetings, observations were done to get an insight in operational decision-making. The various observations presented in Table 5 categorized amount of observations, observation time and description.
Observation on Number of observations Running time [min] Description Data collection type
Operators 12 30-240 Understanding work process during tool changes and disturbances Field notes Manual clocking Machine movement
5 30-60 Verify waste in portal
movement
Field notes Manual clocking
Robot cells 6 20-180 Verify CT’s Field notes
Manual clocking
Video recording
Wash cells 6 20-180 Verify CT’s Field notes
Manual clocking
Video recording
Table 5 - Conducted observations 2.3 Data analysis
The most critical part for conducting case studies is data analysis (Yin, 2009; Karlsson, 2009). Analysing data has been applied according to proposed techniques by Yin (2009). Where the data analysis in this thesis was based on continuous comparison of data collection from case studies, conducted literature review and simulation results. First, the researcher was reminded of the research questions when selecting relevant literature to include in the thesis. The selected literature was then divided into various folders being: Data Management, DES, Industry 4.0, Production System Development and Operational Decision-Making. This made it easier when wanting to compare the scientific papers to one another. At the same time, important parts and opinions was highlighted and then documented, in order to collect all similar and diverse opinions.
Then, the data analysis was performed by data- categorization, reduction and sorting, suggested by (Yin, 2009), while summarizing the final data. Afterwards, the interviews were transcribed directly after the interviews with the help of field notes. The transcription resulted in highlighting parts of importance and categorizing these parts in relation to the keywords. The highlighted parts identified likewise common or diverse opinions, being compared to the frame of reference.
Altogether, various data types were compared. This process has been implemented with suggestions from Voss et al. (2002) and Karlsson (2009). Thus, collected data was divided into subcategories, linked to analyze the different groups to one another. Data was archived in an excel-sheet to facilitate the analysis. All of the data from the company was described by relevant
17
staff members in order to interpret it in the correct way. This was decided since the disturbances earlier has changed and irrelevant due to operational changes. However, disturbance analysis was filtered based on unnormal disturbances since the simulation model should be a realistic display on a normal production. Therefore, disturbances were categorized on most frequently mentioned. It is also important to highlight that the recording videos was analyzed in a computer to collect CT’s and transportation times, used in the simulation models.
Updating the direction of simulation models and case study was performed on a weekly basis in front of a steering committee consisting of project owners and relevant stakeholders. Simulation models results were also discussed and presented, to gain feedback and ensure realistic results. Presentations was performed in front of management, seniority levels, production managers, engineers and operators. The results were also ensured by comparison to current production output.
The process on pairing the empirical findings to the research questions is described as following. The first research question was analyzed from the literature review, conducting a DES model and operational decisions. The second research question was answered by focusing on findings from literature and the case company view on implementation of Industry 4.0. Lastly, the third question was answered by combining the answers from the previous research questions.
2.4 Reliability and Validity
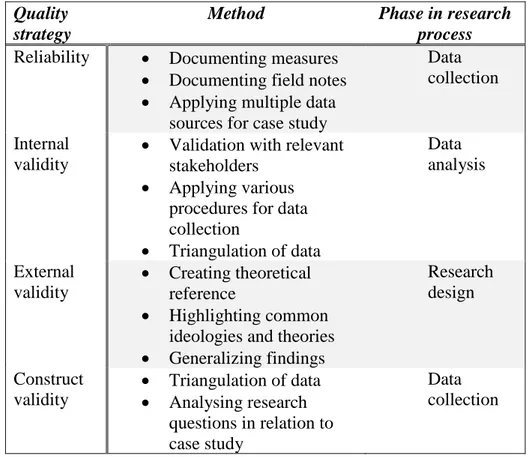
Yin (2009), Voss et al. (2002) and Karlsson (2009) underlines the fact that the research quality must be analyzed from a validity and reliability point of view, where the contained methods is demonstrated in Table 6. Also visualized in the table, is the corresponding phase in this paper for each quality strategy.
However, the difference between these two terms is that validity implies how the phenomena is measured to answer the research questions. Meanwhile, reliability is argued for the accuracy and how the measures has been done in the study. Validity is usually proved with the aid of various sources (Yin, 2009), while discussing the connection between the objectives. On the other hand, reliability implies that research can be repeated, resulting in the same conclusions. Validity is measured from three various areas being: construct-, internal- and external validity, as well as reliability (Ibid).
The first area means that research was done to assure that observations were measuring the intended phenomena with correct measures (Yin, 2009; Karlsson, 2009). In this case, multiple data proof was collected in form of interviews with stakeholders, various observations and analyzing historical data. In addition, presenting the progress of the thesis, review and feedback from relevant people has ensured quality. The internal validity occurred during data analysis to investigate patterns and time series to find relationships between variables (Voss, et al., 2002). This was accomplished by comparing and highlighting similarities and differences between interview answers and literature, comparing common and diverse opinions. Also, empirical results were compared to findings from literature, to ensure validity.
18
The external validity is about the general application of drawn conclusions, as the researcher ability to generalize the studied phenomenon is analyzed (Karlsson, 2009). In this study, the external validity was increased by drawing data from various sources, comparing prior findings reported in literature to collected data. All of which was presented to relevant stakeholders for verification.
The degree of generalization is highlighted. Generalization is limited in single case studies by the risk of becoming bias and misjudging single events (Voss, et al. 2002). Since the research was conducted as a single case study, the constructed validity and internal validity were designed to test the research quality by triangulate with previous studies in similar fields to provide a certain reliability that can be conducted in the same method for similar future studies (Yin, 2009). Only examined into a single case, resulted in a greater depth being the biggest advantage. Yet, disadvantage is limitation in generalization on drawn conclusions (Eisenhardt, 1989).
The thesis was also assisted from regular meetings to gain insight on the current process. To ensure reliability, the process of defining interview questions and the openness of the interviewer was handled with caution. It is also important to be aware that different roles, from operators to high-level management might answer differently due to dissimilar interpretations (Yin, 2009). Thus, all data has been analyzed critically with caution for interpretation.
Reliability is about the ability to get the same insight if repeating the study (Karlsson, 2009), regarding the authenticity and usability of the study (Ejvegård, 2003; Bryman & Bell, 2011). As a result, transparency with the help of thorough documentation (Yin, 2009), especially while following Banks et al. (2005) approach, enhances the study procedure. The reliability will also be increased when having a direct access to original performance and operating data (Yin, 2009). The reliability of the thesis was done by describing all parts in detail as results from the different phases are presented, with the help of thorough documentation and reporting progress. In addition, the simulation models have been built several times to get high consistency and reliability on the results. A simulation model can answer many uncertainties about the current state but should be viewed upon with cautious eyes. The model is only a replication of a current state, only handling data that has been given. It is therefore important according to Law (2009), to have a defined direction with the simulation. This was done by having an objective approach to the simulation results and recommending the company to see the model as a suggestion for decision-making, while highlighting that it does not give a certain realistic truth. The simulation model is built in various stages, where each stage has been documented and verified. These discussions were used to verify the data collection and planned observations. All of the input data and assumptions have been presented to the company and university tutor before modelling in order to increase the reliability.
The theoretical framework has been a big part of the analysis and contributing to the functional outcome. In addition, the theoretical framework was compared to the empirical findings to enhance that the conclusions are reliable.
19
Quality strategy
Method Phase in research
process
Reliability • Documenting measures • Documenting field notes • Applying multiple data
sources for case study
Data collection
Internal validity
• Validation with relevant stakeholders
• Applying various procedures for data collection • Triangulation of data Data analysis External validity • Creating theoretical reference • Highlighting common ideologies and theories • Generalizing findings Research design Construct validity • Triangulation of data • Analysing research questions in relation to case study Data collection
20 3 FRAME OF REFERENCE
The following chapter is operated as a theoretical foundation while demonstrating the current view of the research area. Initially, the contribution of present data requirements and data challenges in production system development is established. Being followed by a description on the importance and management of data in operational decisions. Secondly, a summary of current knowledge on applying DES is described, followed by data requirements behind DES. Additionally, future data requirements along with fundamental concepts within Industry 4.0 is presented. The research focus for this literature review is demonstrated in Figure 3.
Figure 3 - The research area and focus 3.1 Production System Development
The term production system development (PSD) underlines the fact to increase competitiveness by means of a long-term perspective on development, through effective processes with assistance from standardized methods and tools (Bellgran & Säfsten, 2005). In the history of PSD, the concept deals with development of new production systems or improvement of present ones (Jonsson & Mattson, 2003; Bellgran & Säfsten, 2010). Additionally, a common definition stated by Brettel et al. (2014) is the capability of a production to develop customer-satisfied products, leading to more efficient processes and products. Aa a result, Bellgran & Säfsten (2010) argues that successful PSD is achieved by continuously working with developing processes, aiming at keeping track on competitors selling similar products.
21
It is well-known that continuous improvements is achieved arguable by optimizing value-added events within processes in the entire production flow and consisting material handling (Sivard & Lundgren, 2008). Sivard & Lundgren (2008) state that material handling by devices, machines, operators and robots are vital aspects when wanting to optimize production systems. In addition, provided variables such as competence, machining tools, skills and other production resources are aspects that requires extra attention within PSD (Sivard & Lundgren, 2008; Jonsson & Mattson, 2011). Thereby, Jonsson & Mattson (2003) further explain the importance of evaluating interrelations between all operating variables, that might affect the ability to produce a specific output. Accordingly, having a holistic view on production systems has become a central issue for accomplishing efficient PSD. This holistic view is gained from having an understanding on all aspects from equipment to humans, hence a greater insight on all sub-processes in production (Bruch & Bellgran, 2014; Rösiö & Säfsten, 2013; Wu, 1994). Meanwhile, experts have seen that a holistic view results in knowledge that it beneficial on a technology-, and organizational level, while enhancing performance from sub-processes (Wu, 1994; Cochran & Bröte, 1999).
Meanwhile, few researchers have addressed the issue that various definitions exists on the importance and difference between product-, and production development (Bruch & Bellgran, 2013). Since PSD is focused primarily on improving products rather than processes, results in production perspective not being as frequently mentioned (Ibid). Thus, a neglected area becomes the present gap between operational and theoretical consideration (Brettel, et al., 2014; Bellgran & Säfsten, 2005). This gap is the result of several reasons, where past literature from Robertson & Ulrich (1998) identified as product-focused perspective is attentive due to the financial difference on modifying products versus processes. The author furthers by claiming the first option provides more profit and is consider as easier to work with, than enhancing processes. On the other hand, Bruch & Bellgran (2012) state the fact that production development is often considered as an included part within development of products.
Meanwhile, past literature highlights the importance of implemented operational changes for continuous work within PSD (Lindskog, et al., 2012). These operational changes can be implemented from various degrees giving either slight or fundamental outcome, dependent on desired effect from the organization (Bruch & Bellgran, 2013).
However, in order to reduce confusion from implemented changes, companies can arguably benefit from visualizing these changes before implementation (Lindskog, et al., 2012). Past literature highlights that this confusion can be reduced obtaining correct data (Bellgran & Säfsten, 2010). In addition, Bruch & Bellgran (2013) argued for the importance of data acquisition being the foundation of beneficial production systems.
3.2 Introducing the concept of data
Nevertheless, the importance of data is essential in conjunction to information, when investigating PSD and optimal operational decisions (Bellgran & Säfsten, 2010; Frisammar & Hörte, 2005; Jonsson & Mattson, 2011). To that end, creating an understanding on requirements for operational decisions, the difference between the terms needs to be established. Thereby, Hatami et al. (2003) clarified information as a set of data in an explicit time and manner, leading to support knowledge and understanding.
22
Furthermore, Bellgran & Säfsten (2010) defines information as having significant impact on the receiver, leading to lastly make relevant and optimal decisions. With this in mind, Kehoe & Broughton (2001) and Huang et al. (2003) draws attention to that information is the most essential strength a company has in possession, and should be utilized accordingly. Thereby, a definition on knowledge is vital to reduce confusion in interpretation, hence Ajmal et al. (2009) broadens the term by citing Davenport & Prusak (1998), arguing that knowledge is a set of experiences, ideas and values.
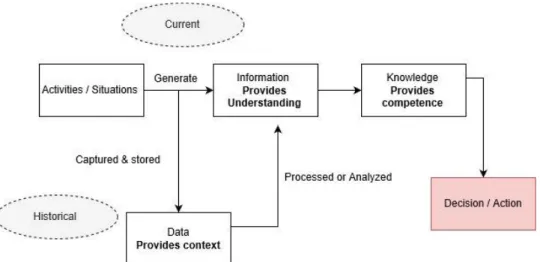
By contrast, to get an understanding and accurate knowledge, data is required in order to make precise decisions. Data is thus clarified as actionable information, being transformed into organizational knowledge (Liebowitz, 2005). With this in mind, Hatami et al. (2003) agrees that decisions are based on data, information and knowledge, whereas data is provided from individuals or organizational databases. To that fact, some consider data as having little meaning solely to make decisions, but provides the ability to capture a true, historical scenario (Ajmal, et al., 2009; Cetindamar, et al., 2016). Liew (2007) clarifies the matter from stating that collected data from activities and situations, are not enough for companies to make decisions. Furthermore, Liew (2007) established a model (See Figure 4), demonstrating that data is generated through information, resulting in contextualizing knowledge to make optimal operational decisions.
Figure 4 - Decision formation of information and data (Liew, 2007)
Despite the diverse view on importance of data, companies are applying extended attention on hiring data analytics, aiming at increased quality on decisions. With the reason of developing and implementing new technologies to improve present data-, flows and acquisition (Liebowitz, 2005). The increased quality of decisions is gained by defining data requirements considering products and processes, which is of high interest among companies (Jonsson & Mattson, 2003). Meanwhile, the authors argue that some relevant data for instance regarding environmental and human aspects have a tendency to be absent. As a result, the authors state that these aspects should be of interest.