Technical Bulletin TB05-01 March 2005
ricultural
Ag
Experiment Station
College of Agricultural Sciences Department of Soil and Crop SciencesSouthwestern Colorado Research Center
Cooperative Extension
Alfalfa Response to Water Deficit
Using Subsurface Drip Irrigation
Alfalfa Response to Water Deficit Using Subsurface Drip
Irrigation
Abdel Berrada, Research Scientist Colorado State University Arkansas Valley Research Center
Rocky Ford, Colorado
Formerly located at:
Southwestern Colorado Research Center Yellow Jacket, Colorado
Acknowledgments
The U.S. Bureau of Reclamation and the Colorado Agricultural Experiment Station funded this project. Additional support was provided by Roberts Irrigation Products, Inc. and by ML Irrigation Systems, Inc. Thomas Hooten and John Skouson assisted with installation of the subsurface drip irrigation system and with data collection. Michael Bartolo and Troy Bauder reviewed the manuscript and provided valuable suggestions for improving it. Thank you all!
Disclaimer
Mention of a trademark or propriety product does not constitute endorsement by the Colorado Agricultural Experiment Station.
Colorado State University is an equal opportunity/affirmative action institution and complies with all Federal and Colorado State laws, regulations, and executive orders regarding affirmative action requirements in all programs. The Office of Equal Opportunity is located in 101 Student Services. In order to assist Colorado State University in meeting its affirmative action
responsibilities, ethnic minorities, women, and other protected class members are encouraged to apply and to so identify themselves.
Table of Contents Subject Page Title Page Table of Contents List of Tables List of Figures Abstract Introduction
Materials and Methods Treatments
Alfalfa Seeding Irrigation System Challenges
Measurements Results and Discussion
2002 Results
2003 Results
Water Use Efficiency Discussion References i ii iii iii 1 2 2 3 3 3 4 5 5 5 5 6 7 9
List of Tables
No. Title Page
1 2 3 4 5 6 7
Alfalfa DM yield and moisture content in 2002 at Yellow Jacket, as affected by cultivar and irrigation at the second and third cutting.
Alfalfa feed quality in 2002 at Yellow Jacket, as affected by cultivar, irrigation, and cutting.
Alfalfa DM yield and moisture content in 2003 at Yellow Jacket, as affected by cultivar and irrigation at each cutting.
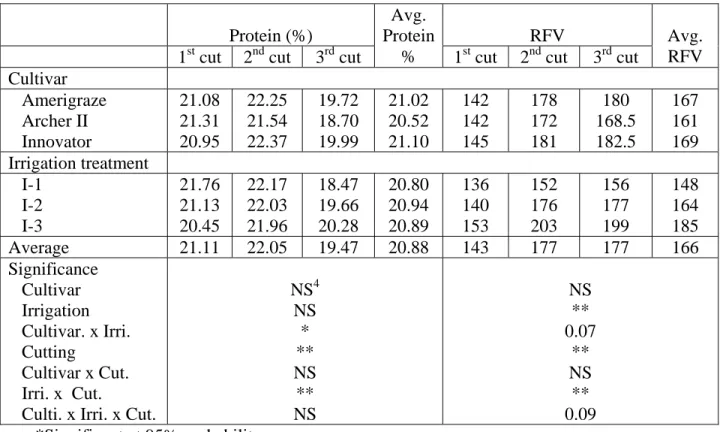
Alfalfa protein and RFV in 2003 at Yellow Jacket, as affected by cultivar and irrigation.
Alfalfa water balance and use efficiency at Yellow Jacket in 2002 and 2003. Maximum crop production that could be expected from a 160-acre field when water allocation is limited to 14 in/a.
Dolores Project irrigation water analysis in October 1997.
10 11 12 13 14 15 15 List of Figures
No. Title Page
1 2 3 4 5 6 7 8 9 10 11 12
Alfalfa acreage and average hay yield in the FS area of the Dolores Project in 1995-2001.
Crop acreage and water usage in the FS area of the Dolores Project in 1987-2002. Water use (inches/irrigated acre) in the FS area of the Dolores Project in 1987- 2002.
McPhee Reservoir on July 17, 2002.
Monthly precipitation at Yellow Jacket in 2002 and 2003. Installation of the drip tape.
View of the filtration system and control panel.
Alfalfa DM yield as a function of precipitation (rain + irrigation) at Yellow Jacket in 2002 and 2003.
Alfalfa hay yield vs. water use in the FS area of the Dolores Project in 1995-2001. Monthly crop ET at Yellow Jacket in 1992-1998.
View of the SDI project in July 2002.
View of the SDI project after it rained 2.2 in. from 28 August through 12 September 2002. 16 16 17 17 18 18 19 19 20 20 21 21
Alfalfa Response to Water Deficit Using Subsurface Drip Irrigation Abdel Berrada
ABSTRACT
The recent drought and expanding alfalfa acreage in southwestern Colorado, under the Dolores Irrigation Project, led to high water usage in 2000 and 2001 and water shortages in 2002 and 2003. Consequently, there has been renewed interest in research and education to enhance water conservation and management in southwestern Colorado. In this context, a field experiment was conducted in 2002 and 2003 to investigate the effect of water stress on alfalfa Dry Matter (DM) yield and hay quality. Three water stress levels were imposed on three alfalfa cultivars with contrasting dormancy rating, in a split-block design. The irrigation system used was subsurface drip irrigation (SDI) with 60-in. lateral spacing and 18-in. placement depth. Total alfalfa DM production (adjusted to 12% moisture) averaged 5.7 t/a in 2002 and 5.3 t/a in 2003, with no significant differences among cultivars. Alfalfa DM production increased significantly with increasing amounts of irrigation. A hailstorm on September 9, 2003 reduced alfalfa yield at the third cut, particularly in the least- and moderately stressed water treatments. Alfalfa protein concentration averaged 21% in 2002 and 2003, with no significant differences among cultivars or irrigation treatments. Alfalfa relative feed value (RFV) was highest in the most stressed treatment and lowest in the least stressed treatment. Alfalfa water use efficiency averaged 395 to 467 lb of DM per inch of water (precipitation + irrigation + change in soil water) in 2003. It took 4.5 inches of water to produce one ton of alfalfa hay in the least stressed treatment and 5.1 inches in the most stressed one. More water, 5.3 to 6.1 inches, would have been required to produce one ton of hay with the predominant irrigation system (sideroll) in the Full Service Area of the Dolores Project. Visual observations suggest that 40-in. lateral spacing would be suitable for alfalfa hay production with SDI. Research is needed to determine the optimum drip tape lateral spacing and placement depth for alfalfa and other crops grown in southwestern Colorado. Initial cost, maintenance, and gopher control are among the challenges that could hamper the use of SDI for field crop production in southwestern Colorado.
INTRODUCTION
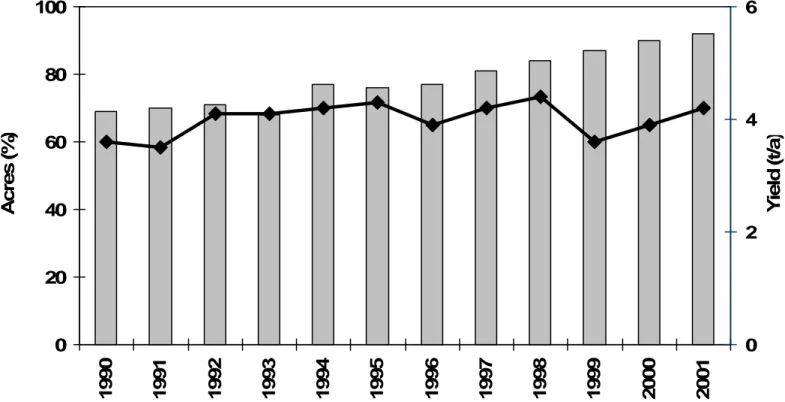
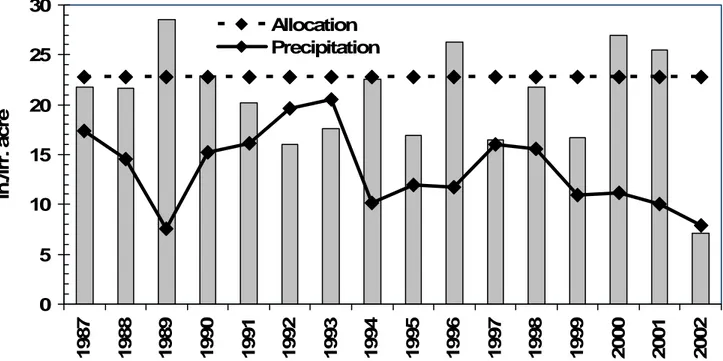
Alfalfa is the major crop in the Full Service (FS) area of the Dolores Project. Ninety two percent of the irrigated acreage was in alfalfa in 2001 (Fig. 1), which far exceeded the project design criteria of 55% alfalfa, 20% small grains, 15% dry bean, 3% pasture, and 7% corn (U.S. Department of the Interior, 1977). Because of the large acreage in alfalfa, the total water allocation for the FS area (55,200 acre-ft.) was reached or slightly exceeded in 1996, 2000, and 2001, which were all dry years (Fig. 2). Water use in inches per irrigated acre was exceeded in those years and in 1989 (Fig. 3). There were severe water shortages in 2002 and 2003 due to drought (Fig. 4). Full service irrigators received approximately 28% of their normal water allotment (22.8 in/acre) in 2002 and a little over 50% in 2003. With the exception of 2002 and 2003, FS irrigators were able to use up to 30 in. of water per acre due to the fact that not all the allocated acres were developed for irrigation. Water not consumed at the end of the irrigation season was considered part of the general pool and was reallocated to all users e.g., FS irrigators, Montezuma Valley Irrigation Co., Fish & Wildlife, and Ute Mountain Ute Farm & Ranch, in proportion to their project allotment.
Of the approximately 28,000 acres allocated to the FS area, an average of 87.6% was irrigated in 1996 to 2002 (Fig. 2). The irrigated acreage increased steadily since water was first delivered to the full service irrigators in 1987 and leveled off around 87% starting in 1996 (Fig. 2). Water from undeveloped or under-irrigated acres was pooled into a "water bank" and was available to all FS irrigators at a slightly higher price than their normal allotment.
The severe drought of 2002 forced FS irrigators to delay seeding of new alfalfa and in some cases, plow fields with old and/or poor stands of alfalfa sooner than anticipated. Some of the idle fields were planted to dry bean in 2003. Nonetheless, unless the drought continues—FS area farmers received their full water allocation in 2004, the acreage in alfalfa will remain high due to good hay prices and fairly reliable markets. Furthermore, alfalfa is well adapted to the soil and climatic conditions of southwestern Colorado and is beneficial to the environment. In the FS area, irrigated alfalfa hay yields range from 3.0 to 7.0 t/a, with generally three cuttings. Alfalfa fixes atmospheric nitrogen, thus reducing the need for synthetic fertilizers. A good stand of alfalfa will suppress weeds, further reducing the need for chemical input, and will minimize soil loss due to alfalfa's deep root system and good ground cover.
The main objective of this study was to determine the effects of water deficit on alfalfa hay yield and quality. A secondary objective was to demonstrate the use of subsurface drip irrigation (SDI) in the FS area. (SDI was chosen as the means of delivering accurate amounts of water to alfalfa.) The results of this and other studies (Berrada et al., 2001a, 2001b, and 2001c), along with information on water use and crop yield, can be used to optimize water management in the FS area of the Dolores Project.
MATERIALS AND METHODS
A field experiment was initiated in 2000 at the Southwestern Colorado Research Center at Yellow Jacket to evaluate alfalfa response to deficit irrigation using SDI. The predominant soil
series at the research center is Wetherill loam (fine-silty, mixed, superactive, mesic, Aridic Haplustalf). The elevation is 6,982 ft. The number of days with minimum temperature > 28 oF is 143 in 8 out of 10 years (http://www.wrcc.dri.edu/index.html, verified 15 Oct. 2004). The average annual precipitation is 15.9 in. of which approximately 40% comes from snow. Monthly average precipitation ranges from 0.6 to 2.0 in., with June being the driest month (Fig. 5).
Treatments:
Six irrigation treatments were originally planned, including 100% ET, 100% water allocation, and deficit irrigation imposed at various growth periods. However, only three
irrigation treatments were tested due to challenges associated with SDI, particularly the filtration system and the difficulty of controlling gophers. The irrigation treatments were:
1. Least stressed treatment (I-1): Maintain the soil profile (0 to 6 ft.) around 50% of Available Water Capacity (AWC) throughout each growth period.
2. Moderately stressed treatment (I-2): Maintain the soil profile around 50% of AWC during the first 10 to 15 days of growth then around 25% of AWC thereafter.
3. Severely stressed treatment (I-3): Maintain the soil profile around 50% of AWC during the first 10 to 15 days of growth then at 0 to 10% of AWC thereafter.
Three alfalfa cultivars of differing fall dormancy ratings, Amerigraze401 + Z (dormancy 4), Archer II (dormancy 5), and Innovator+Z (dormancy 3) were planted perpendicular to the irrigation treatments. This resulted in a split-block plot layout with four replications. Individual plot size (irrigation treatment by alfalfa cultivar) was 20 ft. by 140 ft. Total plot area was 6.3 acres, including the borders.
Alfalfa seeding:
Alfalfa was seeded on 17 August 2000 with a Great Plains drill at 22 lb/acre. An intense rainstorm on 30 August caused extensive damage to alfalfa seedlings. As a result, the whole field was reseeded on 17 July 2001 at approximately 18 lb/acre. Prior to the first seeding of alfalfa, 52 lb of P2O5/acre, as 11-52-0, were broadcast and incorporated to the topsoil with a field cultivator. Based on soil test results, another 54 lb of P2O5/acre, as 0-45-0, were broadcast on 14 April 2003. Mustang Max [S-Cyano(3-phonoxyphenyl)methyl(±)cis/trans3-(2,2-dichloroethenyl)-2,2dimethylcyclopropane carboxylate] was applied on 11 April 2003 at 2.5 oz/acre to control army cutworms. Army cutworm (Euxoa auxiliaris) infestation and damage was extensive in southwestern Colorado in 2003. Larvae of the army cutworm feed on green plants, including alfalfa crown buds and wheat seedlings
(http://extension.usu.edu/files/agpubs/CutwormFactSheet.pdf, verified on 29 Dec. 2004). Irrigation system:
Installation of the SDI system began in June 2000. The plot area was first disked and chisel-plowed. Subsequently, two deep injection shanks mounted on a tool bar were used to mark the drip lines and later to place the drip tape at the bottom of the groove made by the shank (Fig. 6). The desired drip tape placement depth was 18 in. below the soil surface but the actual depth was 16 to 17 in. on average. Fluctuation in placement depth was due to uneven soil surface and insufficient horsepower per shank. The tractor used to pull the shanks was rated at 105 hp. A bigger tractor and precision guidance would have been required to place the drip tape at a constant depth of 18 in.
The drip tape used in this experiment had a wall thickness of 13-mil, 12-in spacing between emitters, and a flow rate of 24gal/hr/100 ft (RO-DRIP 13-12-24). Lateral spacing between drip tapes was 60 in. and was chosen, along with the placement depth of 18 in., based on extensive literature search and consultation with scientists and engineers familiar with SDI. Ideally, drip tape configuration should be determined based on field testing since different soils have different hydraulic properties (http://www.oznet.ksu.edu/library/ageng2/mf2578.pdf, verified on 29 Dec. 2004).
Each irrigation strip had four driplines (20 ft. by 420 ft.) and was equipped with an inlet manifold comprised of a pressure regulator (10 psi), a 0.75-in. flow meter, a solenoid valve, and a 1-in. air relief valve. The outlet manifold for each irrigation strip had a drain valve and a
pressure gauge. The plot area slopped (1 to 3% slope) east and south. Water pressure at the outlet manifolds was generally 10 to 15 psi, except at one location (7.5 psi).
A 4-in. spin clean filtration system with a 150-mesh screen was used to filter water for the whole field. Six-station solid-state controllers were installed at a central location (one per replication and one controller for the border strips) to program water delivery (amount and timing) to each strip plot (Fig. 7). Delivery amounts were based on soil moisture content and ET measurements.
The installation and initial testing of the SDI system was completed in the fall of 2001. The system was again tested at the beginning of the irrigation season in 2002. Alfalfa was watered with a wheel-line irrigation system (sideroll) after it was seeded in August 2000 and July 2001, to ensure good germination and emergence.
Challenges:
The major challenges encountered during testing and early operation of the SDI system were water leaks and the frequent plugging-up of the filtration system. Initially, 200-mesh screens were used but were later replaced with 150-mesh screens. This, along with the installation of new spin plates and a protective metal sleeve around the screen, helped reduce the plugging-up of the screen.
Leaks in the drip tape were caused by too much tension (pull strength) or friction at the tip of the injection shanks during installation and by pocket gophers. Most of the leaks were located near the inlet and outlet of the drip tapes.
Gophers were controlled by dispensing poisoned bait in newly dug gopher holes, but were never completely eliminated. Ideally, one should seal off the plot area with mechanical or chemical barriers to keep gophers from moving in from adjacent fields. A castor (Ricinus
communis) oil based repellent was applied once through the drip system but its effectiveness was
not evaluated. Pocket gophers are common in alfalfa fields in the FS area, particularly during the off-irrigation season. (They tend to stay away from wet soil).
Once most of the leaks were fixed, alfalfa was already in an advanced growth stage, which did not allow enough time for the application and full expression of the irrigation treatments.
Consequently, the whole plot area was irrigated uniformly during the first growth period with 10 inches of water. Average hay yield was 2.2 tons/acre.
Measurements:
Soil moisture: Two neutron probe access tubes per irrigation treatment were installed in two
replications in July 2002. Total soil moisture content in the root zone (0 to 6 ft.) was measured weekly with a CPN 503 DR neutron probe, in one-foot depth increments. Available soil moisture was calculated as the difference between total soil water content minus water content at the wilting point (estimated). Only the soil moisture data from the 2003 season is presented in this report since data for 2002 is incomplete.
Alfalfa DM yield: Alfalfa DM yield was estimated from the middle section (40 to 60 ft. in
length) of each plot. Alfalfa was cut with a forage plot harvester equipped with a 4-ft. sickle bar. First, second, and third cutting dates were 13 June, 25 July, and 25 Sept., respectively in 2002; and 12 June, 24 July, and 18 Sept. in 2003. An electronic scale mounted on the forage harvester was used to record the alfalfa fresh weight. Samples were obtained from each plot and oven-dried at 57o C for 72 hr. to determine alfalfa moisture content and to prepare the samples for feed quality analyses.
Alfalfa feed quality: Alfalfa samples were analyzed for crude protein (CP), Acid Detergent
Fiber (ADF) and Neutral Detergent Fiber (NDF) with the Near Infrared Reflectance
Spectroscopy (NIRS). Total Digestible Nutrients (TDN) and Relative Feed Value (RFV) were calculated from the NIRS data.
Data analysis: Alfalfa yield and feed quality data were analyzed using the Proc Mixed
procedure (SAS Inst., 2002).
RESULTS & DISCUSSION 2002 Results:
Alfalfa DM production was significantly higher at the third than at the second cutting in 2002 (Table 1). Cutting date had a significant effect on all the parameters measured as did irrigation scheduling (treatment), with the exception of crude protein. Crude protein, ADF, and NDF were higher at the second than at the third cutting (Table 2). In contrast, TDN and RFV were higher at the third than at the second cutting. They were highest in the treatment that received the least water and vice-versa. None of the response variables were affected by alfalfa cultivar.
As expected, alfalfa moisture content at cutting decreased as the severity of the water deficit increased (Table 1). On average, alfalfa had more moisture at the second than at the third cutting, probably because it was harvested at an earlier growth stage at the second cutting.
2003 Results:
As in 2002, irrigation had a highly significant effect on alfalfa DM production at each cutting and in total for the season (Table 3). Dry matter yield increased in a curvilinear fashion
with increasing amounts of irrigation (Fig. 8, 2002 and 2003 results). There were no significant differences in dry matter yield among the three alfalfa cultivars, except at the second cutting when Archer II outperformed Innovator by 0.16 ton/acre (Table 3).
Total alfalfa DM yield (adjusted to 12% moisture) averaged 5.3 tons/acre in 2003, with no significant differences among cultivars (Table 3). Irrigation treatment I-1 produced the highest DM yield (6.5 t/a) followed by I-2 (5.6 t/a) and I-3 (3.8 t/a). Alfalfa moisture content at each cutting generally decreased as alfalfa was subjected to more water stress (Table 3).
Alfalfa DM was highest at the first cutting and lowest at the third cutting (Table 3). Alfalfa hay yield in southwestern Colorado usually varies in the order: 1st cutting > 3rd cutting ≥ 2nd cutting due to a longer season and milder temperatures during the first and third growing periods.
Alfalfa was damaged by a severe hail storm on 9 Sept. 2003. As a result, DM production at the third cutting was substantially less in 2003 than in 2002. The hail storm resulted in
defoliation and stem breakage, causing as much as 40% in damage to the alfalfa crop. Damage was more pronounced in I-1 than in I-2 and I-3 due to more growth (more new growth, more foliage, and taller plants) in I-1. Precipitation during the hail storm totaled 2.3 in. There was very little growth from 9 Sept. to when alfalfa was cut on 19 Sep. due to hail damage and below average air temperature.
Alfalfa percent protein averaged 20.9% in 2003 (Table 4). It was significantly lower at the third cut than at the first or second cuttings due to hail damage. Alfalfa feed value was highest at I-3 and lowest at I-1. Higher feed quality hay was produced at the second and third cuttings (RFV = 177) than at the first cutting (RFV = 143).
Water use efficiency:
Precipitation (rain + irrigation) use efficiency averaged 393 lb of alfalfa hay per acre inch of water in 2002, with little differences among the irrigation treatments (Table 5). Precipitation use efficiency was highest during the first growth period and lowest during the third period, except at I-1 in 2002.
Precipitation and total water use efficiencies were much higher during the first growth period in 2003 than in 2002 because of higher alfalfa DM yield and less irrigation (Table 5). Less water was applied in 2003 than in 2002 due to higher precipitation in January through May and in July and August of 2003. Crop ET was also higher in 2002 than in 2003
(http://www.wrcc.dri.edu/cgi-bin/cliMAIN.pl?coyell, verified 29 Dec. 2004).
Precipitation and total water use efficiencies, expressed in lb/acre in., were noticeably lower at the third cutting in 2003 than at the second and especially the first cutting due to lower yields and higher rainfall. Total water use efficiency was similar at I-1 and I-2 and lower at I-3. It took 5.1 in. of water to produce one ton of hay in 2002 and 4.3 to 5.1 in. in 2003 (Table 5). Soil moisture data in 2002 was incomplete and thus, was not included in the water balance calculations.
Assuming irrigation efficiencies of 95% for SDI and 70% for siderolls and no difference in alfalfa production between the two irrigation systems, it would have taken approximately 1.2 (I-3) to 1.4 in. (I-1) more water in 2003 to produce one ton of alfalfa hay with sideroll than with SDI. Crop transpiration should be the same no matter what irrigation system is used, although there would be less evaporative cooling and more evaporative demand with SDI than with a sprinkler irrigation system. However, with a well-designed and operated SDI system, water losses due to wind and runoff would be negligible (or nil) compared to a sprinkler system. Water drainage below the root zone should be minimized in both systems with sound irrigation
scheduling. Discussion:
Water use in the FS area averaged 21.5 in. per irrigated acre in 1995 to 2001 (Berrada, 2004). Alfalfa hay production averaged 4.1 t/acre during the same period (Fig. 1). Thus,
irrigation water use efficiency (IWUE) for the entire FS area was 381 lb/ acre in. Total water use efficiency (TWUE) would be less—around 300 lb of alfalfa hay per acre in., since IWUE does not include water from rain, snow, or the soil reservoir. In comparison, TWUE averaged 436 lb/acre in. in 2003 with SDI (Table 5). This amounts to a 45% increase in TWUE. Therefore, substantial improvements in water use efficiency in the Dolores Project are possible.
There was a significant but weak correlation (r = 0.26) between water use and alfalfa hay yield in the FS area in 1995 to 2001 (Fig. 9). The projected alfalfa hay yield in the FS area is 4.8 t/acre (U.S. Department of the Interior, 1977). Actual yields averaged 4.1 t/acre in 1995 through 2001. In comparison, the alfalfa variety trials at Colorado State University’s Southwestern Colorado Research Center averaged 6.1 t/acre during the same period.
Consequently, the potential exists for substantial increases in alfalfa hay yield and water use efficiency in the FS area of the Dolores Project. To do that would require improved soil, crop, and water management; and efficient irrigation. Irrigation efficiencies of 95 to 100% are attainable with SDI, compared to 75% or less with siderolls.
When water supply is limited, as was the case in 2002 and 2003, one strategy for optimizing water use may be to limit production to one or two cuttings of alfalfa, instead of stretching the available water to the whole season. An illustration of this is shown in Table 6. The results indicate that dry bean would be competitive with alfalfa when water is limited, although the cost of production was not included in the illustration. At current prices, around $30/cwt
(http://www.ams.usda.gov/LSMNpubs/pdf_weekly/bean.pdf, verified 11/29/04), bean production would provide a higher gross income than alfalfa.
Growers should diversify crop production to take advantage of differing water use patterns (Fig. 10) and manage their water allocation efficiently. Based on the 1995-2001 crop acreage (84% of the irrigated acres were in alfalfa), water allocation in the FS area should be 28.6 in./acre to meet crop ET requirements (Berrada, 2004). The current allocation is 22.8 in./acre. The higher water allocation is possible during “wet” years when the demand for irrigation water is usually less than that during normal or dry years. Consequently, water shortages should be expected in the future unless some of the acreage in alfalfa is converted to crops with lower water requirements and/or significant improvements in water management are achieved.
Research is needed to refine SDI system design and develop best management practices for crop production in southwestern Colorado. Visual observations indicate that the spacing of 60 in. between driplines is inadequate for alfalfa production in dry years (Fig. 11 & 12). A spacing of 30 to 40 inches would allow for more uniform water distribution and fuller crop cover in most years. The lateral spacing of 60 in. would work better for row crops.
The drip tape placement depth needs to be investigated as well. When the drip tape is placed several inches below the seedbed, water may not reach the seeds, in which case, a secondary irrigation system (unless rainfall is timely) may be needed to ensure good seed germination and plant emergence. This would increase the production costs and might not be economically feasible. Drip tape placement depth is also important because it will affect water distribution and delivery to the crop (via its roots). Optimum drip tape spacing and placement depth may be different for different crops and soil types (http://www.oznet.ksu.edu/library/ageng2/mf2578.pdf, verified on 29 Dec. 2004).
A well-designed SDI system will deliver the proper amount of water to the crop at the opportune time, with minimum losses. Areas of enhancement in this experiment include
filtration, automation, and irrigation scheduling. Gophers were a major nuisance in 2001 to 2003. The filtration system (spin clean) used in this experiment may not have been adequate for surface water--sand media and disk filters are more commonly used. Irrigation water quality in the Dolores Project is generally excellent (Table 7). Nonetheless, sediment during peak usage and algae are concerns that need to be addressed when designing an SDI system.
Weed and insect control was not as serious of a challenge as gopher control. In theory, there should be less pest problems with SDI than with sprinkler or surface irrigation. This is because there is less humidity with SDI. There was no noticeable difference in weed infestation in this experiment and in adjacent alfalfa fields, which were irrigated with siderolls. Pigweed (mostly
Amaranthus retroflexus) and mustard (mostly Chorispora tenella) were plentiful in the spring
but were suppressed by the solid alfalfa stand or kept under reasonable control by harvest management (timing of cuttings).
Unlike sprinkler and flood irrigation, SDI may reduce weed seed germination and dispersion through the field. Regardless of the irrigation system, weeds may remain a nuisance as long as there are weed seeds in the soil and adequate moisture (from irrigation, rain or snow) to trigger seed germination. Prevention and timely intervention are paramount to good weed management.
Shortly before the first cutting in 2003, a severe infestation of pea aphids was observed at the eastern edge of the SDI plots and was spreading westward. The damage would have been substantial had not alfalfa been cut in a timely manner. In this instance, sprinkler irrigation (or rain) may have helped stem the spread of aphids which thrive in hot, dry weather
(http://www.ext.colostate.edu/pubs/insect/05531.html, verified on 29 Dec. 2004). (Ladybugs were working on the aphids, but not fast enough or in large enough numbers to have a real impact). In contrast, high humidity favors the spread of diseases such as white mold in beans.
In a well-designed SDI system, water will stay within the rootzone, thus keeping the soil surface and crop canopy dry (unless it rains frequently), which in turn would reduce disease proliferation. A dry soil surface will also enhance water infiltration and reduce runoff.
A major advantage of keeping the topsoil dry is to shorten the time between the last
irrigation and alfalfa cutting. When sprinkler or surface irrigation is used, enough time should be allowed--usually one to two weeks in this environment, between the last irrigation and alfalfa cutting to avoid soil compaction. With SDI, it is conceivable to irrigate alfalfa during cutting thus reducing water stress.
As in other SDI studies (Camp, 1998), subbing (water getting to the soil surface) was observed in this experiment, especially after one or more inches of water were applied. This could be avoided with careful SDI system design, proper drip tape installation (no big voids between the tape and the soil surface), and irrigation scheduling, i.e., pulsing.
REFERENCES
Berrada, A. 2004. Water management for optimum crop production in SW Colorado. Agron. Abstracts, Amer. Soc. of Agron., Madison, WI. (CD-ROM). ASA-CSSA-SSSA Annual Meetings, Oct. 31-Nov. 4, 2004; Denver, CO.
Berrada, A., M.W. Stack, and G. E. Cardon. 2001. Assessment of Irrigation Water Management and Demonstration of Irrigation Scheduling Tools in the Full Service Area of the Dolores Project: 1996-2000. Part I: Survey Results. Agric. Exp. Sta. Tech. Rep. TR01-6, Colorado State Univ., Ft. Collins, CO.
Berrada, A., T.M.Hooten, G.E. Cardon, and I. Broner. 2001. Assessment of Irrigation Water Management and Demonstration of Irrigation Scheduling Tools in the Full Service Area of the Dolores Project: 1996-2000. Part II: Calibration of the Watermark Soil Moisture Sensor and ETgage Atmometer. Agric. Exp. Stn. Tech. Rep. TR01-7, Colorado State Univ., Ft. Collins, CO. Berrada, A., T.M.Hooten, I. Broner, and G.E. Cardon. 2001. Assessment of Irrigation Water Management and Demonstration of Irrigation Scheduling Tools in the Full Service Area of the Dolores Project: 1996-2000. Part III: Monitoring of Irrigated Alfalfa Fields Using the Watermark Moisture Sensor and ETgage Atmometer. Agric. Exp. Sta. Tech. Rep. TR01-8, Colorado State Univ., Ft. Collins, CO.
Camp, C.R. 1998. Subsurface drip irrigation: A review. Transactions of the ASAE 41(5): 1353-1367.
SAS Institute. 2002. SAS/C Online Doc., Release 8.02. SAS Inst., Cary, NC.
U.S. Department of the Interior. Dolores Project Colorado. Definite Plan Report. April 1977. Appendix B: Water Supply. U.S. Department of the Interior, Bureau of Reclamation, Upper Colorado Region.
Table 1. Alfalfa DM yield and moisture content in 2002 at Yellow Jacket, as affected by cultivar and irrigation at the second and third cutting.
DM Yield1 t/acre Avg. Yield Moisture at cutting (%) Avg. Moist. Cultivar (averaged across
irrigation trts.) 2nd cut 3rd cut t/acre 2nd cut 3rd cut % Amerigraze Archer II Innovator 1.54 1.56 1.59 1.80 1.99 1.96 1.67 1.78 1.77 77.99 78.28 77.73 72.55 71.89 72.01 75.27 75.09 74.87 Irrigation Treatment (averaged across cultivars)
I-1 I-2 I-3 1.92a2 1.62b 1.14c 2.57a 1.89b 1.29c 2.25a 1.76b 1.21c 81.12 79.93 72.95 75.26 73.48 67.70 78.19a 76.71b 70.33c
Average 1.56B3 1.92A 1.74 78.00A 72.15B 75.08
Significance Cultivar Irrigation Cutting Irr. x cutting Culti. x cutting NS4 ** ** ** NS NS ** ** NS NS **Significant at 99% probability. 1
Yield adjusted to 12% moisture. 2
Means within a column followed by the same lower case letter or: 3Means within a row followed by the same upper case letter are not significantly different at 95% probability.
4
Table 2. Alfalfa feed quality in 2002 at Yellow Jacket as affected by cultivar, irrigation, and cutting. Cultivar Protein % ADF1 % NDF2 % TDN3 % RFV4 Amerigraze Archer II Innovator 21.6 21.0 21.4 29.8 30.9 29.9 35.8 36.8 35.7 72.8 71.6 72.5 173.0 165.7 172.9 Irrigation Treatment I-1 I-2 I-3 21.1 21.7 21.3 32.1a 30.7b 27.8c 37.9a 36.3a 34.2b 70.4c 71.9b 74.6a 158.1c 168.4b 185.0a Cutting 2nd cut 3rd cut 22.1a5 20.5b 32.6a 27.8b 38.2a 34.0b 70.2b 74.4a 155.7b 185.3a Significance Cultivar Irrigation Cutting NS6 NS ** NS ** ** NS ** ** NS ** ** NS ** ** **Significant at 99% probability. 1
ADF: Acid Detergent Fiber 2
NDF: Neutral Detergent Fiber 3
TDN: Total Digestible Nutrients 4
RFV: Relative Feed Value 5
Means within a column followed by the same lower case letter are not significantly different at 95% probability.
6
Table 3. Alfalfa DM yield and moisture content in 2003 at Yellow Jacket, as affected by cultivar and irrigation at each cutting.
DM Yield (t/acre)1
Total
Yield Moisture at cutting (%)
Avg. Moist. Cultivar 1st cut 2nd cut 3rd cut t/acre 1st cut 2nd cut 3rd cut % Amerigraze Archer II Innovator 2.88 2.85 2.88 1.40 1.48 1.32 1.02 1.00 1.07 5.30 5.32 5.26 71.91 71.97 70.73 73.09 72.79 72.36 70.83 70.63 70.93 71.95 71.80 71.34 Irrigation Treatment I-1 I-2 I-3 3.06a2 3.13a 2.42b 2.05 1.40 0.74 1.39 1.10 0.60 6.49a 5.62b 3.76c 78.92 71.34 64.34 78.21 72.25 67.79 72.23 70.58 69.59 76.45 71.39 67.24 Average 2.87A3 1.40B 1.03 5.29 71.53 72.75 70.80 71.69 Significance Cultivar Irrigation Cultivar. x Irri. Cutting Cultivar x Cut. Irri. x Cut.
Culti. x Irri. x Cut.
NS4 ** NS ** NS ** NS NS ** NS NS ** NS NS NS ** NS NS ** NS NS NS ** NS **Significant at 99% probability. 1
Yield adjusted to 12% moisture.
2
Means within a column followed by the same lower case letter or: 3Means within a row followed by the same upper case letter are not significantly different at 95% probability.
4
Table 4. Alfalfa feed quality in 2003 at Yellow Jacket, CO. as affected by cultivar, irrigation, and growth period.
Protein (%) RFV
1st cut 2nd cut 3rd cut
Avg. Protein
% 1st cut 2nd cut 3rd cut
Avg. RFV Cultivar Amerigraze Archer II Innovator 21.08 21.31 20.95 22.25 21.54 22.37 19.72 18.70 19.99 21.02 20.52 21.10 142 142 145 178 172 181 180 168.5 182.5 167 161 169 Irrigation treatment I-1 I-2 I-3 21.76 21.13 20.45 22.17 22.03 21.96 18.47 19.66 20.28 20.80 20.94 20.89 136 140 153 152 176 203 156 177 199 148 164 185 Average 21.11 22.05 19.47 20.88 143 177 177 166 Significance Cultivar Irrigation Cultivar. x Irri. Cutting Cultivar x Cut. Irri. x Cut.
Culti. x Irri. x Cut.
NS4 NS * ** NS ** NS NS ** 0.07 ** NS ** 0.09 *Significant at 95% probability. **Significant at 99% probability 4
Table 5. Water balance and use efficiency at Yellow Jacket in 2002 and 2003.
Irrigation Water balance 2002 2003
treatment & use efficiency 1st Cut 2nd Cut 3rd Cut Total 1st Cut 2nd Cut 3rd Cut Total
I-1 Change in S.M.* (in.) NA NA NA NA 1.3 -1.0 -0.1 0.2
Rain (in.) 0.1 0.1 3.2 3.4 0.6 0.4 4.1 5.2
Irrigation (in.) 10.0 10.6 10.0 30.6 5.6 9.9 8.3 23.8
Total (in.) 10.1 10.7 13.2 34.0 7.5 9.3 12.3 29.1
Yield (ton/acre) 2.2 1.9 2.6 6.7 3.1 2.1 1.4 6.5
PWUE (lb/acre in.) 436.1 359.2 388.2 393.3 977.6 398.1 224.4 449.1 TWUE (lb/acre in.) 436.1 359.2 388.2 393.3 811.7 440.4 226.4 446.3 TWUE (acre in./ton) 4.6 5.6 5.2 5.1 2.5 4.5 8.8 4.5
I-2 Change in S.M. (in.) NA NA NA NA 2.5 0.0 -1.1 1.4
Rain (in.) 0.1 0.1 3.2 3.4 0.6 0.4 4.1 5.2
Irrigation (in.) 10.0 7.9 7.5 25.4 4.0 7.3 6.2 17.5
Total (in.) 10.1 8.0 10.8 28.8 7.1 7.7 9.3 24.1
Yield (ton/acre) 2.2 1.6 1.9 5.7 3.1 1.4 1.1 5.6
PWUE (lb/acre in.) 436.1 405.0 351.6 396.0 1352.1 362.7 212.8 496.3 TWUE (lb/acre in.) 436.1 405.0 351.6 396.0 879.2 362.7 236.8 466.6 TWUE (acre in./ton) 4.6 4.9 5.7 5.1 2.3 5.5 8.4 4.3
I-3 Change in S.M. (in.) NA NA NA NA 2.7 0.0 -1.0 1.7
Rain (in.) 0.1 0.1 3.2 3.4 0.6 0.4 4.1 5.2
Irrigation (in.) 10.0 5.3 5.0 20.3 3.2 4.8 4.1 12.1
Total (in.) 10.1 5.4 8.2 23.7 6.5 5.2 7.3 19.0
Yield (ton/acre) 2.2 1.1 1.3 4.6 2.4 0.7 0.6 3.8
PWUE (lb/acre in.) 436.1 420.7 313.9 390.2 1270.3 284.1 145.1 434.9 TWUE (lb/acre in.) 436.1 420.7 313.9 390.2 740.1 285.2 164.4 395.2 TWUE (acre in./ton) 4.6 4.8 6.4 5.1 2.7 7.0 12.2 5.1 *S.M.: Soil Moisture
Notes:
Change in S.M. is the difference in soil moisture content between the end and beginning of a growing season, e.g., 1st, 2nd, and 3rd alfalfa cuttings.
• • • •
PWUE is precipitation (rain + irrigation) use efficiency in pounds of output (alfalfa DM) per inch of precipitation per acre of land.
TWUE if total (precipitation + change in soil moisture) water use efficiency in pounds of alfalfa hay per inch of water per acre. It is also expressed in inches of water per ton of hay per acre.
Table 6. Maximum crop production that could be expected from a 160-acre field in the FS area of the Dolores Project when water allocation is limited to 14 in/a.
Crop Expected Yield Unit Price ($) Irrigation in/a (af)1 Maximum Acres2 Gross Income ($) Alfalfa 5 t/a3 90 32.9 (2.74) 68 30,600 Alfalfa 3 t/a4 90 14.0 (1.17) 160 43,200 Wheat 80 bu/a 2.70 16.7 (1.39) 135 29,160
Dry Bean 18 cwt/a 18 18.9 (1.58) 118 38,232
1
Gross irrigation amount (consumptive use – effective precipitation) at 75% irrigation efficiency 2
Total allocation (1.17 AF x 160 acres) divided by irrigation amount in acre-feet 3
Three cuttings 4
Two cuttings
Table 7. Dolores Project irrigation water analysis in October 1997.
Analysis mg/l lb/acre-feet Nitrate (N-NO3) < 0.1 < 0.3 Chloride (Cl) 2 5.4 Sulfate (SO4) 15 40.4 Sulfate-S (SO4-S) 5 13.5 Carbonate (CO3) < 1.0 < 2.7 Bicarbonate (HCO3) 114 307.8 Calcium (Ca) 33 89.1 Magnesium (Mg) 5 13.5 Sodium (Na) 4 10.8 Potassium (K) 1 2.7 Boron (B) 0.02 0.1
Total Dissolvable Solids (TDS) 128 345.6
Hardness (CaCO3) 103.1 278.3
Alkalinity (CaCO3) 93.5 252.4
Electrical Conductivity (EC): 0.2 mmho/cm Sodium Adsorption Ratio (SAR): 0.2 Sodium, % of Cations: 7.7
Water pH: 8.3 Water pHc: 7.9
0 80 60 40 20 100 1990 1991 1992 1993 1994 1995 1996 1997 1998 1999 2000 2001 Ac re s ( % ) 0 2 4 6 Yi e ld ( t/ a )
Figure 1. Alfalfa acreage and average hay yield in the FS area of the Dolores Project in 1995-2001. Source: Dolores Water Conservancy District (DWCD).
0 10 20 30 40 50 60 1987 1988 1989 1990 1991 1992 1993 1994 1995 1996 1997 1998 1999 2000 2001 2002 A c re -F t.x 1 0 0 0 0 5 10 15 20 25 30 Ir r. A c re s x 1 0 0 0 AF Irr. Acres
Figure 2. Crop acreage and water usage in the FS area of the Dolores Project in 1987-2002. Source: DWCD
0 5 10 15 20 25 30 1987 1988 1989 1990 1991 1992 1993 1994 1995 1996 1997 1998 1999 2000 2001 2002 in ./ir r. a c re Allocation Precipitation
Figure 3. Water use in FSA (inches/irrigated acre) in the FS area of the Dolores Project 1987-2002. Source: DWCD
Figure 4. McPhee Reservoir on July 17, 2002. A similar condition existed at the end of the irrigation season in 2003.
0.0 0.5 1.0 1.5 2.0 2.5 3.0
Jan Feb Mar Apr May June July Aug Sept Oct Nov Dec
P re c ip it a tio n ( in .) 0.0 0.5 1.0 1.5 2.0 2.5 P re c ip it a tio n ( in .) 2002 2003 1971-00
Figure 5. Monthly precipitation at Yellow Jacket in 2002 and 2003.
Figure 7. View of the filtration system and control panel. Y = -0.004x2 + 0.37x - 1.40 R2 = 0.84 0 2 4 6 8 0 5 10 15 20 25 30 35 40
Total precipitation (in.)
Y iel d ( t/ ac re )
Figure 8. Alfalfa DM yield (Y) as a function of total precipitation (x) at Yellow Jacket in 2002 and 2003.
0 1 2 3 4 5 6 7 8 9 0 10 20 30 40 50 60 70 8 Inches/Irrigated Acre A lf a lf a Y iel d ( t/ a ) Allotement 0
Figure 9. Alfalfa hay yield vs. water use in the FS area of the Dolores Project in 1995-2001.
0 1 2 3 4 5 6 7 8 9 Cr o p ET ( in )
Apr. May June July Aug. Sept.
Alfalfa Dry bean W. wheat
I-1, 60-in. spacing
I-3, 60-in. spacing
Guess row, 40-in. spacing
Figure 11: View of the SDI project in July 2002. Most of the growth occurred around the dripline.
Figure 12: View of the SDI project after it rained 2.2 in. from 28 Aug. through 12 Sept. 2002. The middles were starting to fill up.