Analyzing the Effects of High Water Tables on Evapotranspiration from
Uncultivated Land in Colorado’s Lower Arkansas River Valley
Niklas U. Hallberg1, Jeffrey D. Niemann2, and Timothy K. Gates3
Department of Civil and Environmental Engineering, Colorado State University
Abstract. The Lower Arkansas River Valley in Southeastern Colorado is an important agricultural
region. More than a century of intensive irrigation has raised the water table of the region causing several agroecological problems including water logging, soil salinization, and leaching of
selenium into waterways. These issues could be addressed, in part, through improving irrigation practices, lining irrigation canals, and other strategies that lower the water table. A lower water table may increase crop productivity in some areas, and it is expected to reduce the ground water gradient that drives return flows, along with dissolved and mobilized salt and selenium loads, back to the river. A lower water table is also likely to reduce non-beneficial evapotranspiration (ET) from naturally-vegetated, fallow, and retired fields. Various studies in the literature suggest that a lower water table tends to produce lower ET rates, but a quantitative analysis is lacking for
conditions that are representative of the uncultivated lands in the Arkansas River Valley. The primary goal of this project is to determine the relationship between ET and ground water depth as well as other site properties for uncultivated regions in the Arkansas Valley. Two field sites were selected for detailed study. One site is a retired farm field near the Arkansas River that has a shallow water table due to nearby irrigation. The other site is a naturally-vegetated area at the edge of the alluvial valley that has a shallow water table due to its proximity to an irrigation canal. Both sites are dominated by natural grasses and forbs. Tamarisk and trees were avoided for this study. ET was calculated at a 30 m resolution from LandSat satellite imagery using the Remote Sensing of Evapotranspiration (ReSET) energy balance method. This method also produces estimates of the Normalized Difference Vegetation Ratio (NDVI), which is a measure of vegetation greenness, at the same resolution. Water table depths were measured with a total of 58 monitoring wells divided between the two sites. Other variables were measured in the field including gravimetric soil moisture at 0.30 m, 0.61 m, 0.91 m, and 1.22 m depths, ground water salinity, and soil salinity. Water balance analyses indicate that groundwater upflux contributes between 65% and 70% of the total ET during the growing season at these sites. Clear relationships between ET and water table depth at one of the two sites also suggest that ET rates drop with lower water tables. Further study is needed to put firm values on the water savings that might be achievable for the region if the water table was lowered.
1. Introduction
The Lower Arkansas River Valley in Southeastern Colorado is a semi-arid agricultural region whose economy relies on irrigation. Over a century of extensive irrigation has raised water tables in the valley producing waterlogging and salinity issues in certain areas. Many irrigated regions of the world suffer from water logging and salinity problems and the associated, negative economic impacts (Wichelns, 1999). A study between 1999 and 2001 determined groundwater and soil salinity levels to be responsible for an 11-19% reduction in crop productivity in the Lower Arkansas River Valley (Gates et al., 2006) and
1 Phone: 970-491-5387; hallberg@engr.colostate.edu 2 Phone: 970-491-3517; jniemann@engr.colostate.edu
selenium levels have been found to exceed Colorado Water Quality Control Division standards (Herting and Gates, 2006). Reducing groundwater recharge by means of improved irrigation efficiency and decreased canal seepage has been shown to reduce the water table by approximately 0.8 m with an associated 20-40% reduction in salt loads to the Arkansas River (Burkhalter and Gates, 2006). These issues have served to place
heightened attention on the role high water tables can play in the region and reducing water table heights is a proposed solution.
Several methods are being investigated for reducing water tables in order to improve salinity, selenium and water-logging issues. These include treating canals with
polyacrylimide (PAM), promoting more efficient irrigation practices, and removing invasive phreatophyte species such as tamarisk. A lower water table throughout the valley is expected to not only result in greater depths to groundwater under cultivated fields, but also under uncultivated land. The land area of one 81 km section of the Lower Arkansas River Valley was estimated to be 50% uncultivated throughout the growing season of 2003, and ET consumption from these uncultivated lands was estimated to be
approximately 65 x 106 m3 per year during a 1999-2001 study (Burkhalter and Gates, 2005). Thus, the evapotranspiration (ET) from uncultivated lands is a significant component of the valley’s water budget.
The effect of a lower water table on ET from these uncultivated lands remains poorly understood. Various studies have sought to determine the relationship between ET and depth to the water table. For example, Nichols (1994) examined the relationship between transpiration from phreatophyte shrubs and water table depth for the Great Basin and found an exponential relationship. Nichols (2000) studied the relationship between groundwater ET, which is total ET minus precipitation, and depth to groundwater in the same
environment. A linear relationship was observed, where depth to groundwater described approximately 50% of the variation in groundwater ET. However, Nichols (2000) argued that variations in vegetation were more correlated with the ET from groundwater than water table depth. A similar study in Colorado’s San Luis Valley found that after a water table drawdown from an average depth of 0.92 m to 2.50 m, ET decreased 32% and ET from groundwater decreased 62% (Cooper et al., 2006). Theoretical models have also been pursued. Young et al.(2007) investigated bare soil evaporation as related to depth to water using a MOD-HMS model and discovered an exponential relationship between evaporation and depth to groundwater.
The primary objective of this study is to observe the relationship between ET and water table depth for uncultivated lands in the Lower Arkansas River Valley. This study differs from those in the literature because the soil is neither bare nor primarily occupied by phreatophytes. In particular, we aim to determine: (1) the amount of ET that is
attributable to groundwater upflux and (2) the amount of the variation in ET that can be explained by variations of water table depth. Section 2 describes the methodology
including site selection and data collection, Section 3 describes the key results, and Section 4 summarizes the main conclusions.
2. Methodology
The general strategy for this research was to study two uncultivated sites with
naturally-vegetated area. ET was estimated from a remote sensing method (Elhaddad and Garcia, 2008) that provides spatial patterns of ET on particular dates, and water table depths were observed by use of monitoring wells. The period of study (April 28, 2007 through October 5, 2007) encompasses the majority of the irrigation season in the Lower Arkansas River Valley, which runs from the middle of March through the middle of November.
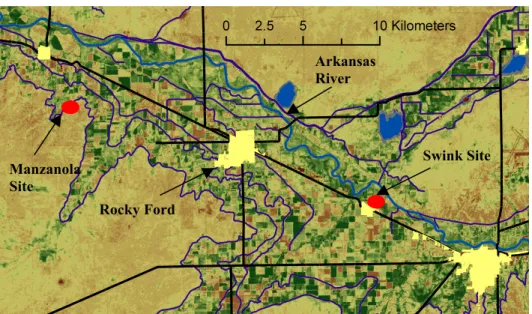
The two study locations lie within the alluvial valley created by the Arkansas River. Figure 1 shows the approximate locations of the field sites, which are both within 10 km of Rocky Ford. The site near Swink is the retired field. It lies approximately one kilometer north of the town and one kilometer south of the Arkansas River. This site used to be an alfalfa field and grazing pasture, but it is now part of a conservation easement (some grazing continues at the site). It is approximately 14 hectares in size, and it lies adjacent to two irrigated alfalfa fields. The site has minimal topographical relief. The site near
Manzanola is a naturally-vegetated field that is dominated by prairie grasses. The site is located adjacent and down slope of the Rocky Ford Highline Canal and 4 km southeast of the town of Manzanola. This field is approximately 5.3 hectares, and it has 4.9 m of topographic relief because it is located at the edge of the Arkansas Valley.
Figure 1: The locations of the Manzanola and Swink sites, marked in red (not to
scale), in the Arkansas River Valley. Black lines are roads, yellow filled areas are towns, blue filled areas are water bodies and blue lines are canals.
Actual ET (ETa) was calculated through the Remote Sensing of Evapotranspiration (ReSET) method (Elhaddad and Garcia, 2008), which utilizes LandSat satellite imagery. The LandSat5 satellite provides multispectral images including the thermal, near-infrared, and visible ranges of the study region every 16 days. Eight images were purchased from the USGS for the study period with other dates having too much cloud cover to be used in the ReSET methodology. Satellite images were processed for: 4/28/07, 6/15/07, 7/1/07, 7/17/07, 8/18/07, 9/3/07, and 10/5/07. The ReSET method uses the energy balance equation Rn = λE +H +G to estimate ETa, where Rn is the net incoming radiation, H is sensible heat flux, and G is heat conduction to the ground, and λE is the latent heat flux. Latent heat flux is estimated from the remainder after all the other energy fluxes have been
Manzanola Site Swink Site Arkansas River Rocky Ford
estimated (Bastiaanssen et al., 1998). Through ReSET, daily ETa estimates were
calculated on a 30 m x 30 m grid resolution. Figure 2 depicts a satellite image from May 30, 2007 showing the variation of ETa at both field sites.
Daily reference crop ET (ETo) was obtained through a Colorado Agricultural Meteorological Network (CoAgMet) station located at Rocky Ford (Colorado Climate Center, 2007). The station is approximately 6 km from the Swink site and 14 km from the Manzanola site. The ETo used is a Kimberly Penman alfalfa reference crop ET. ETo was also estimated using two ETgage™ monitors (Berrada, 2001) located at each site to check the values from CoAgMet. Twenty-four hour readings were taken from the evening prior to the date of the satellite image to the evening on the date of the satellite image in order to estimate ETo each time that an ETa value is produced from the remote-sensing
methodology. An average value was taken of the two monitors at each field, and this value was recorded as the site’s ETo value.
Water table depth was measured in numerous monitoring wells drilled at each site. 33 monitoring wells were installed at the Swink site on a 60 m grid, and 22 wells were
installed at the Manzanola site with approximately 45 m spacing on an irregular grid. Well locations are shown by the dots in Figure 2. Average well depths reached approximately 3 m. Manual readings of water table depth were collected with an electric tape in each well whenever the satellite passed overhead. In addition, measurements were made weekly throughout the summer and at least monthly during the fall. Hobo® Water Level Loggers were submerged in 13 of the 33 wells at the Swink site and 15 of the 22 wells at the
Manzanola site. Wells containing loggers are depicted as red dots in Figure 2. The loggers measure water table depths each hour. One logger at each field site was used to measure atmospheric pressure for use in water table depth calculations.
Figure 2: ETa estimates from satellite imagery as shown on (a) the Swink site and (b) the Manzanola site. Monitoring wells are shown as filled in circles with red circles being those wells with water level loggers.
Precipitation was measured using two Davis Instruments Rain Collector II tipping bucket rain gauges at each site, which measure 0.254 mm increments of rainfall. The gauges were located in separate open areas at each site, approximately 1.25 m above the ground. Periodic checks ensured minimal interference from obstructions in the gauges.
(b) (a)
Daily totals were calculated for each gauge, and then the average precipitation at each site was estimated from the two gauges.
Additional measurements were made at each site but are not analyzed in this paper. Gravimetric measurements of soil moisture were taken at depths of 0.30 m, 0.61 m, 0.91 m, and 1.22 m depths. Soil salinity was measured at each well using an EM-38, and the normalized difference vegetation index (NDVI) was estimated from the Landsat5 images. The significance of these characteristics will be discussed in a future paper.
3. Results
Figure 3 shows the daily precipitation, average water table depth, and ETo for both the Swink and Manzanola sites. In the figure, CoAgMet ETo refers to ETo values from the CoAgMet station, Field ETo refers to the average of the ETgage™ values from each field. The dashed vertical lines indicate the dates of the usable LandSat images. The water table depth is the average depth calculated from all wells with water level loggers at each site. The average water table depths do not vary much throughout the season with the Swink site ranging from approximately 1.5 m to 2 m and the Manzanola site ranging from 0.8 m to 1.3 m. The relatively stable depth at the Manzanola site is thought to be a result of steady seepage from the adjacent canal. The more variable depths observed at the Swink site is most likely due to nearby groundwater pumping and irrigation. Total precipitation during the study period measured 0.23 m at Swink and 0.26 m at Manzanola. Total CoAgMet ETo was 1.10 m.
A simple water balance approach can be used to assess how much of the ET is supplied by groundwater upflux. The fluxes included in the water balance are: infiltration,
groundwater upflux, and ET. Due to the dry conditions at the sites, lateral flow in the vadose zone can be safely neglected. For the same reason, it is assumed that all precipitation infiltrated into the soil during the study period. If changes in storage are neglected, the groundwater upflux can be roughly estimated as the ET minus the
precipitation. To calculate the ET, an ET efficiency is first calculated on each date with a satellite image as ETa / ETo, where ETo is the CoAgMet value. The ET efficiencies for adjacent satellite dates were averaged to get ET efficiencies for the intervening periods. The ET efficiency was then multiplied by the daily ETo values from CoAgMet to estimate the actual ET on each day. The daily ET values were then summed to obtain the
cumulative ET over the observation period. The total estimated ETa was 0.80 m at the Swink site and 0.70 m at the Manzanola site. Precipitation was then subtracted from the cumulative ET to estimate the cumulative groundwater upflux during the observation period. Figure 4 displays the cumulative groundwater upflux for each site over the study period. The results of this analysis show that, on average, 3.4 mm/day of groundwater was lost to ET at Swink and 2.6 mm/day was lost at Manzanola during the study period. Total cumulative upflux from Swink is estimated to be 0.57 m and 0.44 m at the Swink and Manzanola sites respectively. This suggests that 71%, for the Swink site, and 62%, for the Manzanola site, of total estimated ET was supplied by groundwater upflux.
The relationship between ET and groundwater depth was investigated to determine how much ET variability both in space and in time can be explained by changes in the depth to ground water. Figure 5 plots the average ET efficiency against the average water
table depth for each well. The Pearson correlation coefficient is only 0.05 for the data at the Swink site. One explanation for this low value is the relatively narrow range of water table depths (1.08 m) encountered at this site. A range in water table depth of 1 m may not be enough to impact ET. The data from the Manzanola site show a stronger relationship with a Pearson correlation of -0.69 between depth to ground water and ET. This
relationship indicates that lower ET values are associated with larger water table depths. The dataset from the Manzanola site contains greater variation in the average water table depth (2.73 m). This greater range is considered a primary reason why the Manzanola site shows a relationship while the Swink site does not.
Figure 3: Daily precipitation, field reference ETo, CoAgMet ETo, and average field-wide water table depth are shown in (a) the Swink site and (b) the Manzanola site.
Figure 4: The cumulative groundwater upflux (mm) lost to ET at the Swink
site and the Manzanola site.
An equivalent analysis was done for both sites to examine whether temporal variability in ET was associated with temporal variations in the average depth to groundwater. The spatial average ET efficiency and the spatial average groundwater depth were calculated for both fields on each satellite date. However, these two variables did not exhibit a significant association in either field.
4. Conclusions
The study results demonstrate that the shallow water tables at both uncultivated study sites contribute significantly to ET. A rough water balance indicates that groundwater upflux contributed an average of 3.4 mm/day to ET at the Swink site and 2.6 mm/day at the Manzanola site. Thus, the upflux contributes roughly 62-71% of the water for ET at these sites, which have average water table depths of 1 to 2 m. A study by Burkhalter and Gates (2005) indicates that about 50% of a study region in the Lower Arkansas River Valley was uncultivated and that 16-33% of this same region has a water table within 2 m of the ground surface. Thus, the results from our two study sites are expected to be typical for a significant portion of the valley, and it is possible that significant water losses are occurring due to the upflux from shallow water tables under uncultivated lands. At one of the two fields, the Manzanola site, spatial variations in ET were associated with variations in the water table depth (a Pearson correlation of -0.69). These results hint that lowering the water table may reduce the ET from uncultivated lands, but much more investigation is
Average ~2.6 mm/day Average
needed to assess this possibility. At the Swink site, no relationship was observed between the variations in ET and the variations in depth to groundwater. Other variables such as vegetation density and greenness are expected to play a more significant role at this site. This issue will be examined in detail in a future study.
Figure 5: The average ET efficiency plotted against the average water table
depth at each well at (a) the Swink site and (b) the Manzanola site. Pearson correlation coefficients are inset in each graph.
Correlation = -0.69 Correlation = 0.05
References
Banta, E.R., 2000: MODFLOW2000, the U.S. Geological Survey Modular GroundWater Model
-- Documentation of Packages for Simulating Evapotranspiration with a Segmented Function
(ETS1) and Drains with Return Flow (DRT1). U.S. Geological Survey Open-File Report, 00-466, 127 p.
Bastiaansen, W., Menenti R., Feddes, R. and Holtslag, A., 1998: A Remote Sensing Surface Energy Balance Algorithm for Lands (SEBAL). Journal of Hydrology, 212–213, pp.198–229. Berrada, A., Hooten, T.M., Cardon, G.E., Broner, I., 2001: Assessment of Irrigation Water
Management and Demonstration of Irrigation Scheduling Tools in the Full Service Area of the Dolores Project: 1996-2000 Part II: Calibration of the Watermark Soil Moisture Sensor and ETgage Atmometer. Colorado Agricultural Extension Station Technical Report, TR01-7. Burkhalter, J.P., and. Gates, T.K, 2005: Agroecological Impacts from Salinization and
Waterlogging in an Irrigated River Valley. Journal of Irrigation and Drainage Engineering, ASCE, 131(2), pp. 197-209.
Burkhalter, J.P., and Gates, T.K. 2006: Evaluating Regional Solutions to Salinization and
Waterlogging in an Irrigated Valley. Journal of Irrigation and Drainage Engineering, ASCE, 132(1), pp.197-209.
Colorado Climate Center, 2007, CoAgMet Homepage. http://ccc.atmos.colostate.edu/%7Ecoagmet/index.php
Cooper, D.J., Sanderson, J.S., Stannard, D.I. and Groeneveld, D.P., 2006: Effects of Water Table Drawdown on Evapotranspiration, Vegetation Composition and Leaf Area in an Arid Region Phreatophyte Community. Journal of Hydrology, 325, pp. 21–34.
Elhaddad, A., Garcia, L.A., 2008: Surface Energy Balance-Based Model for Estimating Evapotranspiration Taking Into Account Spatial Variability in Weather. ASCE Journal of
Irrigation and Drainage – In Press.
Gates, T.K., L.A. Garcia, and J.W. Labadie, 2006: Toward Optimal Water Management in Colorado’s Lower Arkansas River Valley: Monitoring and Modeling to Enhance
Agriculture and Environment,” Colorado Water Resources Research Institute Completion
Report No. 205, Colorado Agricultural Experiment Station Technical Report, TR06‐10.
Nichols, W.D., 1994: Groundwater Discharge by Phreatophyte shrubs in the Great Basin as Related to Depth to Groundwater. Water Resources Research, 30(12), pp. 3265-3274.
Nichols, W.D., 2000: Regional Groundwater Evapotranspiration and Groundwater budgets, Great Basin Nevada. US Geological Survey Professional Paper, pp. A1-A13.
Wichelns, D., 1999: An Economic Model of Waterlogging and Salinization in Arid Regions.
Ecological Economics, 30, pp. 475–491.
Young, C., and Coauthors, 2007. Modeling Shallow Water Table Evaporation in Irrigated Regions.