Financial Structures of
Family Firms within the
GGVV-Region
MASTER THESIS WITHIN: Business Administration NUMBER OF CREDITS: 15
PROGRAMME OF STUDY: International Financial Analysis AUTHOR: Louise Bäck & Essame Allali
JÖNKÖPING May 2021
Acknowledgements
We take this opportunity to thank the people involved in helping us finish this paper.
Firstly, we would like to show our appreciation to our supervisory Haoyong Zhou for his constant guidance and support through this thesis. For directing us in the appropriate direction along with believing in our abilities.
Secondly, a big thank you to our fellow students for your help and encouragement during this process. A special thank you to Carl Jönsson Asp and Gordon Molander for your honest opposing comments and constant guidance towards bettering our paper.
Thirdly, we are obligated to thank the companies participating in our questionnaire for the valuable information they provided and for making this paper possible to carry out. Without your contribution we would not have been able to perform this testing.
Fourthly, we would like to thank Per-Magnus Johansson for his valuable knowledge of the GGVV-region. We truly appreciate the time and effort you put in when sharing your expertise with us.
Thank you!
Jönköping, May 24th 2021
Master Thesis in Business Administration
Title: Financial Structures of Family Firms within the GGVV-region Authors: Louise Bäck & Essame Allali
Tutor: Haoyong Zhou Date: 24th of May 2021
Key terms: Family firms, Financial structure, GGVV-region, debt ratio, first-generation family firm, non-first-generation family firm.
Abstract
Background: The firm’s choice of the optimal financial structure remains an unsolved problem
within finance. The reasoning behind family firms’ specific financial structure differs within various research. The GGVV-region is composed of four small municipalities: Gnosjö, Gislaved, Värnamo, and Vaggeryd. This region is seen as the best dynamic counties in all of Sweden, it is also considered the most successful area of the countryside in terms of its economic contribution. Because of these aspects, it is therefore of great importance to investigate the difference of the financial structurewithin generations of family firms.
Purpose: This paper studies whether there is a correlation between the generation in charge of
family businesses within the GGVV-region and the financial structure of the businesses.
Aim: The aspiration is that this research will be a good addition to the understanding of family
businesses in the GGVV-region along their financial policies within different generations running the firm.
Method:This study will contain 42 family firms within the GGVV-region defined as family firms through a questionnaire. The financial structure of the first-generation and non-first-generation family firm will be investigated using their debt ratios throughout the years 2015-2019. The testing is performed through Panel Data Model using Random Effects Model, along with descriptive statistics of the data and a Difference-in-Difference test.
Conclusion: No significant difference can be found at any level between the 1GFF and the
Table of Contents
1. Introduction ... 1 1.1 Background ... 1 1.2 Research Problem... 1 1.3 Purpose ... 2 1.4 Research Question ... 3 1.5 Delimitation ... 3 1.6 Key Definitions ... 4 2. Frame of Reference ... 52.1 The Definition of Family Businesses ... 5
2.2 The Importance of Family Businesses ... 6
2.3 The GGVV-Region ... 7
2.4 Stages of Development Within the Family Business ... 8
2.4.1 The Foundation Stage ... 8
2.4.2 The Children’s Involvement ... 8
2.4.3 The Union of Relatives ... 9
2.5 The Financial Structure in Companies ... 9
2.6 Financial Structure Versus Capital Structure of Companies... 9
2.6.1 Financial Structure ... 9
2.6.2 Capital Structure... 10
2.7 Components of The Financial Structure ... 10
2.8 Studies of Family Businesses and Capital Structure ... 11
3. Methodology ... 12 3.1 Scientific Methodology ... 12 3.2 Research Approach ... 12 3.3 Data Collection... 13 3.4 Questionnaire Design ... 14 3.5 Data Analysis ... 15
3.5.1 Research Study Sample ... 15
3.5.2 Dependent Variables ... 15
3.5.3 Independent and Controlling Variables ... 16
3.6 Analysis Method ... 16
3.6.1 Descriptive Statistics ... 17
3.6.2 The Panel Data Regression Model ... 17
3.6.2.1 The Breusch-Pagan Lagrance Multiplier Test ... 17
3.6.3 The Random Effects Model ... 17
3.6.4 Difference-in-Difference Test ... 18
3.7 Reliability and Validity ... 18
4. Result & Analysis ... 19
4.1 Descriptive Statistics ... 19
4.2 The Panel Data Regression Model ... 19
4.2.1 The Breusch-Pagan Lagrange Multiplier Test ... 19
4.2.2 The REM Regression ... 20
4.3 The Result of the Difference-to-Difference Test ... 21
4.4 Testing of the Hypotheses ... 21
5. Conclusion & Discussion ... 22
5.3 Recommendations ... 23
Reference List ... 25 Appendix ... 28
Abbreviations
CEO Chief Executive Officer et al. And others
H1 Hypothesis 1 H2 Hypothesis 2 H3 Hypothesis 3
LLC Limited Liability Company
Tables
Table 1: Family Firms Contribution in European Countries ... 7
Table 2: Descriptive Statistics ... 19
Table 3: Results of the Breusch-Pagan Lagrange Multiplier ... 19
Table 4: Results of the REM ... 20
Table 5: Result of Difference-to-Difference ... 21
Appendix
Appendix 1: Survey ... 28Appendix 2: Descriptive Statistics ... 32
Appendix 3: Normality Test ... 33
Appendix 4: Breusch-Pagan Lagrange Multiple Test ... 33
Appendix 5: Pooled OLS ... 34
Appendix 6: Random Effects Model ... 34
1. Introduction
_____________________________________________________________________________________ This section describes the background and the research problem, following the introduction of the purpose and the different delimitations faced. Lastly, are the essential definitions of terms used in this paper included.
___________________________________________________________________
1.1 Background
The choice by the firm of the optimal financial structure remains an enigma and an unsolved problem in the literature of finance (Ampenberger et al., 2013). According to Rajan and Zingales (1995), the following four factors influence the company's debt significantly: profitability, the tangibility of assets, opportunity for growth, and the company's size.
Family businesses are the oldest and most common form of business organization in the world. They represent the vast majority of businesses, accounting for between 60 % and 80 % of all established businesses. Family business is a global phenomenon that is not limited to one country without the other (Gersick et al., 1997).
The GGVV-region is composed of four small municipalities: Gnosjö, Gislaved, Värnamo, and Vaggeryd. This region is considered one of the best dynamic counties in all of Sweden. It is also considered the most prosperous area of the countryside regarding its economic contribution (Hudson & Rönnblom, 2007). All in all, the counties have more than 12,000 companies registered and running (Statistikmyndigheten SCB, 2021). Furthermore, the GGVV-region has, from a Swedish perspective, high employment within the industry and low unemployment ratios (Gnosjöanda - Uppslagsverk - NE.se, 2021).
1.2 Research Problem
Many have in previous work been focusing on the financial aspects of family businesses. As mentioned in Sonfield and Lussier's work (2004), there are previous research within the area of family businesses and their financing conducted by Cole and Wolken (1995) and Coleman and Carsky (1999). It found that newer and smaller family firms use more
debt and less equity than large and more established companies when financing their business.
However, the research has been contradicting, where others have found first generational family businesses being unwilling to take on debt as to finance the business. This research suggests that family firms, compared to non-family ones, tend to use more equity than debt (Bork et al., 1996, as cited in Sonfield & Lussier, 2004). Furthermore, looking into whether socioemotional wealth (SEW) affects the family firms' financing decisions is a relatively new part of the research of family businesses and their financing decisions. The concept was introduced by Gómez-Mejía et al. (2007). These researchers have defined the SEW as a non-financial part of the business that meets the family's emotional needs rather than meeting their financial needs. Some examples of these emotional needs could be upholding the family era, the character of the family and firm, and practicing family influence. The introduction of SEW and its research suggests that if the SEW protection of the company and the family is high, they will use less debt in their financing.
Previously, most of the studies are directing and focusing mainly on non-family and managerial businesses. Little research has been done on the financial structure of family businesses and their generational differences. Also, the available research differs from how each generation of the family firms are financing themselves (Baixauli-Soler et al., 2020).
To the best of our knowledge, no previous work on the financial structure of family businesses within the GGVV-region exists. Therefore, this study will be focusing on the differences among first and non-first generational family firms within the area when it comes to financing decisions. Thus, the particularity of the financial structure of family businesses lies in the family's involvement, whose ultimate objective is the sustainability and continuity of the company (Danes et al., 2008).
1.3 Purpose
The purpose of this paper is to find out whether there is a correlation between the generation in charge of a family business within the GGVV-region and the business's
financial structure. Also, it will investigate whether any of the controlling variables of age or size has an effect on the debt ratio of the family firms within the GGVV-region.
Furthermore, we hope our research will be an excellent addition to knowledge of the family businesses in the GGVV-region and its financial policies among the different generations running the firms.
1.4 Research Question
This study will aim to answer the following question:
• Is there a correlation between the generation in charge of a family business within
the GGVV-region and the company's financial structure?
More specifically, this paper will test the following hypotheses:
H1: There is no relationship between the family generation in charge of the business and its debt ratio.
H2: There is a positive relationship between the family generation in charge of the business and its debt ratio.
H3: There is a negative relationship between the family generation in charge of the business and its debt ratio.
1.5 Delimitation
The scope of our study is limited to the South of Sweden. More specifically, limited to the GGVV-region as well as the finance industry of the area. Further, every researcher or student in the financial field faces the main challenge of identifying the family businesses and the data limitation concerning this type of firm. There is no specific listing of family businesses within the area. This is a common problem as there is no established universal definition of a family business. Therefore, we will reach out to affected companies through a web-based survey to identify the family firms within the GGVV-region and which generation runs each of them.
Furthermore, there are limitations to which companies' financial data is officially reported and not. Therefore, the aim is to track down the family companies within the region registered as an LLC (in Swedish Aktiebolag, AB). Also, there will be instances where multiple generations are present in the running of the firm. In this case, we will consider
the generation obtaining the CEO position or any similar leading position to be running the family business.
Through this research, and due to these limitations, the study will include 42 companies extracted from the data collected. The results should not be transferable to another area as they only relate to, and reflect, the GGVV-region.
1.6 Key Definitions
Family Firm: The European Family Businesses (EFB) defines companies as family
businesses if they comply with several criteria. Firstly, there is a minimum of one person of the family and/or relatives to the family to officially be engaged and involved in the organization. Secondly, the people who created the business, or relatives such as children, children's immediate family, spouses, or parents, should stand for most of the company's decision-making. Thirdly, "the majority of decision-making rights are indirect or direct" (European Family Businesses - Definition, 2021). Fourthly, the creator of the company, or any relative within the family, should together account for at least 25% of the ruling, originating from their shared investment, when it comes to votes or similar decision-making (European Family Businesses - Definition, 2021).
First-Generation Family Firm (1GFF): The founding generation owns and manages
the family firm, the member involved in the administration must be more than one (Sonfield and Lussier, 2004).
Non-First-Generation Family Firm (Non-1GFF): The second-, third-, or
fourth-generation, owns and manages the family business, and that after either the retirement or the death of the first, and/or second and third, generation (earlier members/founders).
GGVV-Region: The GGVV-region is composed of four small counties: Gnosjö,
Gislaved, Värnamo, and Vaggeryd, located in South Sweden (Hudson & Rönnblom, 2007).
2. Frame of Reference
_________________________________________________________________________________ This section describes the theoretical framework, emphasizing the research to understand this thesis's general context better. It also defines a family business and its importance and financial structures while touching upon financial and capital structuring. Lastly, this section mentions the significance of this area of research.
______________________________________________________________________
2.1 The Definition of Family Businesses
In principle, family businesses use the exact definition of ordinary businesses in their different legal formulas, except that it includes the family dimension, which adds ambiguity and difficulty in adopting a clear and precise description of the family business (Astrachan, Klein, & Smyrnios, 2002). Faced with this ambiguity in the definition of the family business, Anderson and Reeb (2003) put three criteria to define a family business. The first criterion is: a company is a family firm if the family owns shares of the company. The second criterion is: there is an emotional perception by the family running the business that it is, in fact, a family firm. The third criterion is: at least one of the family members is within the management of the business.
Through these approaches, many definitions have emerged, perhaps the most important of which are the ones of the European Family Businesses (EFB) and the International Finance Corporation (IFC).
The EFB, a part of the EU federation of national associations, defines companies as family businesses if they comply with several criteria. Firstly, there is a minimum of one person of the family and/or relatives to the family to officially be engaged and involved in the organization. Secondly, the people who created the business, or relatives such as children, children's immediate family, spouses, or parents, should stand for most of the company's decision-making. Thirdly, "the majority of decision-making rights are indirect or direct" (European Family Businesses - Definition, 2021). Fourthly, the creator of the company, or any relative within the family, should together account for at least 25% of the ruling, originating from their shared investment, when it comes to votes or similar decision-making (European Family Businesses - Definition, 2021).
The IFC has defined the firm as a family business if the majority of votes are in the hands of the controlling family, the founder(s) intends to pass the company on to future generations, and the firm takes on, at least one, of the following terms: family business enterprise, family enterprise, family business, owned business enterprise, family-owned business, and family-family-owned company (International Finance Corporation, IFC, 2018).
The survey basing this paper will use the definition of EFB, which will determine whether the company within the GGVV-region is a family business or not. The EFB definition derives from an EU federation, suggesting the definition will be in place for an established time, has high trustworthiness, and affects the research area as it is a part of Sweden and the EU.
2.2 The Importance of Family Businesses
Family businesses occupy an essential place in many countries' economies of the world, regardless of the diversity of the economic approaches of these countries or their position on the map of the world economy (Venter & Farrington, 2009).
Wtterwulghe and Janssen's survey (1997) revealed that 82% of SMEs are majority-owned by the manager and/or his/her family. Also, they found that family members run 71% of these businesses. In the United States, more than 90% of companies are controlled and owned by one or more families. Together they represent between 30 to 60% of GNP, estimated by Astrachan and Kolenko (1994). According to Crouzet (1995), the percentage of family businesses in the European Union varies between 75% and 99%, depending on the country.
The International Family Enterprise Research Academy, IFERA, conducted a study on family businesses, large companies, and SMEs, carried out in 45 countries. The study results show that these companies are dominant in most European countries in terms of number and contribution to GNP (IFERA, 2003).
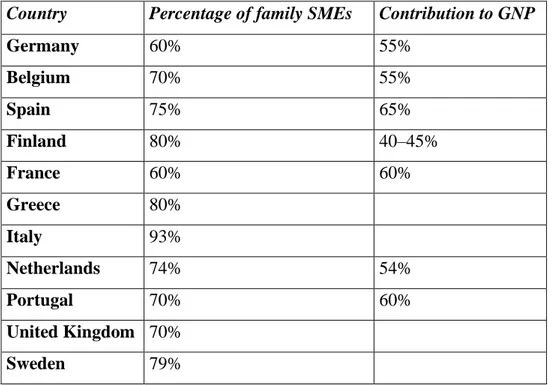
Table 1: Family Firms Contribution in European Countries
Country Percentage of family SMEs Contribution to GNP
Germany 60% 55% Belgium 70% 55% Spain 75% 65% Finland 80% 40–45% France 60% 60% Greece 80% Italy 93% Netherlands 74% 54% Portugal 70% 60% United Kingdom 70% Sweden 79%
Source: Own illustration based on IFERA (2003).
2.3 The GGVV-Region
Often the GGVV-region has been called "Plastriket," freely translated into the Kingdom of Plastic. Gislaved mainly produces plastic, while Värnamo primarily focuses on the rubber industry, and Gnosjö focuses on the metal industry. Besides, Gnosjö has more than one company per 20 citizens which is the highest in all of Sweden. In comparison, counties in the same size category as Gnosjö usually have one company per 600 citizens (Nordmark, 2018).
Nevertheless, the region is known by a specific term, "Gnosjöandan," freely translated to the Spirit of Gnosjö. It stands for a particular form of life, both in the Gnosjö county and in the surrounding counties. In this region, the banks, the counties' administration, and labor unions settle their way of working to comply with the companies within the area (Gnosjöanda - Uppslagsverk - NE.se, 2021). When trying to explain why Gnosjö stands out compared to similar counties, the research found that Gnosjö has a more prominent involvement within the local area. There is a lot of cooperation between the companies, where you will help one another. Also, the industry is very engaged with different sports clubs and non-profit organizations within the region, something that the research did not find within the other counties similar to Gnosjö (Nordmark, 2018).
Together all four counties have a collected revenue of 70 billion Swedish Kronor, SEK. The export of the GGVV-region is larger than imports, with a direct export value of 12 billion SEK. Within the past 15-20 years, the Swedish export has increased by about 49%. Meanwhile, the value of Jönköping's administrative province increased by nearly 65% where Gnosjö county has the largest exporting companies per capita, followed by Gislaved and Värnamo (Nordmark, 2018).
2.4 Stages of Development Within the Family Business
The family businesses generally go through three stages of development, described by particular characteristics, summarized into three phases (IFC, 2018).
2.4.1 The Foundation Stage
The foundation stage is the first step to establishing the family business, and the founder(s) own the company's entire management. Some founder(s). may consult a few external consultants or colleagues, but they will make most of the significant decisions themselves. Here a firm commitment from the founder(s) in working for the business to succeed leads to describing the company with a fluid governance structure (IFC, 2018).
Generally speaking, this stage contains few corporate governance problems compared to the following two steps, since both control and ownership are still in the same person's hands, the founder(s). Perhaps the most critical problem during the founder(s) time within the business is the transfer of ownership. To get to the next stage, the founder(s) should make necessary efforts to plan the transfer of ownership and prepare the next leader of the business to ease the succession process (IFC, 2018).
2.4.2 The Children’s Involvement
In this stage, the management and ownership of the business transfer to the founder's children. Due to more family members engaged within the business, the management issues will become relatively more complex than at the earlier stage. Some of the most common challenges include maintaining homogeneity among children, organizing work processes and procedures, establishing effective communication channels between family members, and setting up a transition plan for crucial administrative positions (IFC, 2018).
2.4.3 The Union of Relatives
In this stage, the management of the business becomes more complex with the growing rapprochement of family members in the affairs of the company, either directly or indirectly, including nephews, cousins, and in-laws. Since people are from different generations and branches of the family, their ideas may differ on running the business and defining its overall strategy. Moreover, conflicts will likely pass on from the siblings in the previous stage to this step. As a result, this step contains the most family governance issues. Some of the most well-known problems of family businesses at this stage are the employment of family members, rights of shareholders in the family, liquidation of shares, dividend distribution policy, the role of family members in the business, conflict resolution within the family, as well as the vision and mission of the family (IFC, 2018).
2.5 The Financial Structure in Companies
The financial structure has received significant attention from many researchers in previous studies. All companies' need for funds makes studying the financial structure important, as highlighted in those studies. The sources of self-financing manage the companies' survival in the contemporary business environment. These sources are external financial sources represented as short and long-term liabilities, in other words, bank credits and the right of ownership. The financing decision determines how the company will obtain the funding sources, whether the financing is solely through ownership or a combination of ownership with adding debt. The decision determines the ratio for each of these sources. This ratio is the financial structure of the specific company (Harris & Roark, 2019).
2.6 Financial Structure Versus Capital Structure of Companies
2.6.1 Financial Structure
The financial structure refers to the combination of sources from which the company obtained funds to finance its investments. It includes all the elements that make up the liabilities side, whether those elements are long-term or short-term, whether they are debt or equity funds. Notice that the concept of the financial structure differs from the concept of the capital structure, where the first includes all financial sources. In contrast, the second contains only long-term financial sources (Nicodano & Regis, 2019).
2.6.2 Capital Structure
The term capital structure refers to using solely financial sources from equity and long-term loans, defining the long-term as a mixture of long-long-term debt and equity (Brealey et al., 2007). Ross et al. (2009) do not distinguish between the capital structure and the financial structure; they give one definition to these terms. The definition is the combination of long-term debt and equity that the company uses to finance its business. The capital structure is not fixed but instead changes the weighted average cost of the capital, WACC. In this definition, the authors excluded short-term debts from funding sources.
𝑾𝑨𝑪𝑪 = 𝑬
𝑽∗ 𝑹𝒆+ 𝑫
𝑽∗ 𝑹𝒅∗ (𝟏 − 𝑻𝒄) Where:
E is the market value of the firm’s equity, D is the market value of the firm’s debt, V = E+D,
Re is the cost of equity,
Rd is the cost of debt,
Tc is the corporate tax rate.
Gitman and Zutter (2012) indicate that the capital structure affects the leverage ratio in the capital structure on the return and risk. The authors defined the capital structure as being from the company's mix of debt and equity. The capital structure, as an area, links to other financial decisions, which creates complex financial decisions. Their review on types of capital shows that all the elements on the left side of the company's balance sheet, including short-term commitments, are sources of capital. That is their definition of the financial structure. Here the two authors used the term capital structure to express the total financial sources, contrary to the usual coincidence of the term financial structure.
2.7 Components of The Financial Structure
The components of the financial structure explain how the company finances its long- and short-term needs, such as purchasing fixed assets, raw materials, or financing other expenses necessary for the continuation of the company's activity. Studies have differed in the division of financial sources. The components of the financial structure are
short-funds that the company obtains and is obligated to return within a period that does not usually exceed a year, as its usage is financing the needs for working capital. The short-term financial sources trade- and bank credit, while the long-short-term sources of funding are long-term loans (Prasad et al., 2001).
2.8 Studies of Family Businesses and Capital Structure
In previous studies, there is none related to the financial structure of family businesses within the GGVV-region. However, several studies with family businesses, or capital structure, were conducted in other countries similar to the current research.
A study in China examined the determinants of the capital structure in companies listed on the Chinese financial market, using a panel of data at the company level. The results showed that the economic nature of the Chinese business environment and that modern monetary theory of capital structure has an apparent effect on the Chinese market by stating that the factors suitable for developing economies match specific market.
Deesomsak et al. (2004) examined the determinants of the capital structure within the corporate financial and legal environment. The study sample consisted of companies operating in the East Asia region: Malaysia, Thailand, Australia, and Singapore. This study found the following results: The companies' decisions on capital structure are affected by the environment they operate, which is similar to the companies' specific factors identified in the previous studies. Also, the financial crisis of 1997 had a statistically significant impact on capital structure decisions, but the effect was different.
A study conducted by Hall, Hutchinson, and Michaelas (2004) aimed to test the degree of differences in the determinants of the capital structure between European countries. They were basing the study on data from 4,000 companies in eight European countries, where each country's share was 500 companies. The researchers used regression analysis to discuss the relationship between long and short-term debt as the dependent variable while having profitability, growth, asset structure, size, and age as the independent variables. This analysis concluded that the variation in results is due to differences between countries and companies themselves.
3. Methodology
_____________________________________________________________________________________ This section contains the scientific methodology and the research approach to this paper. Following is the data collection and its process along with the survey explained. After that follows, the data analysis, and the analysis method. Lastly, the legitimacy and trustworthiness are touched upon.
______________________________________________________________________ According to Dul & Hak (2008) research methodology is the set of steps and procedures that a researcher performs to conduct his/her research. To this end, research must respect the process of verifying the scientific quality of the work in producing objective and relevant result.
3.1 Scientific Methodology
This study uses a quantitative approach by aiming at collecting observable and quantifiable data. The researchers are describing, explaining, controlling, and predicting the made observation, which is independent of who is performing the testing. The study’s basis is on data collection techniques; hence reliability and validity are in theory guaranteed. The quantified data allows descriptive analyzing, tables, graphs, and statistical analysis to find links between variables and factors, correlation, or other examining. In addition, this paper uses an inductive research approach since the study tests if there is a difference between first and non-first-generation family firms.
3.2 Research Approach
The research of this paper is carrying out experimental methodology, a scientific process consisting of validating the hypothesis using repeated tests. It is a scientific and systematic approach of research where the researcher processes one or more variables, controls, and measures any changes in the other variables (Guala, 2005).
According to Christensen et al. (2011), the experimental method has several advantages and disadvantages. The benefits include confidently knowing the effect of the independent variable in relation to the dependent. Another advantage is that the experimental methodology adjusts the external variable that affects the dependent variable, which helps determine the effect of the independent variable on the dependent
variable more accurately and assesses the degree of that effect. Lastly, an advantage is the possibility to apply this methodology to many cases through the variety of its designs.
However, there are some disadvantages as well:
1. It does not seem easy to apply this methodology to human phenomena because of the conditions it requires. These conditions include controlling the variables affecting the studied phenomenon, randomly selecting the research sample, randomly assigning the sample members to two groups, and randomly selecting the control and experimental groups.
2. It depends on an artificial environment that is inconsistent with the reality of the studied phenomena and, therefore, the solutions.
3. The experiment depends upon the sample, but the results depend on the population.
Therefore, the selection may not represent the research community. Thus, it is not easy to generalize the results.
This study will determine if there is a relationship between the variables family generation and debt ratio. Also, it will test the controlling variables of age and size of the businesses within the GGVV-region to see whether any of them can explain the debt ratio of the companies.
3.3 Data Collection
This research has been carried out by collecting first-hand data through an online questionnaire from EsMaker. The survey has been sent out to companies matching our criteria which has been decided through knowledgeable people of the GGVV-region. When collecting the data there are certain criteria each company must comply with to be considered in the sample of this research.
Firstly, they are an LLC (AB in Swedish) since their legal form obliges the companies to have their financial data public. Secondly, the CEO, or a person in similar position of the company, is targeted to answer the electronical survey sent out. As they are the head of the company, they are familiar to the business’ decision-making processes and owners.
Thirdly, if multiple generations of the family are active within the company the determine factor for which generation the company is in is determined through which generation the CEO, or a person in similar position, is in. Hence, the generation with the most power within the company.
Fourthly, the definition of a family firm from the EFB contains four criteria, for a company to be defined as a family firm they will need to have answered yes to all four questions related to the definition. Simply feeling like they are a family business will not cut it. Fifthly, the company needs to be able to be contacted over email or a questionnaire online on their webpage. Businesses without such tool were deselected as they would be unable to answer the question.
The sampling process started off by identifying potential family firms within the GGVV-region. A list was created through the help of people well familiar to the area who were able to state whether the company has a potential of being a family firm or not. Each selected company’s email was collected through their own webpage. Since, the multiple criteria applied to the search of companies would reduce the total number of potential family firms, emphasis was put on making each email containing the survey personally sent out, to increase the answers. Out of 321 send out emails, 75 were answered which is an answering rate of 23%. Out of the answers, some were deselected as they did not comply with all criteria of being a family firm, operating within the selected region, or being an LLC.
Therefore, in total, the sampling of confirmed family firms by the definition of EFB, within the region, and an LLC was 42, where 12 were 1GFF and 30 were Non-1GFF. The Non-1GFF consists of 17 second-generation family firms, 9 third-generation family firms, and 4 fourth-generation family firms leaving the group to be differently spread out through older generations than the first.
3.4 Questionnaire Design
The published survey on EsMaker contains three parts: The first part is an introduction to the work along with space for participating business to consent to the GDPR-laws. The second part contains the actual questions asked in English and the third part contains the
questioned asked in Swedish. To see the whole survey, please view Appendix 1. Question 1 “Which company do you represent” is created to call for no mistakes of which company is answering the survey. The second question, “would you consider your business a family firm?”, focuses on showing that a lot of companies do indicate them being a family firm while they might not fit our chosen definition as there is no universal definition of a family firm as mentioned earlier.
In addition, Question 3 through 6 splits up the definition of a family firm by EFB. For the company to comply as a family firm all four of these questions will have to been answered yes to. The seventh question confirms which generation is running the family firm. Along with the actual question a clarification of which generation will be the determine one is added; “If multiple generations are running the firm, please indicate which generation the CEO, or a similar position, is”. Question 8 is “is the family business operating within the GGVV-region?” which confirms premade research of it operating within the four counties of the study. Lastly, a box is located where participants can elaborate on answers they have left to clarify and give validation to the value of their answers.
3.5 Data Analysis
3.5.1 Research Study Sample
The research sample makes up of 42 Swedish LLC, which are family businesses within the GGVV-region. Twelve 1GFF, and the remaining 30 are Non-1GFF. The financial data has been extracted from the financial database: www.allabolag.se and www.hitta.se. The data is collected over the period 2015 through 2019. Following, the dependent, the independent, and the controlling variables will be presented.
3.5.2 Dependent Variables
This study takes into account the financial characteristics of family businesses through the dependent variable. Most empirical studies on the determinants of financial structure, sampled from large, listed companies, traditionally use two measures of the level of debt. The first is based on a purely accountable valuation, while the second uses the market values of equity and debt. This distinction is necessary assuming the managers of this type of company set significantly different levels of own funds and debt in terms of
account and market, mainly because of the value of the growth options of the business (Titman and Wessels, 1988).
In this specific study of family businesses in the GGVV-region, only measures that can be quantified are relevant. Therefore, the dependent variable is resulting from the information collected in form of the total debt ratio (Rajan and Zingales 1995). This variable will be measured as follows:
𝐷𝑒𝑏𝑡 𝑅𝑎𝑡𝑖𝑜 =Total Debt (Long Term Debt) 𝑇𝑜𝑡𝑎𝑙 𝐴𝑠𝑠𝑒𝑡
3.5.3 Independent and Controlling Variables
Firstly, the generation of the family firm is our independent variable and the variable of interest. It is made as a dummy variable; equal to 1 if the firm is a 1GFF and equal to 0 if it is a Non-1GFF.
Secondly, a controlling variable is the company's age which has been lagged when testing the data. According to Diamond (1989), the company's age affects the possibility of obtaining credit by the company as an aging company has proven its ability to survive the period of establishing a position in its markets. The number of years since the company's creation is the measure this study is using.
Thirdly, another controlling variable is the size of the company which has been lagged when testing the data. The size is measured by the number of people employed by the companies, dependent on each year. This choice seems more suitable and presents fewer problems compared to other alternatives of measuring the companies’ sizes. Hall & Hutchinsοn (1996) find a negative relationship between long-term debt and the company's size. Small businesses do not have a substantial funding requirement, so they rely on their funds, explaining this result.
3.6 Analysis Method
The analyzing methods are carried out by using the statistical analysis program EViews version 2020.
3.6.1 Descriptive Statistics
Like previous studies (O'Callaghan et al., 2018; Chen et al., 2011), the result section will present the descriptive statistics such as mean, median, standard deviation, and Jarque-Bera. These results reflect the companies' sample by giving a complete description of the relation between the variables of this research.
3.6.2 The Panel Data Regression Model
The data available are 42 companies through all five years (2015,…,2019), leading to 210 observations. Since all individuals are observed in all time periods (Ti=T for all i) the
panel data is balanced. The panel data type is short panel as many individuals and few time periods are presented. When using Panel Data Regression Model there are three different models most frequently being used, Pooled OLS, Random Effects Model, and Fixed Effects Model. Since the main variable of interest is a dummy in this research, and the Fixed Effect Model is not able to estimate the effects of time invariant variables, the model will be avoided (Cameron & Trivedi, 2010).
3.6.2.1 The Breusch-Pagan Lagrance Multiplier Test
Choosing between Pooled OLS and the Random Effects Model is done through Breusch-Pagan Lagrance Multiplier Test. The null hypothesis is “H0: σ2 = 0”. If the test cannot
reject the null hypothesis the Pooled OLS should be used when running the regression. Nevertheless, if the null hypothesis can be rejected the REM is more suitable for the testing.
3.6.3 The Random Effects Model
This study is using the Random Effects Model. The form of the econometric model which is carrying out the testing is:
𝒀𝒊𝒕 = 𝜶𝟎+ 𝜷𝟏𝑮𝒆𝒏𝒆𝒓𝒂𝒕𝒊𝒐𝒏 + 𝜷𝟐𝑨𝒈𝒆 + 𝜷𝟑𝑺𝒊𝒛𝒆 + 𝜺𝒊𝒕
Where:
Yit is our dependent variable representing the debt ratio.
β1Generation is a dummy variable that equals 1 if a firm is 1GFF and 0 if the firm is Non-1GFF.
Age is the lagged product of the companies’ ages. Size is the lagged product of the companies’ sizes. εit is the error term.
3.6.4 Difference-in-Difference Test
The Difference-in-Difference test assess whether the 1GFF or the Non-1GFF has a conditionally expected usage of debt between young and older firms. Both family generation and age are turned into dummies taking on a value of 1 and 0. The firm is counted to be young by containing an age of less than 30 and took an on a value of 0. On the contrary, the firm is considered old if the business is 30 years or older and will then take on a value of 1. This division of age is based on the median of the sample which took on a value of 30. Further, 1GFF and Non-1GFF are split up by taking on the value 1 for 1GFF and the value of 0 for Non-1GFF.
3.7 Reliability and Validity
The criteria chosen to define whether the company is a family firm or not is based on the definition by the EFB to properly distinguish the company as a family firm or a non-family firm. Also, in the survey, a comment function exists if there is any uncertainty towards a question's meaning or whether the participant’s answer goes along with reality. Enabling the participants to leave comments on their answers increases the reliability of the answers, thereby also the research.
Furthermore, the data collection is from small, medium, and large companies within all four counties to minimize the biases within the study and become more reliable as a representation of the area. Also, there is no industry delimitation when letting firms answer the survey, enabling more diversity within the sample. In addition, all companies have received the same email and email reminder to minimize the bias of companies participating.
4. Result & Analysis
_____________________________________________________________________________________ This section presents the Descriptive Statistics. Following are the results of the Panel Data Regression Model presented and the Difference-in-Difference Test. Lastly, is the testing of this paper’s hypotheses.
______________________________________________________________________
4.1 Descriptive Statistics
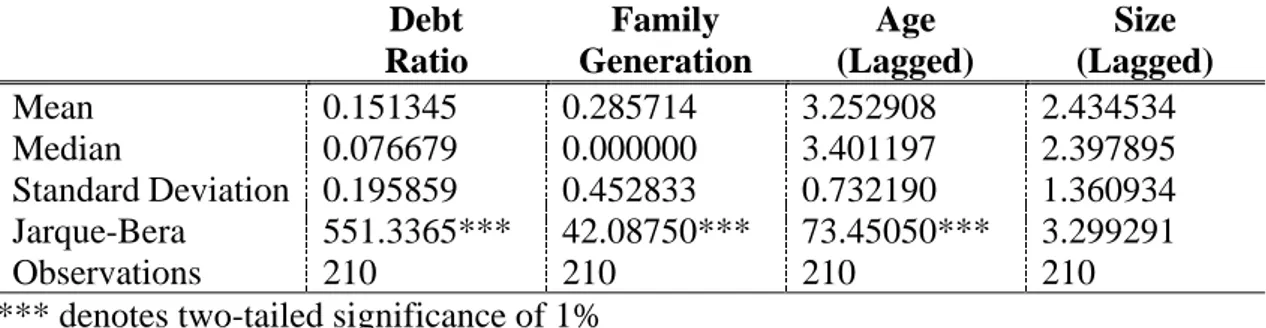
Table 2: Descriptive Statistics
Debt Ratio Family Generation Age (Lagged) Size (Lagged) Mean 0.151345 0.285714 3.252908 2.434534 Median 0.076679 0.000000 3.401197 2.397895 Standard Deviation 0.195859 0.452833 0.732190 1.360934 Jarque-Bera 551.3365*** 42.08750*** 73.45050*** 3.299291 Observations 210 210 210 210 *** denotes two-tailed significance of 1%
Source: Own illustration based on output from EViews.
Table 2 shows the results of the descriptive statistics. The debt ratio has a mean of 0.151 while the median is 0.077 which indicates that there are more lower debt ratios within the observations. Also, the Jarque-Bera of 551.3365 with a significance level of 1% indicates that the data is not normally distributed. Further, the same conclusion can be drawn from both family generation and the age variables. While the size does not give any significant resut of the Jarque-Bera Test. However, the Normality Test confirming this finding of non-normally distributed data can be found in the Appendix 2.
4.2 The Panel Data Regression Model
4.2.1 The Breusch-Pagan Lagrange Multiplier Test
Table 3: Results of the Breusch-Pagan Lagrange Multiplier
Cross Section Time Both
264.5646 1.138505 265.7031 (0.0000)*** (0.2860) (0.0000)*** *** denote two-tailed significance of 1%
When testing the Breusch-Pagan Lagrance Multiplier the p-value of 0.0000 enables the null hypothesis to be rejected at all significance levels: 10%, 5%, and 1%. Therefore, the hypothesis that the variance of the random effect equal to zero is rejected. This result is indicating that the Random Effects Model should be used in preference to the Pooled OLS.
4.2.2 The REM Regression
Table 4: Results of the REM
Variable REM Family Generation -0.043570 (0.5235) Age -0.120760 (0.0007)*** Size 0.004591 (0.7952) Constant 0.545440 (0.0000)*** Adjusted R2 0.045043 N 210
*** denote two-tailed significance of 1%
Source: Own illustration based on output from EViews.
Above in Table 4 is the results of the Random Effects Model (REM). Only the controlling lagged variable of a company’s age is significant at all significant levels, 10%, 5%, and 1%. Indicating that the age has a negative relationship to debt ratio with a value of -1.120760. Further, neither family generation nor size is significant at any level indicating they cannot explain nor affect the level of debt ratio. The adjusted R2 value is relatively low with a value of 4.50%, which makes sense as few of the variables in the model can explain the debt ratio. Therefore, no relationship of family generation and debt ratio can be found.
4.3 The Result of the Difference-to-Difference Test
Table 5: Result of Difference-to-Difference
Non-1GFF 1GFF
(a) (b) (a) - (b)
High Age (i) 0.103 0.137 -0.034
Low Age (ii) 0.205 0.140 0.065*
(i) - (ii) -0.101 -0.003 -0.098 * denotes two-tailed significance of 10%
Source: Own illustration based on outputs from Stata.
The value of the Difference-in-Difference Test is not significant at any significance level with a value of -0.098. It also indicates that there is no relationship to be found to neither Non-1GFF and 1GFF when it comes to debt ratio. Solely, the value of companies being under 30-years-old found a difference in debt ration between Non-1GFF and 1GFF with a significance level of 10%. This indicates that the debt ratio is higher in young 1GFF compared to young Non-1GFF. Therefore, we do not find any evidence that the family generation affects the debt ratio.
4.4 Testing of the Hypotheses
Below are the results obtained through the tests conducted in this study. The conclusion is that there cannot be found any difference in debt ratio between the 1GFF and the Non-1GFF. Further, there can be found a relationship between a company's debt ratio and age. Hence, the following hypothesis is rejected:
H2: There is a positive relationship between the family generation in charge of the business and its debt ratio.
H3: There is a negative relationship between the family generation in charge of the business and its debt ratio.
While these hypotheses failed to be rejected:
H1: There is no relationship between the family generation in charge of the business and its debt ratio.
5. Conclusion & Discussion
_____________________________________________________________________________________ This section concludes the paper by reaching some conclusions following a discussion and recommendations for future research.
______________________________________________________________________
5.1 Conclusions
The most reasonable interpretation of this research is that there cannot be found any correlation between the generation in charge of a family business within the GGVV-region and the business’s financial structure. The indication from both the REM Regression and the Difference-to-Difference testing is that there is no found relationship between the 1GFF and the debt ratio, nor between the Non-1GFF and the debt ratio. Furthermore, focusing on the controlling variable’s impact on the debt ratio of the family firms within the GGVV-region, there seems to be a correlation between the debt ratio and the firm’s age when weighting the evidence. However, no indication of the size affecting the debt ratio was found.
Although, no evidence pointing towards a relationship between the generation in charge and the financial structure was found, we still hope this study will be a good direction towards future research within the area. Along, with assisting when bringing forward knowledge about the financial policies of the family businesses within the region.
5.2 Discussion
This study's findings of no significant relationship between the generation running the family firm and the capital structure might be affected by the fact that the study investigated differences within family firms. Most of the previous research had been made on family firms versus non-family firms. Whether there is too small of a difference between each generation when measuring differences within the financial options is still unanswered as this study could not point out any differences.
Furthermore, the indications from the REM and the Difference-in-Difference testing go along, to a certain extent, with Cole and Wolken's research in 1995 and Coleman and Carsky's in 1999. They found that newer and smaller family firms use more debt and less equity. Also, another conclusion drawn from the findings in this paper is that the
company's size does not impact the company's debt ratio, which goes along with the study carried out by Rajan and Zingales (1995).
However, the previous research found that 1GFF was unwilling to take on new debt as their financial method is not according to the findings in this research. Nevertheless, it is noticeable that this specific research solely looked into the long-term debt, which might have affected the outcome. Another interesting aspect is that since there were no findings of the family firm's generation affecting the firm's financial structure, there might be a need to investigate the non-financial aspects of family firms' effect. Therefore, explaining the family firm's financial behavior might be better by putting together these non-financial aspects such as SEW with the financial aspects.
5.3 Recommendations
Recommendations of future research include research in greater depth. For instance, one suggestion is being able to investigate each generational difference instead of first versus non-first. It will be helpful since the region consists of many family businesses within their second, third, and fourth generation. Therefore, a study differentiating between them might give a different input on the financial structure of older family firms and their behavior.
Furthermore, another area of research will be of interest: a different part of Sweden, the country as a whole, or other regions within the world. Also, broadening the analysis even more within the future, the research could include all business forms and not solely LLC. In addition, this study includes all family firms within the sample from all of the different industrial sectors. Another suggestion towards future research is to focus on family firms working within a specific industry. Whether there is a correlation between their financial structure when working within the same industry or not. It will also bring an exciting view of industries with more prominent barriers to entry, requiring a lot of investment money towards purchasing property, plant, and equipment. When comparing all industries, these costs might bias the overall research when not separated from industries with low barriers to entry.
Also, the framework of empirical studies that attempt to identify the determinants of financial structure using quantitative data extracted from financial statements seems
insufficient in research of family businesses. Therefore, it seems advisable to use qualitative data to understand the non-financial characteristics of a more complex reality than that analyzed through financial ratios. For example, looking more towards the impact of SEW within the family firm’s decision-making, and therefore also their financial structure.
Reference List
Allabolag.se - Företagsinformation om alla Sveriges bolag. Allabolag.se. (2021). Retrieved April 2021, from https://www.allabolag.se/.
Ampenberger, M., Schmid, T., Achleitner, AK., & Kaserer, C. (2013). Capital structure decisions in family firms: empirical evidence from a bank-based economy. Review of Managerial Science (7), 247–275. https://doi.org/10.1007/s11846-011-0077-2
Anderson, R., & Reeb, D. (2003). Founding-Family Ownership and Firm Performance: Evidence from the S&P 500. Journal of Finance, 58(3), 1301- 1327. Astrachan, J. H., & Kolenko, T. A. (1994). A Neglected Factor Explaining Family
Business Success: Human Resource Practices. Family Business Review, 7(3), 251–262. https://doi.org/10.1111/j.1741-6248.1994.00251.x
Astrachan, J. H., Klein, S. B., & Smyrnios, K. (2002). The F-PEC scale of family influence: A proposal for solving the family business definition problem - ProQuest. Family Business Review, 15(1), 45-58.
Baixauli-Soler, S. J., Belda-Ruiz, M., & Sánchez-Marín, G. (2020). Socioemotional wealth and financial decisions in private family SMEs. Journal of Business Research, 123, 657-668. https://doi.org/10.1016/j.jbusres.2020.10.022 Brealey, R. A., Myers, S. C., & Marcus, A. J. (2007). Fundamentals of Corporate Finance.
McGrawHill/Irwin.
Cameron, A., & Trivedi, P. (2010). Microeconometrics using Stata (Rev. ed.). Stata Press. Chen, F., Hope, O. K., Li, Q., & Wang, X. (2011). Financial Reporting Quality and Investment Efficiency of Private Firms in Emerging Markets. The accounting review, 86(4), 1255-1288.
Christensen, L. B., Johnson, B. R., & Turner, L. A. (2011). Research Methods, Design, and Analysis (12th ed). University of South Alabama.
Crouzet F. (1995), “Rôle et géographie des dynasties d’affaires”, Entreprise et Histoire, (9), 5-11.
Danes, S. M., Lee, J., Stafford, K., & Heck, R. K. (2008). The Effects of Ethnicity, Families, and Culture on Entrepreneurial Experience: An Extension of Sustainable Family Business Theory. Journal of Developmental Entrepreneurship 13(3), 229–268. https://doi.org/10.1142/S1084946708001010
Deesomsak, R., Paudyal, K., and Pescetto, G. (2004). The determinants of capital structure: evidence from the Asia Pacific region. Journal of Multinational Financial Management (14), 387-405.
Diamond, D. (1989). Reputation Acquisition in Debt Markets. Journal of Political Economy 97(4), 828-62.
Dul, J., & Hak, T. (2008). Case Study Methodology in Business Research. Elsevier Ltd. European Family Businesses - Definition. Europeanfamilybusinesses.eu. (2021). Retrieved 2 February 2021, from http://www.europeanfamilybusinesses.eu/family-businesses/definition. Gersick, K. E., Davis, J. A., McCollom, M., & Lansberg, I. (1997). Generation to
generation: Life cycles of the family business. Harvard Business School Press.
Gitman, L. J., & Zutter, C. J. (2012). Principles of Managerial Finance (13th ed.). Pearson College Div.
Gnosjöanda - Uppslagsverk - NE.se. Ne.se. (2021). Retrieved 3 March 2021, from https://www.ne.se/uppslagsverk/encyklopedi/l%C3%A5ng/gnosj%C3%B 6anda.
Gómez-Mejía, L. R., Haynes, K. T., Núñez-Nickel, M., Jacobson, K. J. L., & Moyano-Fuentes, J. (2007). Socioemotional Wealth and Business Risks in Family-controlled Firms: Evidence from Spanish Olive Oil Mills. Administrative Science Quarterly, 52(1), 106–137. https://doi.org/10.2189/asqu.52.1.106 Guala, F. (2005) The Methodology of Experimental Economics. Cambridge University
Press.
Hall, G., & Hutchinson, P. (1996). Small firm growth, access to capital markets and financial structure: Review of issues and an empirical investigation. Small Business Economics 8, 59–67.
Hall, G., Hutchinson, P., & Michaelas, N. (2004). Determinants of the capital structures of European SMEs. Journal of Business Finance and Accounting (31), 711-728.
Harris, C., & Roark, S. (2019). Cash flow risk and capital structure decisions. Finance Research Letters (29), 393-397.
Hitta.se | Privatpersoner och Företag i Sverige. hitta.se. (2021). Retrieved April 2021, from https://www.hitta.se/.
Hudson, C., & Rönnblom, M. (2007). Regional development policies and the constructions of gender equality: The Swedish case. European Journal of Political Research (46), 47-68. https://doi.org/10.1111/j.1475-6765.2006.00642.x
IFERA (2003). Family Businesses Dominate, Family Business Review, 16 (4), 235-239. International Finance Corporation, IFC. (2018). IFC Family Business Governance (4th ed.). https://www.ifc.org/wps/wcm/connect/2c93b2cb-dec6-4819-9ffb-60335069cbac/Family_Business_Governance_Handbook.pdf?MOD=AJP ERES&CVID=mskqtDE
Jong, A. D., Verbeek, M., & Verwijmeren, P. (2010). The Impact of Financing Surpluses and Large Financing Deficits on Tests of the Pecking Order Theory. Financial Management (Summer 2010), 733 - 756. https://doi.org/10.1111/j.1755-053X.2010.01090.x
Nicodano, G., & Regis, L. (2019). A trade-off theory of ownership and capital structure. Journal of Financial Economics, 131(3), 715-735.
Nordmark, C. (2018). Gnosjöandan – företagande som livsstil. Isaberg förlag AB. O’Callaghan, S., Ashton, J., & Hodgkinson, L. (2018). Earnings Management and
Managerial Ownership in Private Firms. Journal of Applied Accounting Research, 19(4), 648-668.
Prasad, S., Green, C., & Murinde, V. (2001). Company Financing, Capital Structure, and Ownership: A Survey, and Implications for Developing Economies. SUERF – The European Money and Finance Forum, Vienna, SUERF Studies (12). http://hdl.handle.net/10419/163444
Rajan, R. G. & Zingales, L. (1995). What Do We Know about Capital Structure? Some Evidence from International Data. The Journal of Finance 50 (5), 1421-1460. https://doi.org/10.1111/j.1540-6261.1995.tb05184.x
Ross, S. A., Westerfield, R., & Bradford, J., D. (2009) Fundamentals of corporate financial. McGraw-Hill Americas: New York.
Sonfield, M., & Lussier, R. (2004). First-, Second-, and Third-Generation Family Firms: A Comparison. Family Business Review, 17(3), 189–201. https://doi.org/10.1111/j.1741-6248.2004.00013.x
Statistikmyndigheten SCB. Statistiska Centralbyrån. (2021). Retrieved 27 January 2021, from https://www.scb.se/.
Titman, S., & Wessels, R. (1988). The Determinants of Capital Structure Choice. The Journal of Finance 43(1), 1-19. https://doi.org/10.1111/j.1540-6261.1988.tb02585.x
Venter, E., & Farington, C. (2009). The nature of family businesses and their importance for economic development. New Contree Journal 58(9), 131-153. http://hdl.handle.net/10394/5240
Wtterwulghe, R., & Janssen, F. (1997). The Role of the Banker in Financing Medium-sized Firms in Belgium: Lender or Adviser? The Journal of Entrepreneurship, 6(1), 75–85. https://doi.org/10.1177/097135579700600105
Appendix
Source: Own illustration from EsMaker. Appendix 2: Descriptive Statistics
Appendix 3: Normality Test
Source: EViews based on the data collection.
Appendix 4: Breusch-Pagan Lagrange Multiple Test
Appendix 5: Pooled OLS
Source: EViews based on the data collection.
Appendix 6: Random Effects Model
Appendix 7 Difference-in-Difference