1933
STATE OF WYOMING
G
EOLOGICAL SURVEY
Wyoming State Geological Survey
Open File Report 2010-02 Supported by the U.S. Bureau of Land Management Buffalo Field Office, Buffalo, Wyoming
1993–2006 coalbed natural
gas regional groundwater
monitoring report:
Powder River Basin, Wyoming
Keith E. Clarey, Nikolaus W. Gribb, Richard J. Hays, and
J. Fred McLaughlin
1933
G
EOLOGICAL SURVEY
Acting Director and State Geologist
Wallace L. Ulrich
1993–2006 coalbed natural gas regional groundwater monitoring report: Powder River Basin, Wyoming, by Keith E. Clarey, Wyoming Water Development Office, Nikolaus W. Gribb, Richard J. Hays, and J. Fred McLaughlin, Wyoming State Geo-logical Survey. The report was supported by the U.S. Bureau of Land Management, Buffalo Field Office, Buffalo, Wyoming. WSGS Open File Report 2010-02, 2010.
Copyright © 2010 by the WSGS. All rights reserved.
The WSGS encourages the fair use of its material. We request that credit be expressly given to the “Wyoming State Geo-logical Survey” when citing information from this publication. Please contact the WSGS at 307-766-2286, ext. 224, or by e-mail at sales-wsgs@uwyo.edu if you have any questions about citing materials, preparing acknowledgments, or extensive use of this material. We appreciate your cooperation.
Any use of trade, product, or firm names in this publication is for descriptive purposes only and does not imply endorse-ment or approval by the State of Wyoming or the WSGS. Individuals with disabilities who require an alternative form of this publication should contact the WSGS (see contact information above). TTY relay operator 800-877-9975.
For more information about the WSGS or to order publications and maps, please go to www.wsgs.uwyo.edu, call 307-766-2286, ext. 224, or e-mail sales-wsgs@uwyo.edu.
Cover: Streeter monitoring well, southeastern Johnson County, Powder River Basin, Wyoming. Photo by David Croft, U.S. Edited by: Robert W. Waggener and others Design by: Brendon B. Orr Robert W. Waggener Illustration assistance by: Nikolaus W. Gribb Richard J. Hays Layout by: Brendon B. Orr
Palo monitoring well, northern Campbell County, Powder River Basin, Wyoming. Photo by David Croft, U.S. Bureau of Land Management,
1993–2006 coalbed natural
gas regional groundwater
monitoring report:
Powder River Basin, Wyoming
Wyoming State Geological Survey
Open File Report 2009-01
Updated September 2010
Keith E. Clarey, Wyoming Water Development Office J. Fred McLaughlin, Wyoming State Geological Survey Nikolaus W. Gribb, Wyoming State Geological Survey Richard J. Hays, Wyoming State Geological Survey Supported by the U.S. Bureau of Land Management
Buffalo Field Office, Buffalo, Wyoming
Notice for open file reports published by the WSGS
This Wyoming State Geological Survey (WSGS) open file report has not been technically reviewed or edited for conformity with WSGS standards or Federal Geographic Data Committee digital cartographic standards. Open file reports are preliminary and often require additional fieldwork and/or compilation and analysis; they are meant to be a first release of information for public comment and review. The WSGS welcomes comments, suggestions, and contributions from users of the information. Contact the WSGS on the University of Wyoming campus; call 307-766-2286, e-mail sales-wsgs@uwyo.edu, or through the web site at www.wsgs.uwyo.edu.
T
able
of
C
onTenTs
Abstract………1
Chapter 1………2
Introduction………2
Purpose and scope………2
Study area………5
Geography………5
Structural geology………5
Geologic history………8
Stratigraphy………8
Fort Union Formation………8
Wasatch Formation………10
Groundwater resources………10
Fort Union Formation………12
Wasatch Formation………12
Powder River Basin groundwater monitoring program………13
Bureau of Land Management (BLM) deep monitoring well network data collection…………13
Chapter 2………16
Groundwater monitoring results, 1993–2006………16
Coalbed natural gas (CBNG) fields and monitoring wells………16
Summary of water-level drawdown and rise in monitoring wells………17
Fort Union coal monitoring wells………17
Wasatch sandstone monitoring wells………17
Summary of wellhead gas pressures in Fort Union coal wells………17
Chapter 3………24
Comparison of observed to predicted impacts………24
Comparison of predicted versus measured drawdowns in Fort Union coal wells………24
Comparison of predicted versus measured drawdowns in Wasatch sandstone wells…………30
Chapter 4………31
Summary and future monitoring plan………31
Future monitoring plan………31
Existing wells of BLM deep monitoring well network………32
Potential future wells for BLM deep monitoring well network………32
Acknowledgments………33
References Cited………33
a
bsTraCT
Coalbed natural gas (CBNG) is an important resource in northeastern Wyoming’s Powder River Basin (PRB). This report presents and interprets well data collected from the Bureau of Land Management’s (BLM) PRB deep monitoring well network. These data were collected from 111 monitoring wells from 1993 through 2006. The BLM deep monitoring well network was designed and constructed to evaluate potential leakage between the CBNG water-producing coal deposits and adjacent sandstone beds and to measure the effects of CBNG production on groundwater. Between 1987 and 2006, CBNG production in the Wyoming PRB produced 534,000 acre feet of groundwater.
Groundwater models and drawdown predictions have been used to forecast the potential hydrogeologic impacts of CBNG production in Wyoming. The BLM deep monitoring well data was used to evaluate impact analysis models (Applied Hydrology Associates Inc. [AHA] and Greystone Environmental Consultants Inc. [GEC] 2002). CBNG impacts to groundwater levels in all of the Fort Union Formation coal wells are less than drawdowns predicted by the 2002 groundwater model (AHA and GEC, 2002), which also predicted a higher rate of CBNG development in the PRB. Aquifer drawdown has been recorded in some of the overlying sandstone beds of the Wasatch Formation.
CHAPTER 1
I
nTroduCTIon
Since the late 1990s, Wyoming’s PRB has been the center of extensive CBNG development, the produc-tion of which requires the extracproduc-tion of groundwater. To help assess the impact on regional groundwater resources, the BLM entered into a cooperative agree-ment with the Wyoming State Geological Survey (WSGS) to compile and evaluate data collected by the BLM groundwater monitoring well network. BLM monitoring well data were collected and ana-lyzed through the years 1993 to 2006, including information on well construction and completion, water levels, and wellhead gas pressure. This report discusses the affect on groundwater from the draw-down of CBNG production and compares the true data to the modeled (predicted) data.
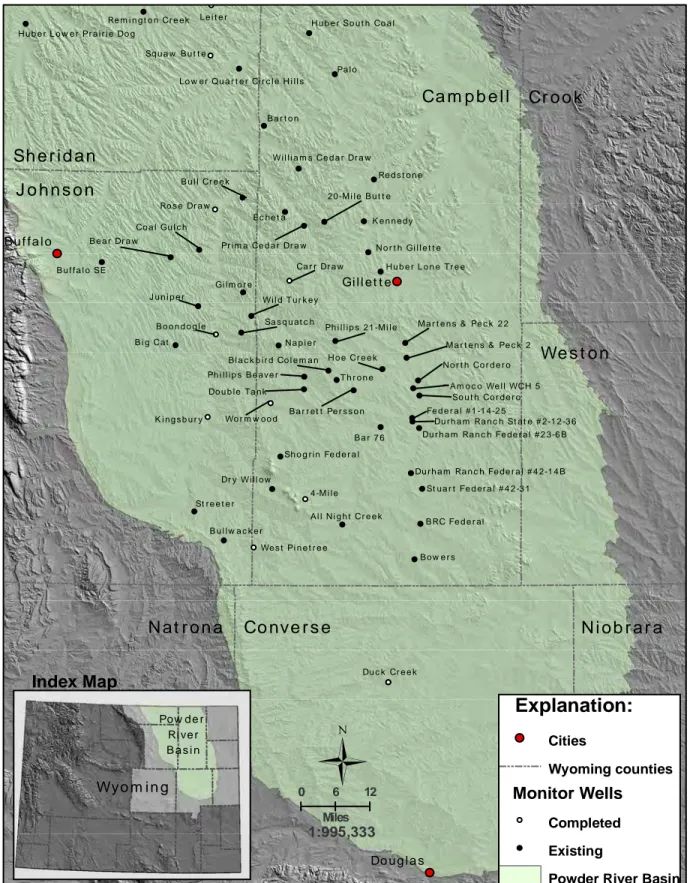
Beginning in 1993 with eight wells in two locations, water-level and wellhead gas pressure data were col-lected by the BLM. The monitoring well network expanded to 111 wells at 48 locations in the PRB of northeastern Wyoming by 2006 (Figure 1). These monitoring data are available on the Wyoming Energy Resource Information Clearinghouse Web site at wygl.wygisc.org/wygeolib. Additional moni-toring wells are located in the adjacent area of the northern PRB in southeastern Montana. This report summarizes the Wyoming portion of the monitor-ing well database (Figure 1). An evaluation of the collected data and the hydrographs and wellhead gas pressure charts for each well or well set site are dis-cussed in the Appendix.
This report is part of an ongoing, cooperative project between agencies in Montana and Wyoming to con-duct CBNG-related groundwater monitoring in the PRB. The adjacent BLM monitoring well network in the Montana portion of the PRB is managed by the Montana Bureau of Mines and Geology (MBMG). The Montana monitoring well network reports include Wheaton and Donato (2004) for the year 2003, Wheaton et al. (2005) for the year 2004, Wheaton et al. (2006) for the year 2005, Wheaton
et al. (2007) for the year 2006, and Wheaton et al. (2008) for the year 2007. Montana PRB monitor-ing reports are online at www.blm.gov/mt/st/en/fo/ miles_city_field_office/cbng/monitoring.html. The data used in the Montana reports are available at mbmggwic.mtech.edu.
Since 1997, hydrologic impacts in the Wyoming PRB from CBNG development have been region-ally confined to coal beds of the Tongue River Member in the Fort Union Formation and some of the lower sandstone beds in the overlying Wasatch Formation. By December 31, 2006, there were approximately 24,000 CBNG wells drilled and com-pleted in the Wyoming PRB (Wyoming Oil and Gas Conservation Commission, 2008). This total includes both producing (72 percent) and shut-in (28 percent) wells. During 2006, CBNG operations in the Wyoming PRB produced 377 billion cubic feet (Bcf) of natural gas. The cumulative total ground-water production for the CBNG development in the Wyoming PRB was approximately 172 billion gal-lons at the end of December 2006 (Wyoming Oil and Gas Conservation Commission, 2008).
Drawdown maps were prepared for coal deposits in the Fort Union Formation (see Figures 5–8, pages
?-?). The 2006 drawdown maps were prepared for four combined coal zones based on their stratigraphic positions within the basin. These maps were com-pared to the predicted drawdowns and used to ana-lyze groundwater impacts of CBNG production.
PURPOSE AND SCOPE
The purpose of this report is to compile, interpret, and evaluate data collected by the BLM deep moni-toring well network in the Wyoming portion of the PRB through the end of 2006. This is an initial report and subsequent work will expand upon the first analysis.
BLM deep monitoring wells are installed for the purpose of monitoring impacts associated with the change of water levels in coal deposits during CBNG activities. The BLM began collection of monitoring
Duck Creek
Martens & Peck 22
4-Mile
All Night Creek BRC Federal
Bowers West Pinetree
Bullwacker Streeter
Stuart Federal #42-31 Durham Ranch Federal #42-14B Shogrin Federal
Bar 76
Federal #1-14-25
Durham Ranch Federal #23-6B Wormwood Kingsbury Double Tank Phillips Beaver Blackbird Coleman Throne Barrett Persson Hoe Creek South Cordero North Cordero
Martens & Peck 2 Phillips 21-Mile Napier Sasquatch Wild Turkey Juniper Boondogle Big Cat Bear Draw Buffalo SE Coal Gulch Rose Draw Bull Creek Gilmore
Carr Draw Huber Lone Tree
North Gillette Kennedy 20-Mile Butte
Prima Cedar Draw Echeta
Williams Cedar Draw Redstone Barton
Palo Huber South Coal
Lower Quarter Circle Hills Squaw Butte
Remington Creek Leiter Huber Lower Prairie Dog
Crook Weston Niobrara Converse Natrona Johnson Sheridan Campbell Dry Willow Amoco Well WCH 5 Durham Ranch State #2-12-36
Casper Douglas Buffalo Gillette Powder River Basin Wyoming Explanation: Cities Wyoming counties Monitor Wells Completed Existing
Powder River Basin
Index Map
Ü
0 6 12
Miles
1:995,333
Figure 1. Locations within the Powder River Basin of deep monitoring well network wells as of 2006. Existing
well locations denote wells that have been drilled but have no data. Completed wells are those associated with data and used as part of the report. Illustration by Richard J. Hays, WSGS (2010).
well data in 1993. Additional wells have been added annually to the network. Other BLM wells monitor shallow groundwater resources that may be poten-tially impacted by CBNG surface water discharges. Specifically, the purposes of the deep groundwater monitoring program are to:
1. Analyze and interpret data collected from the BLM deep monitoring well network and pro-duce a report of the findings. The ground-water monitoring program was established under the Wyodak Coal Bed Methane Final Environmental Impact Statement (FEIS), 1999, and was in direct response to issues raised as a result of CBNG development in the PRB.
2. Monitor and measure leakage between the producing coal zones and adjacent (overlying and underlying) sandstone units and mea-sure the overall extent of drawdown of water levels in the coal producing zones.
3. Compare the measured versus predicted impacts from the PRB FEIS and Wyodak EIS associated with water pumpage from the coal zones. This comparison will be further evaluated by the BLM and other federal and state agencies that are cooperative members of the Montana-Wyoming Inter-Agency Task Group. The predicted groundwater impact information is detailed in a 2002 ground-water modeling technical report (AHA and GEC, 2002).
BLM deep monitoring well data collected since 1993 were analyzed to assess the degree to which the BLM’s original project objectives have been met. Some specific objectives initially developed for the groundwater monitoring program were to:
1. Establish baseline conditions for the
poten-tiometric surface using the groundwater-level data collected by the BLM in the Wyoming PRB. These data are needed for the future calibration of groundwater modeling efforts.
2. Quantify drawdown in the coal bed
produc-tion zone and leakage between the coal bed
production zone and overlying/underlying strata. These data are critical to conduct an impact analysis of groundwater resources for areas within the PRB.
3. Measure wellhead total natural gas pressure build-up in production zone monitoring wells. Continuous monitoring data on total wellhead gas pressure for wells completed into production coal bed zones were and are used to estimate in-situ desorption pressure of total natural gas.
4. Measure potential changes in the percentage of methane in monitoring wells completed into production coal bed zones and overly-ing/underlying strata to detect possible gas migration from coal bed production zones to adjacent formations.
5. Quantify groundwater-level recovery and aquifer recharge rates within the monitor-ing wells. This would follow future cessa-tion of CBNG produccessa-tion in the PRB. Little is known about groundwater recharge rates and mechanisms in the Wyoming PRB. The rates of water-level recovery following cessa-tion of CBNG produccessa-tion may be used to estimate recharge rates and the duration of CBNG impacts. The rate of recovery will be analyzed when water-level recharge data become available after CBNG production is complete.
Monitoring of the Wyoming PRB may be sepa-rated into two time intervals (1993–2001 and 2002– 2006) relative to the two BLM EISs (U.S. Bureau of Land Management, 1999, and U.S. Bureau of Land Management, 2003).
CBNG activity in the PRB for the period 1993–2002 follows:
• As of the end of 2002, there were 14,220 CBNG wells permitted in the Wyoming PRB. Of these, 10,732 wells were in pro-duction, and 3,488 were shut-in (Wyoming Oil and Gas Conservation Commission, 2008).
• There was a cumulative total of 532 Bcf of natural gas production by CBNG through 2001 (Wyoming Oil and Gas Conservation Commission, 2008).
• There was a cumulative total of 114,000 acre feet of CBNG water production in the Wyoming PRB through 2001 (Wyoming Oil and Gas Conservation Commission, April 1, 2008).
CBNG activity in the PRB for the period 2002– 2006 follows:
• As of the end of 2006, there were 24,002 CBNG wells permitted in the Wyoming PRB. Of these, 17,202 were in production, and 6,800 wells were shut-in (Wyoming Oil and Gas Conservation Commission, 2008). These data show that approximately 10,000 additional CBNG wells were permitted for construction in the Wyoming PRB from January 2003 through December 2006. • There was a cumulative total of 2,250 Bcf of
natural gas production by CBNG activities in the Wyoming PRB through 2006 (Wyo-ming Oil and Gas Conservation Commis-sion, 2008).
• There was a cumulative total of 390,000 acre feet of CBNG water production in the Wyoming PRB through 2006 (Wyoming Oil and Gas Conservation Commission, 2008).
STUDY AREA
The BLM deep well monitoring program is concen-trated in Campbell, Johnson, and Sheridan counties in the northern portion of the PRB in northeastern Wyoming. As shown on Figure 1, the study area covers approximately 12,500 square miles (approxi-mately 347 townships) extending from T. 32 N. to T. 58 N. and from R. 66 W. to R. 86 W. The PRB occupies the western part of the Northern Great Plains physiographic province. This project report concerns only the Wyoming portion of the PRB.
Geography
T he Powder R i ver s t r uc t u r a l b a si n i s a 24,000-square-mile basin approximately 120 miles wide and 200 miles long (Figure 2). It is bound on the west by the Bighorn Mountains and on the east by the Black Hills. The south end is bound by a com-bination of the relatively low-lying Casper Arch, the Laramie Mountains, and the Hartville Uplift. The north end is partially closed by the Miles City Arch. The majority of the PRB is sparsely populated. The largest communities are Buffalo, Gillette, Moorcroft, Newcastle, Sheridan, and Wright. Two rail lines transport large quantities of coal out-of-state. Interstate 90 (I-90) crosses the basin from east to west, and Interstate 25 (I-25) crosses the western PRB from the south, intersecting with I-90 near Buffalo. Relatively few federal, state, and county roadways connect the cities, towns, and smaller communi-ties. The major industries in the basin include con-ventional oil and gas, CBNG, surface coal mining, agriculture (ranching and farming), and recreation/ tourism.
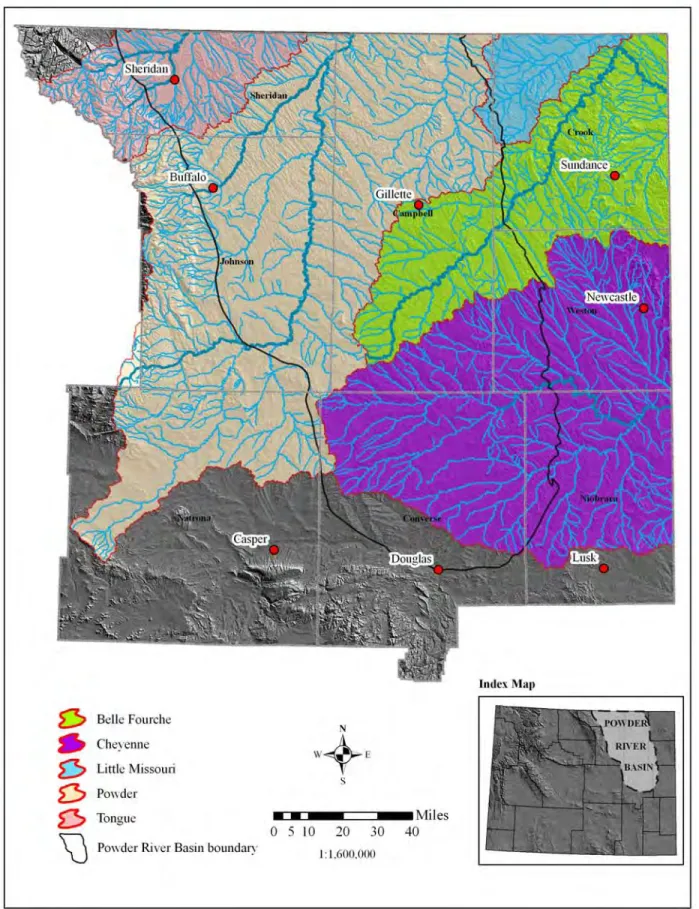
The basin is drained almost primarily by the Powder River. Other drainages include the Belle Fourche, Cheyenne, Little Missouri, and Tongue rivers and their tributaries (Figure 3). The major drainages are composed of the Upper and Middle Powder River, Clear Creek, Crazy Woman Creek, Salt Creek, Upper Belle Fourche, Little Pawder River, Antelope Creek, and Cheyenne River sub-basins. PRB sur-face waters flow northward and eastward into the Missouri River system.
The grasslands of the basin consist of gently rolling plains with a few mesas and buttes. The annual aver-age precipitation ranges between 10 and 15 inches, the humidity is low, the summers are generally warm (70° to 90°F), and the winters are generally cold (20° to -40°F) (Martner, 1986; Ostresh et al., 1990).
Structural Geology
The Powder River structural basin is a deep, north-plunging, asymmetric syncline. The structural axis of the basin in Wyoming trends north-northwest to south-southeast. The axis is parallel to and located several miles to the east of the western margin of the basin, which parallels the steeply-dipping, faulted
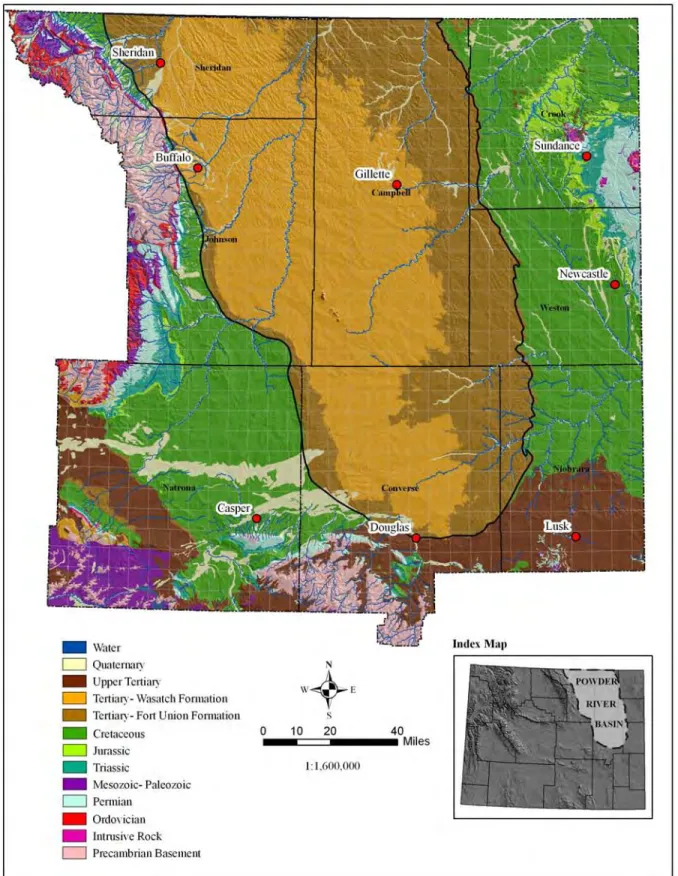
Figure 2. Generalized geologic map, Powder River Basin, Wyoming. Illustration by Nikolaus W. Gribb, WSGS
eastern flank of the Bighorn Mountains (Feathers et al., 1981). The deepest part is along the basin axis, east of the Bighorn Mountains. The basin is filled with more than 18,000 feet of Paleozoic-, Mesozoic-, and Cenozoic-age sedimentary formations (Feathers et al., 1981). Geologic cross sections through the northern and central structural basin are presented in McLellan et al. (1990), and PRB coal cross sections are shown in Jones (2008).
On the eastern side of the basin, the formations dip gently from one to three degrees westward; therefore, most of the coal deposits mined in the Wyoming PRB are along the eastern basin margin (Jones, 2008). PRB coal deposits vary in size but can be more than 100 feet thick (Jones, 2008). Along the western basin margin and east of the Bighorn Mountains, the formations commonly have steep eastward dips from 20 to 25 degrees with locally overturned bedding (e.g., Ver Ploeg et al., 2008)
Structurally, the PRB is mildly deformed. Major reverse and thrust faults are present along the flanks of the surrounding uplifts, some of which have strike-slip components (Brown, W.G., 1993). Within the basin, there are normal faults with small displacements (typically less than 150 feet of verti-cal movement), regional lineaments associated with Precambrian basement motions, and gentle anticlinal and synclinal folds (Clarey and Stafford, 2008; Jones, 2008; Surdam et al., 2008; Ver Ploeg et al., 2008).
Geologic History
The geologic history of the coal-bearing forma-tions in the PRB begins during the Late Cretaceous, when compressional plate tectonics of the Laramide Orogeny slowly elevated the land, draining away an existing sea and creating the uplifts and structural arches that now outline the PRB. This mountain-building period continued from the Late Cretaceous to the mid-Eocene (Snoke, 1993).
The interior of this newly formed Laramide inter-montane basin was low, flat, and swampy. During the Paleocene and Eocene Epochs, these extensive swamps accumulated peat deposits that would later form thick coal deposits (e.g., Jones, 2008). The PRB was then slowly filled with continental sedimentary and volcaniclastic deposits almost to the mountain
peaks, and it remained relatively full until the late Miocene Epoch, when regional erosion began low-ering the ground surface down to its present level (Mears, 1993).
Stratigraphy
A generalized geologic map of the Wyoming PRB and surrounding areas is shown in Figure 2. Figure
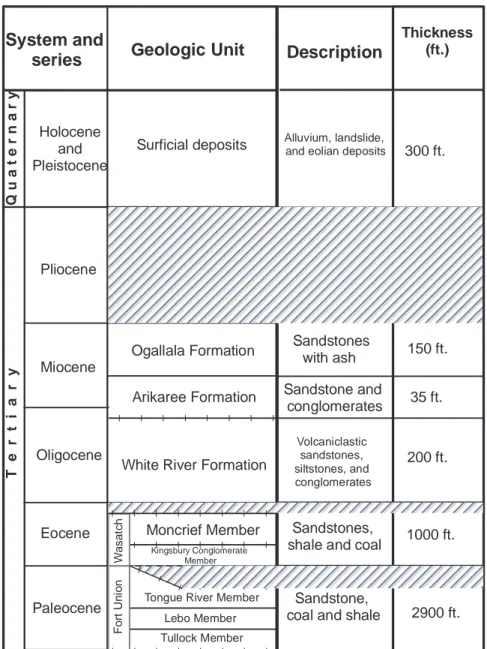
4 shows a generalized stratigraphic column for the Wyoming PRB.
Fort Union Formation
The Paleocene Fort Union Formation consists of a thick non-marine sequence of fine- to medium-grained lenticular sandstone interbedded with siltstone, shale, and coal. The Fort Union has three members – the Tongue River, Lebo Shale, and Tullock, in descending order. In most of the Wyoming PRB, the Fort Union is unconformably overlain by the Eocene Wasatch Formation (Feathers et al., 1981; Ver Ploeg et al., 2008).
The Fort Union Formation ranges in thickness from 1,100 to more than 2,500 feet (Feathers et al., 1981). The depositional environments include fluvial, floodplain, and wetlands. The wetlands were primar-ily large tree-filled swamps, at times covering most of the basin. These swamps accumulated thick, organic-rich peat deposits, which, after burial and thermal alteration, became the substantial coal deposits of economic importance today. These coal deposits also serve as the primary natural gas reservoirs for recent CBNG activity (Jones, 2008; Surdam et al., 2008).
• The Tullock Member is the oldest Tertiary unit in the Wyoming PRB. The Tullock Member is composed of brown sandstone interbedded with shale, siltstone, and thin coal beds deposited in a fluvial/floodplain/ wetland environment (Zelt et al., 1999). The Tullock ranges in thickness from 500 feet in the northeastern PRB to 1,440 feet in southeastern basin (Brown, J.L., 1993). • The Lebo Shale Member (middle member)
consists of gray shale interbedded with gray siltstone, claystone, and sandstone depos-ited in a lacustrine environment. Fluvial, floodplain and wetland depositional
envi-System and
series Geologic Unit
Q u a t e r n a r y T e r t i a r y Holocene and Pleistocene Surficial deposits Pliocene Miocene Oligocene Eocene Paleocene Ogallala Formation Arikaree Formation
White River Formation
Moncrief Member
Kingsbury Conglomerate Member Tongue River Member
Lebo Member Tullock Member W a s a tc h F o rt U n io n Description Volcaniclastic sandstones, siltstones, and conglomerates Sandstones, shale and coal
Sandstone, coal and shale Sandstone and conglomerates Sandstones
with ash
Alluvium, landslide, and eolian deposits
Thickness (ft.) 200 ft. 1000 ft. 2900 ft. 150 ft. 35 ft. 300 ft. Explanation Unconformity Hiatus
Figure 4. Generalized stratigraphic column from the lower Tertiary through the Quaternary, Powder River
ronments also contributed sediment (Zelt et al., 1999). The Lebo Shale ranges from 500 feet thick in the northwestern PRB to 1,700 feet in the southwestern basin (Law, 1976).
• The Tongue River Member is the youngest Fort Union member. It consists of yellow fine- to medium-grained, massive, and cross-bedded lenticular sandstone, gray to brown mudstone, carbonaceous shale, and coal deposited in fluvial/flood plain/swamp environments (Zelt et al., 1999). Some coal deposits in the Tongue River Member exceed 200 feet in thickness (Glass and Lyman, 1998; Jones, 2008). Most of the Tongue River coal is subbituminous C in rank. Some lower rank lignite beds are pres-ent around the margins of the PRB (Glass and Lyman, 1998).
• The Tongue River coal deposits are thick, variable, and laterally extensive in the Wyoming PRB. The coal deposits vary unpredictably spatially in thickness as they thicken, thin, merge, split, abruptly termi-nate, or transitionally pinch out laterally. Coal deposits are divided into a hierarchy of stratigraphic names.
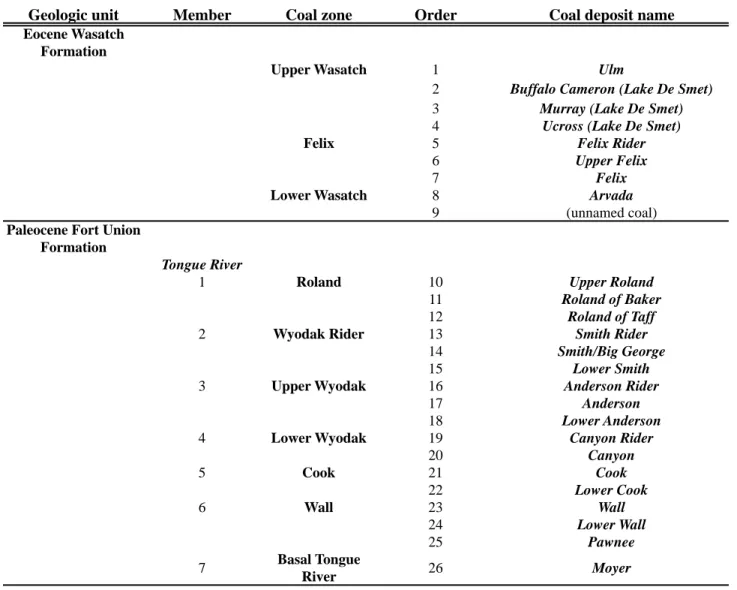
Over the past century, the nomenclature of the PRB coal deposits has evolved from work by local resi-dents, geologists, federal agencies, Wyoming agen-cies, Montana agenagen-cies, coal mine operators, CBNG operators, and conventional oil and gas operators (Jones, 2008). Note that the interpretation of the named coal monitoring zones in the BLM deep mon-itoring wells and other wells within the Wyoming PRB may not match the coal nomenclature system listed in Table 1 and modified from Jones (2008). The stratigraphic column and nomenclature table (Table 1) were developed in an attempt to stan-dardize the nomenclature. The coal deposits of the Tongue River Member host the majority of the total recoverable CBNG resources in the Wyoming PRB, which is estimated at 25.2 trillion cubic feet of nat-ural gas (De Bruin et al., 2004). This is enough to meet the energy needs of approximately 12 million homes for 25 years.
As of 2009, there were 13 large surface coal mines along the eastern PRB (there was also one pending mine). The main coal deposit being mined in the eastern PRB is the 50- to 100-foot-thick Upper and Lower Wyodak coal zones from the upper portion of the Tongue River Member (Jones, 2008).
In 2008, the WSGS defined seven major coal zones in the Tongue River Member of the Fort Union Formation (Table 1) (Jones, 2008). These coal zone definitions are based on basin-wide geophysical log correlations from 4,185 wells (Jones, 2008). These seven major coal zones in the Tongue River Member, in order from the uppermost stratigraphic position (youngest) to lowermost position (oldest), are listed in
Table 1.
Wasatch Formation
The Eocene Wasatch Formation was deposited in nearly identical fluvial-floodplain-wetland envi-ronments as the underlying Paleocene Fort Union Formation. The contact between the Fort Union and Wasatch Formations is gradational in most of Wyoming’s PRB and has proven to be very difficult to distinguish either in the field or on geophysical well logs. The Wasatch Formation consists of drab, fine- to coarse-grained, lenticular sandstone interbed-ded with variegated claystone and shale, with numer-ous coal deposits. The Wasatch has a total thickness of more than 2,000 feet in the central PRB and 1,500 feet in the northern part. As shown on Figure 4, the Wasatch has the greatest areal exposure at the ground surface of any geologic formation in the Wyoming PRB.
Groundwater Resources
Groundwater flow within the bedrock aquifers of the PRB is commonly both structurally and strati-graphically controlled, particularly adjacent to the Laramide mountain uplifts. Aquifers are predomi-nantly within interstratified sequences of high- and low-permeability sedimentary beds. Groundwater flow occurs where there is permeability and sufficient head pressure. The PRB aquifers are commonly het-erogeneous and anisotropic in character on both local and regional scales. Many of the Tertiary sandstone aquifers of the Fort Union and Wasatch are lenticular in nature and were deposited as sandy stream chan-nels. (Clarey and Stafford, 2008)
Geologic unit Member Coal zone Order Coal deposit name Eocene Wasatch
Formation
Upper Wasatch 1 Ulm
2 Buffalo Cameron (Lake De Smet) 3 Murray (Lake De Smet) 4 Ucross (Lake De Smet)
Felix 5 Felix Rider
6 Upper Felix
7 Felix
Lower Wasatch 8 Arvada
9 (unnamed coal)
Paleocene Fort Union Formation
Tongue River
1 Roland 10 Upper Roland
11 Roland of Baker
12 Roland of Taff
2 Wyodak Rider 13 Smith Rider
14 Smith/Big George
15 Lower Smith
3 Upper Wyodak 16 Anderson Rider
17 Anderson
18 Lower Anderson
4 Lower Wyodak 19 Canyon Rider
20 Canyon 5 Cook 21 Cook 22 Lower Cook 6 Wall 23 Wall 24 Lower Wall 25 Pawnee 7 Basal Tongue River 26 Moyer
Table 1. Stratigraphic column and coal nomenclature table for the Powder River Basin, Wyoming. Table
Locally, groundwater is unconfined (water-table conditions) in shallow outcrop areas of the Wasatch Formation in the central basin and in the shallow outcrop areas of the older (pre-Wasatch) formations along the margins of the basin (Feathers et al., 1981). Groundwater in the unconsolidated Quaternary deposits (e.g., alluvium) is also unconfined. Shallow groundwater flow (less than about 300 to 500 feet below ground surface) is primarily controlled by topography and stream drainage patterns and is dis-charged to the streams and rivers. The river drainages affecting the Wyoming PRB are the Little Bighorn, Tongue, Powder, Little Powder, Little Missouri, Belle Fourche, Cheyenne, Niobrara, and North Platte rivers.
Deep regional groundwater in the PRB bedrock aquifers flows from recharge areas or outcrops along the basin margins down-gradient towards the structural axis of the basin and north towards the Montana PRB (Davis, 1976). This overall trend may be substantially altered on the local scale by features such as faults, which can function as flow boundar-ies or conduits for flow, by the heterogeneous char-acter of geologic formations (lenticular aquifers/con-fining units [aquitards]), and anthropogenic factors. Eventual discharge occurs along stream drainages as springs or as subcrop flow into overlying geologic units (Feathers et al., 1981). Subcrop flow from the deep regional bedrock flow discharges into alluvium along some stream valleys and helps maintain base flow where the streams are gaining (Davis, 1976). Based on local hydrogeologic data in the Wyoming PRB, Davis and Rechard (1977) and Brown (1980) estimated the average infiltration of water recharge into the Wasatch/Fort Union aquifers of the PRB from precipitation to be approximately 0.15 inch per year.
Fort Union Formation
Aquifers in the Fort Union Formation occur in the multiple stacked beds of sandstone and coal. The Fort Union sandstone beds are lenticular and dis-continuous. The major coal deposits act as regionally extensive aquifers. Where the Tongue River outcrops along the basin’s eastern margins, extensive clinker beds are present. Clinker beds are shales and sand-stones that have baked and fused by burnt-out coal deposits, which often results in increase in
ground-water permeability (Feathers et al., 1981). Low-permeability confining beds are interbedded with the coal and sandstone and consist of claystone, mud-stone, and shale. As a result of these interbedded and stacked lithologies, the Fort Union exhibits hetero-geneous stratification, anisotropic groundwater flow, and leaky, low-permeability confining strata inter-bedded between the permeable sandstone and coal deposits (Feathers et al., 1981; Hinaman, 2005). The Tongue River Member of the Fort Union is consid-ered to be a confined to semi-confined aquifer across most of the PRB.
Locally, Fort Union coal deposits, which directly overlie or underlie adjacent sandstone beds, allow some degree of groundwater communication. The estimated porosity of the three members of the Fort Union is 30 percent for sand beds and 35 percent for non-sand beds (Hinaman 2005). The hydraulic con-ductivity of the Tongue River Member coal depos-its, as determined by multi-well pumping tests, range from 4.6 x 10⁻⁷ to 8.6 x 10⁻⁴ feet per second (fps), with
a median value of 2.3 x 10⁻⁵ fps (AHA and GEC,
2002). These reported conductivity values in fps may be converted to feet per day (fpd) with a range from 0.00066 to 1.2 fpd and a median value of 0.033 fpd. The Wyoming Framework Water Plan classifies the Fort Union Formation as a major aquifer in the PRB (WWC Engineering, 2007). Coal deposits and clinker typically exhibit better porosity and perme-ability than the sandstone beds of the Fort Union Formation. Typical aquifer properties of the clinker areas and associated coal deposits include transmis-sivity of up to 3 million gallons per day per foot of drawdown and well-specific capacity of greater than 2,000 gallons per minute per foot of drawdown (Feathers et al., 1981).
The CBNG development in the Tongue River Member from 1997 through 2006 and the associ-ated pumping and extraction of more than 172 bil-lion gallons of groundwater through 2006 has caused water-level drawdown in some of these coal depos-its. Maximum drawdown from initial groundwater levels measured in BLM deep monitoring wells for the Tongue River coal deposits is up to 625 feet. The drawdown in these Tongue River Member coal deposits is the combined result of CBNG devel-opment, surface coal mine dewatering from 1980
through 2006, pumping of public water-supply wells, pumping of industrial/miscellaneous wells, pumping of other domestic/irrigation/stock water wells, and possible regional water-level decline from a decade-long drought. While the drawdown of the groundwa-ter levels is not solely due to CBNG development, it is the major source for the drawdown in coal deposits of the Tongue River Member in the Wyoming PRB.
Wasatch Formation
The main water-bearing aquifers in the Wasatch Formation are the coal and sandstone beds. The rest of the formation consists of low-permeability interbedded shales, mudstones, siltstones, and clay-stones. Some Wasatch wells locally flow water at the ground surface under confined (artesian) pressure. Groundwater from the Wasatch Formation in its out-crop area (Figure 4) is extensively used for domestic consumption and livestock watering.
The hydraulic conductivity of the sandstone beds of the Wasatch Formation range from 2.3 x 10⁻⁷ to 2.3 x
10-4 fps, with a median value of 6.2 x 10⁻⁵ fps (AHA
and GEC, 2002). These reported conductivity values in fps may be converted to fpd with a range from 3.3 x 10⁻⁴ to 0.33 fpd and a median value of 0.089
fpd. The Wyoming Framework Water Plan (WWC Engineering, 2007) classifies the Wasatch Formation as a major sandstone aquifer within the PRB.
POWDER RIVER BASIN
GROUNDWATER MONITORING PROGRAM
Originally, groundwater monitoring in the PRB began as a result of environmental analyses associated with early CBNG projects, including the Marquiss, Lighthouse, Gillette North, and Gillette South proj-ects. Thirty-six groundwater monitoring sites were required by the BLM as part of the approval of these projects between 1993 and 1999 (information pro-vided by the BLM Buffalo Field Office, 2009). In October 1999, a regional groundwater monitor-ing program was established under the Wyodak FEIS (U.S. Bureau of Land Management, 1999). The pur-pose of the program was to evaluate hydrologic com-munication between producing coals and overlying and underlying sandstone units, and to measure the
areal extent of drawdown in the producing zone. These data would be used to verify impact analysis, provide “real time” impact quantification, and pro-vide baseline data for calibration of subsequent CBM modeling efforts.
The Wyodak record of decision stipulated that 140 sets of two or more monitor wells would be drilled over a 10-year period, equaling about two sets per township throughout the projected PRB develop-ment area. These well sets were planned to be com-pleted as CBNG development progressed across the basin, and the wells would be stipulated as part of the approval of projects proposed by the various opera-tors.
Additional issues related to CBNG development were later identified during the completion of the Powder River Basin Oil and Gas Project FEIS in 2003, and a new groundwater monitoring approach modified the earlier 1999 Wyodak FEIS program. To address water quality issues and infiltration/recharge inter-actions of produced water on groundwater systems, modifications to the monitoring requirements and approach specified in the 1999 Wyodak FEIS were made. The BLM decided that by increasing the installation complexity of each monitoring site and selecting monitoring locations representative of major geologic conditions, fewer total well sites would be required. A key to reducing the required number of locations was to complete the wells as far ahead of development as possible.
The BLM developed a reduction from the original 140 proposed well sets of the Wyodak record of deci-sion to between 35 and 40 sets of monitoring wells, equaling approximately four townships per well, for CBNG activity in the Wyoming PRB. These 35 to 40 well sets were planned to include addi-tional monitoring zones including underlying sand-stone, multiple coal deposits, and interlying or over-lying sandstones and were to be completed within two years. This would allow for improved baseline data collection and provide a better understanding of the CBNG impacts as well as the dynamics of the groundwater system.
From 2002 to 2003, major CBNG operators met with the BLM and the Petroleum Association of
Wyoming (PAW) and agreed who would be responsi-ble for most of the wells (34 of the proposed 47 sites). It was projected that the remaining 13 monitoring locations would be stipulated as part of the approval of other projects as opportunity and need arose. A cooperative agreement between the BLM and PAW, which represented Devon Energy, Marathon Oil Corporation, Williams Production, and Yates Petroleum Corporation, was signed May 30, 2003. Williams obligations were later divided after 2003 between Williams Production and Western/Lance.
BLM DEEP MONITORING WELL NETWORK DATA COLLECTION
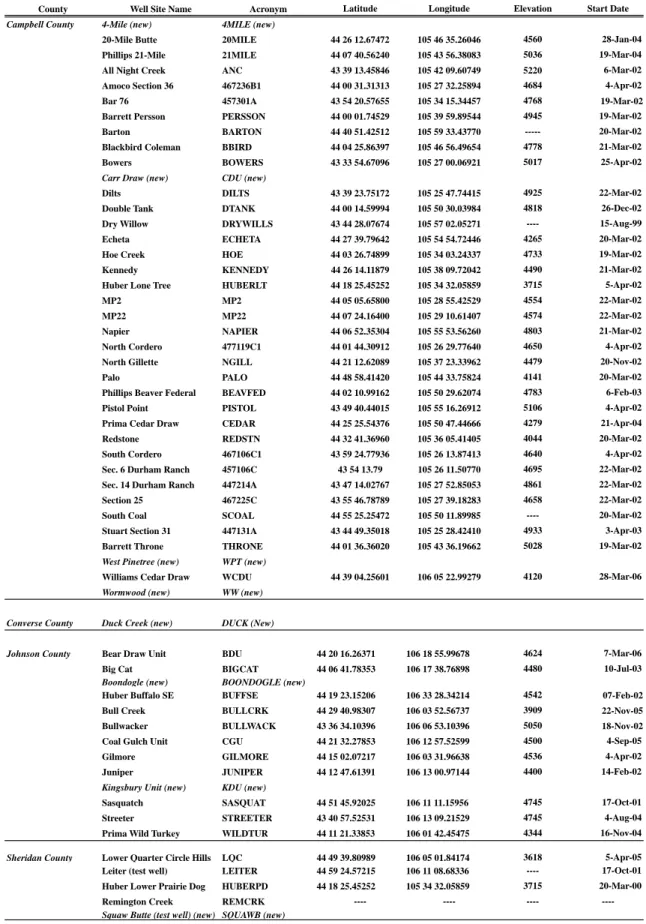
Installation of monitoring equipment in the BLM deep monitoring well network has been conducted by BLM personnel from the Casper Field Office and the Buffalo Field Office. Preliminary locations for the proposed monitoring wells were identified soon after the approval of the 2003 PRB Oil and Gas Project FEIS. Final monitoring well locations were selected as CBNG development progressed into an area or when a preliminary location fell within a pro-posed federal plan of development. Monitoring wells are located on federally owned land where possible. A summary of BLM deep monitoring well data is included in the Appendix. Locations of these wells are illustrated on Figure 1 and detailed in Table 2, and the well site names/acronyms are listed in Table
A-1 in the Appendix. Permit numbers for the BLM wells in the databases of the WOGCC and the WSEO were identified by the WSGS to the extent practicable and added to the summary table (Table
A-1 in the Appendix).
On federal holdings, monitoring wells and equip-ment were installed prior to the commenceequip-ment of most CBNG production to determine baseline water levels. Some CBNG wells were installed on private lands prior to the completion of monitoring wells. Therefore, the decline of groundwater levels in some areas may have begun before baseline water levels were established. As a consequence of this staggered timing, some of the BLM deep monitoring wells do not have an accurate baseline groundwater level established. Most of the BLM deep monitoring wells were installed by CBNG operators during the
develop-ment of a project area. Monitoring well boreholes were drilled to a depth of 100 feet below the lowest gas production zone. Accompanying wire-line gamma-ray log and other geophysical data were ana-lyzed by BLM personnel to select potential underbur-den and overburunderbur-den sandstone zones for monitoring and to design coal zone completions.
All deep monitoring wells were constructed similar to CBNG wells so that the wellhead assembly would withstand high gas pressures. Shallow sandstone wells were constructed for low pressures, as hydraulic communication with underlying coal zones is con-sidered unlikely. Most of the BLM wells have a single steel casing installed to the selected monitoring zone. Some wells are dual completions, where a packer was installed to isolate two different monitoring zones within a single well. The tubing diameter allows for passage of a water-level probe for manual water-level measurements. Some tubes have caused monitoring issues due to constricted annular space.
With the exception of some older wells installed as part of CBNG-exploration activities, most BLM monitoring wells are equipped with continuous-recording equipment. Pressure transducer sensors (installed probes) for recording water level and well-head gas pressure measurements for each monitoring zone are connected to electronic data-logger equip-ment that is powered by solar panels connected to 12-volt batteries.
Monitoring of the wells is conducted by the BLM Buffalo Field Office, and most wells are visited on a monthly to quarterly basis. Manual measurements for water level and wellhead gas pressure are conducted to verify the continuous-recording electronic data. Due to the nature of electronic pressure transduc-ers, the recorded data may drift positively or nega-tively from the accurate measurement of a parameter. Manual measurements allow for the correction of the electronic data drift between each well station visit so that data integrity is maintained. Flexible, small-diameter airlines are also installed in most wells for independent measurement of water levels. These air-line measurements allow for corrections to be made to the electronic water-level measurements, which can be affected by positive borehole gas pressure.
County Well Site Name Acronym Latitude Longitude Elevation Start Date
Campbell County 4-Mile (new) 4MILE (new)
20-Mile Butte 20MILE 44 26 12.67472 105 46 35.26046 4560 28-Jan-04 Phillips 21-Mile 21MILE 44 07 40.56240 105 43 56.38083 5036 19-Mar-04 All Night Creek ANC 43 39 13.45846 105 42 09.60749 5220 6-Mar-02 Amoco Section 36 467236B1 44 00 31.31313 105 27 32.25894 4684 4-Apr-02 Bar 76 457301A 43 54 20.57655 105 34 15.34457 4768 19-Mar-02 Barrett Persson PERSSON 44 00 01.74529 105 39 59.89544 4945 19-Mar-02 Barton BARTON 44 40 51.42512 105 59 33.43770 --- 20-Mar-02 Blackbird Coleman BBIRD 44 04 25.86397 105 46 56.49654 4778 21-Mar-02 Bowers BOWERS 43 33 54.67096 105 27 00.06921 5017 25-Apr-02
Carr Draw (new) CDU (new)
Dilts DILTS 43 39 23.75172 105 25 47.74415 4925 22-Mar-02 Double Tank DTANK 44 00 14.59994 105 50 30.03984 4818 26-Dec-02 Dry Willow DRYWILLS 43 44 28.07674 105 57 02.05271 ---- 15-Aug-99 Echeta ECHETA 44 27 39.79642 105 54 54.72446 4265 20-Mar-02 Hoe Creek HOE 44 03 26.74899 105 34 03.24337 4733 19-Mar-02 Kennedy KENNEDY 44 26 14.11879 105 38 09.72042 4490 21-Mar-02 Huber Lone Tree HUBERLT 44 18 25.45252 105 34 32.05859 3715 5-Apr-02 MP2 MP2 44 05 05.65800 105 28 55.42529 4554 22-Mar-02 MP22 MP22 44 07 24.16400 105 29 10.61407 4574 22-Mar-02 Napier NAPIER 44 06 52.35304 105 55 53.56260 4803 21-Mar-02 North Cordero 477119C1 44 01 44.30912 105 26 29.77640 4650 4-Apr-02 North Gillette NGILL 44 21 12.62089 105 37 23.33962 4479 20-Nov-02 Palo PALO 44 48 58.41420 105 44 33.75824 4141 20-Mar-02 Phillips Beaver Federal BEAVFED 44 02 10.99162 105 50 29.62074 4783 6-Feb-03 Pistol Point PISTOL 43 49 40.44015 105 55 16.26912 5106 4-Apr-02 Prima Cedar Draw CEDAR 44 25 25.54376 105 50 47.44666 4279 21-Apr-04 Redstone REDSTN 44 32 41.36960 105 36 05.41405 4044 20-Mar-02 South Cordero 467106C1 43 59 24.77936 105 26 13.87413 4640 4-Apr-02 Sec. 6 Durham Ranch 457106C 43 54 13.79 105 26 11.50770 4695 22-Mar-02 Sec. 14 Durham Ranch 447214A 43 47 14.02767 105 27 52.85053 4861 22-Mar-02 Section 25 467225C 43 55 46.78789 105 27 39.18283 4658 22-Mar-02 South Coal SCOAL 44 55 25.25472 105 50 11.89985 ---- 20-Mar-02 Stuart Section 31 447131A 43 44 49.35018 105 25 28.42410 4933 3-Apr-03 Barrett Throne THRONE 44 01 36.36020 105 43 36.19662 5028 19-Mar-02
West Pinetree (new) WPT (new)
Williams Cedar Draw WCDU 44 39 04.25601 106 05 22.99279 4120 28-Mar-06
Wormwood (new) WW (new)
Converse County Duck Creek (new) DUCK (New)
Johnson County Bear Draw Unit BDU 44 20 16.26371 106 18 55.99678 4624 7-Mar-06
Big Cat BIGCAT 44 06 41.78353 106 17 38.76898 4480 10-Jul-03
Boondogle (new) BOONDOGLE (new)
Huber Buffalo SE BUFFSE 44 19 23.15206 106 33 28.34214 4542 07-Feb-02 Bull Creek BULLCRK 44 29 40.98307 106 03 52.56737 3909 22-Nov-05 Bullwacker BULLWACK 43 36 34.10396 106 06 53.10396 5050 18-Nov-02 Coal Gulch Unit CGU 44 21 32.27853 106 12 57.52599 4500 4-Sep-05 Gilmore GILMORE 44 15 02.07217 106 03 31.96638 4536 4-Apr-02 Juniper JUNIPER 44 12 47.61391 106 13 00.97144 4400 14-Feb-02
Kingsbury Unit (new) KDU (new)
Sasquatch SASQUAT 44 51 45.92025 106 11 11.15956 4745 17-Oct-01 Streeter STREETER 43 40 57.52531 106 13 09.21529 4745 4-Aug-04 Prima Wild Turkey WILDTUR 44 11 21.33853 106 01 42.45475 4344 16-Nov-04
Sheridan County Lower Quarter Circle Hills LQC 44 49 39.80989 106 05 01.84174 3618 5-Apr-05
Leiter (test well) LEITER 44 59 24.57215 106 11 08.68336 ---- 17-Oct-01 Huber Lower Prairie Dog HUBERPD 44 18 25.45252 105 34 32.05859 3715 20-Mar-00 Remington Creek REMCRK ---- ---- ----
----Squaw Butte (test well) (new) SQUAWB (new)
Table 2. Existing wells and potential new wells of the BLM deep monitoring well network by county, Powder
CHAPTER 2
G
roundwaTer
monITorInG
resulTs
,
1993–2006
The Tongue River Member coal deposits of the Fort Union Formation are the primary target for CBNG development. In the deeper portions of the PRB, groundwater in Tongue River coal deposits is under confining pressure. Tongue River coal aquifers exhibit water-level drawdowns due to the pumping of groundwater from CBNG production wells.
BLM deep monitoring wells constructed into Tongue River coal deposits are monitored for water level in the well and the total gas pressure at the wellhead. Water-level monitoring includes both manual and electronic methods. The water-level data and wellhead gas pressure charts of the BLM deep monitoring well data are included in the Appendix. The coal monitor wells are designed to record total pressure in the closed wellbore and wellhead pressure. The water level can be determined by subtracting the wellhead pressure from the total pressure and converting the remaining pressure into water level below land surface.
The actual drawdowns measured in the Fort Union coal monitoring wells were compared with the predicted 2006 drawdowns contained in the groundwater technical report (AHA and GEC, 2002). The 2002 groundwater model predicted groundwater drawdowns from the model would range from 500 to greater than 750 feet by the year 2006 (AHA and GEC, 2002); however, the greater predicted drawdowns in the AHA and GEC (2002) model were based on a greater degree of CBNG development in the PRB. Measured water-level drawdowns in the BLM coal monitoring wells did not exceed 500 feet except in four wells: HOEC (Wyodak coal), BULLWACKC (Big George coal), JUNIPERC (Big George coal), and 457301A1 (Wyodak coal).
CBNG FIELDS AND MONITORING WELLS
As of the end of 2006, the BLM deep monitoring well network in the Wyoming PRB includes 48 monitoring
well sites, either as single wells or well sets (Figure 1). Well sets define wells that are constructed in different stratigraphic intervals, which include Fort Union (Tongue River Member) coal deposits, Fort Union sandstone beds, and Wasatch sandstone beds. Monitoring wells were constructed during different years and at various spatial locations proximal to the CBNG wells.
Locally, a monitoring well in the immediate vicinity of a pumping CBNG-production well may be within the zone of influence (cone of depression) of a pumping well. As a result, a greater drawdown in the monitoring well may be measured than would likely be measured in a monitoring well at a greater distance from CBNG-pumping wells.
Groundwater levels in some areas had likely been affected by CBNG development prior to the completion of BLM monitoring wells. Therefore, pre-existing drawdowns make it difficult to ascertain the original static water level (baseline level) for monitoring wells and to determine an accurate drawdown value. An evaluation of the collected data for each well is discussed in the Appendix.
Through 2006, the existing BLM deep monitoring well network consisted of 111 wells at 48 sites (Table
A-1 in the Appendix and Figure 1). The network is composed of 58 Fort Union coal wells, two Fort Union underlying sandstone wells, 52 Wasatch sandstone wells, and one Quaternary alluvial sand bed well. The 58 Fort Union coal wells are grouped by coal deposit(s) and summarized below:
6 Anderson coal wells
1 Wyodak/Anderson coal well 16 Big George coal wells
1 Big George/Lower Smith coal well 2 Smith coal wells
19 Wyodak coal wells 4 Canyon coal wells 3 Cook coal wells
1 Cook/Lower Wall/Pawnee coal well 3 Wall coal wells
1 Wall/Pawnee coal well 1 Pawnee coal well
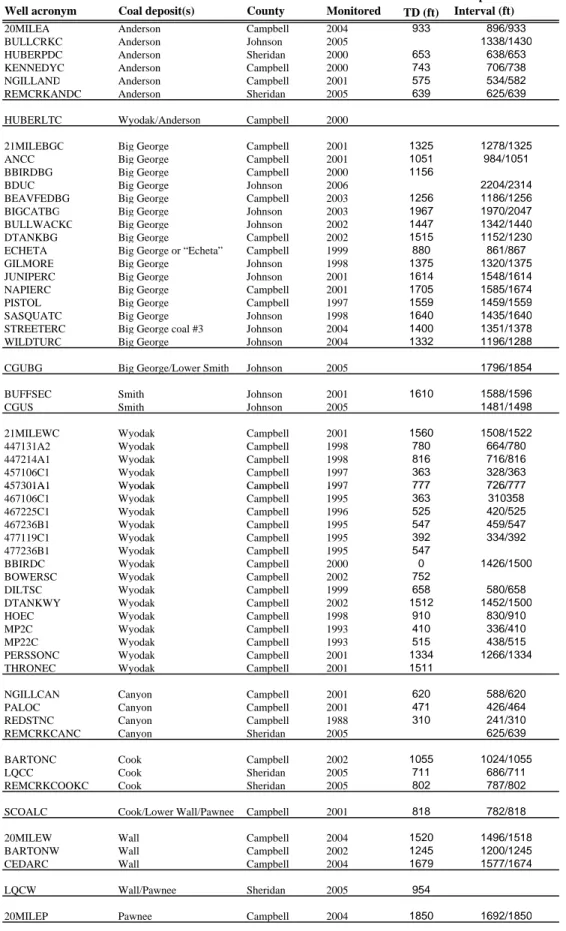
The 58 BLM coal monitoring wells are listed in
Table 3 by well acronym, coal deposit(s), county, and year the well was first monitored. These wells are grouped by coal deposits, and the well locations are shown on Figure 1.
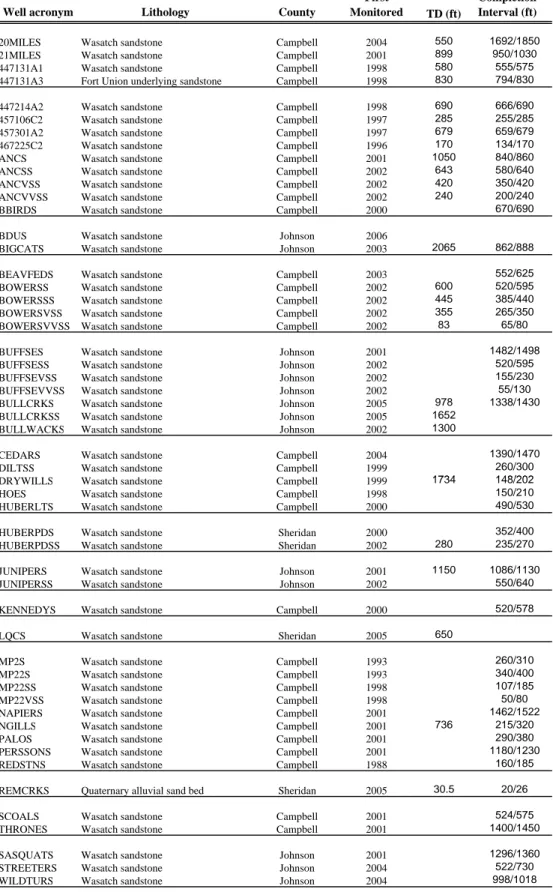
The 54 BLM sandstone and alluvial monitoring wells are listed in Table 4 by well acronym, lithology, county, and year the well was first monitored. These wells are grouped by well sets, and the locations are shown on Figure 1.
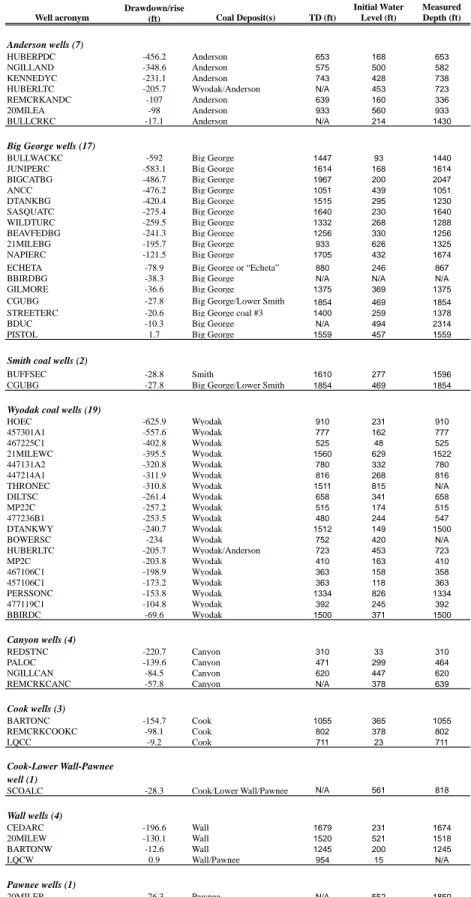
SUMMARY OF WATER-LEVEL DRAWDOWN AND RISE IN MONITORING WELLS
Following is a summary of water-level drawdowns and rises in the Fort Union coal and Wasatch sandstone monitoring wells.
Fort Union Coal Monitoring Wells
Water-level drawdowns measured in the Fort Union coal monitoring wells are largely a function of the length of the monitoring period and the distance from CBNG production wells. The baseline water level has not been determined for all of the BLM deep monitoring wells. Some of the initial water levels in the databases and summary tables should be considered as initial water-level measurements and not as baseline water levels. It is more accurate to consider the first water-level measurements as initial readings that may or may not include some unknown amount of pre-existing drawdown. The greatest CBNG development impacts measured in the Fort Union coal wells from greatest to least water-level drawdown are shown in Table 5.
One Wyodak coal well (467236B1) was not equipped with monitoring equipment, but some manual measurements are available. As shown in Table 5, some coal wells are reported to be completed into two or more coals (e.g., HUBERLTC, Wyodak). The above-listed maximum drawdowns in Table 5 may also be regrouped by coal deposit (Table 5). Multiple-listed coal wells (e.g., HUBERLTC, Wyodak-Anderson) are shown under each coal deposit and are listed two or more times.
As shown in Table 5, monitoring wells in the Big George, Wyodak, and Anderson coals recorded
the largest water-level drawdowns. Two of the 58 Fort Union coal wells (Big George PISTOL and Wall LQCW) in the BLM deep monitoring well network showed a rise in water level from the initial water level. These two coal monitoring wells may be experiencing early aquifer recovery (or local recharge) as the magnitude of CBNG well pumping has declined in the vicinity. Recovery of water levels may occur as groundwater is redistributed in the coal zone from areas of higher head pressure into the lower pressure zone of influence in the CBNG-production area.
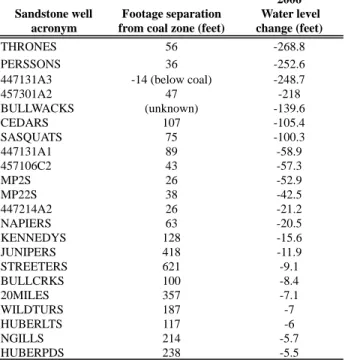
Wasatch Sandstone Monitoring Wells
The Twenty-one Wasatch sandstone wells and one Fort Union sandstone well showed the largest measured drawdown (feet). These are listed in Table
6.
The BLM Wasatch sandstone monitoring wells that showed the largest rise in water level (feet) are shown in Table 7.
The 12 Wasatch sandstone wells in Table 7 may be recharged by surface discharge of CBNG-production water via ponds, reservoirs, and/ or surface drainages. Discharged water may be infiltrating Wasatch aquifers, causing some shallow unconfined or confined groundwater levels to rise. Further evaluation of water-level rise in Wasatch sandstone wells will be conducted in future monitoring reports.
SUMMARY OF WELLHEAD GAS PRESSURES IN FORT UNION COAL WELLS
Wellhead gas pressures in BLM deep monitoring wells were recorded. In a typical CBNG well, the monitored wellhead gas pressures rise as natural gases desorb, while water-levels and formation head pressures (confined pressures) decrease. Over time, wellhead gas pressures decline with progressive CBNG-production (Appendix). The data are collected electronically at the monitoring wellhead. The graphs of the wellhead gas pressures are shown on the hydrographs for the coal monitoring wells in the Appendix. Sandstone monitoring wells were not monitored for wellhead gas pressure. Table 8 shows
457301A1 Wyodak Campbell 1997 777 726/777
Well acronym Coal deposit(s) County
First
Monitored TD (ft)
Completion Interval (ft)
20MILEA Anderson Campbell 2004 933 896/933 BULLCRKC Anderson Johnson 2005 1338/1430 HUBERPDC Anderson Sheridan 2000 653 638/653 KENNEDYC Anderson Campbell 2000 743 706/738 NGILLAND Anderson Campbell 2001 575 534/582 REMCRKANDC Anderson Sheridan 2005 639 625/639 HUBERLTC Wyodak/Anderson Campbell 2000
21MILEBGC Big George Campbell 2001 1325 1278/1325 ANCC Big George Campbell 2001 1051 984/1051 BBIRDBG Big George Campbell 2000 1156
BDUC Big George Johnson 2006 2204/2314
BEAVFEDBG Big George Campbell 2003 1256 1186/1256 BIGCATBG Big George Johnson 2003 1967 1970/2047 BULLWACKC Big George Johnson 2002 1447 1342/1440 DTANKBG Big George Campbell 2002 1515 1152/1230 ECHETA Big George or “Echeta” Campbell 1999 880 861/867 GILMORE Big George Johnson 1998 1375 1320/1375 JUNIPERC Big George Johnson 2001 1614 1548/1614 NAPIERC Big George Campbell 2001 1705 1585/1674 PISTOL Big George Campbell 1997 1559 1459/1559 SASQUATC Big George Johnson 1998 1640 1435/1640 STREETERC Big George coal #3 Johnson 2004 1400 1351/1378 WILDTURC Big George Johnson 2004 1332 1196/1288 CGUBG Big George/Lower Smith Johnson 2005 1796/1854 BUFFSEC Smith Johnson 2001 1610 1588/1596
CGUS Smith Johnson 2005 1481/1498
21MILEWC Wyodak Campbell 2001 1560 1508/1522 447131A2 Wyodak Campbell 1998 780 664/780 447214A1 Wyodak Campbell 1998 816 716/816 457106C1 Wyodak Campbell 1997 363 328/363 457301A1 Wyodak Campbell 1997 777 726/777 467106C1 Wyodak Campbell 1995 363 310358 467225C1 Wyodak Campbell 1996 525 420/525 467236B1 Wyodak Campbell 1995 547 459/547 477119C1 Wyodak Campbell 1995 392 334/392 477236B1 Wyodak Campbell 1995 547
BBIRDC Wyodak Campbell 2000 0 1426/1500
BOWERSC Wyodak Campbell 2002 752
DILTSC Wyodak Campbell 1999 658 580/658 DTANKWY Wyodak Campbell 2002 1512 1452/1500
HOEC Wyodak Campbell 1998 910 830/910
MP2C Wyodak Campbell 1993 410 336/410
MP22C Wyodak Campbell 1993 515 438/515
PERSSONC Wyodak Campbell 2001 1334 1266/1334 THRONEC Wyodak Campbell 2001 1511
NGILLCAN Canyon Campbell 2001 620 588/620
PALOC Canyon Campbell 2001 471 426/464
REDSTNC Canyon Campbell 1988 310 241/310
REMCRKCANC Canyon Sheridan 2005 625/639
BARTONC Cook Campbell 2002 1055 1024/1055
LQCC Cook Sheridan 2005 711 686/711
REMCRKCOOKC Cook Sheridan 2005 802 787/802 SCOALC Cook/Lower Wall/Pawnee Campbell 2001 818 782/818 20MILEW Wall Campbell 2004 1520 1496/1518 BARTONW Wall Campbell 2002 1245 1200/1245 CEDARC Wall Campbell 2004 1679 1577/1674 LQCW Wall/Pawnee Sheridan 2005 954
20MILEP Pawnee Campbell 2004 1850 1692/1850
Table 3. Coal monitoring wells for BLM deep monitoring well network, Powder River Basin, Wyoming
1734 148/202
Well acronym Lithology County
First
Monitored TD (ft)
Completion Interval (ft)
20MILES Wasatch sandstone Campbell 2004 550 1692/1850 21MILES Wasatch sandstone Campbell 2001 899 950/1030 447131A1 Wasatch sandstone Campbell 1998 580 555/575 447131A3 Fort Union underlying sandstone Campbell 1998 830 794/830 447214A2 Wasatch sandstone Campbell 1998 690 666/690 457106C2 Wasatch sandstone Campbell 1997 285 255/285 457301A2 Wasatch sandstone Campbell 1997 679 659/679 467225C2 Wasatch sandstone Campbell 1996 170 134/170 ANCS Wasatch sandstone Campbell 2001 1050 840/860 ANCSS Wasatch sandstone Campbell 2002 643 580/640 ANCVSS Wasatch sandstone Campbell 2002 420 350/420 ANCVVSS Wasatch sandstone Campbell 2002 240 200/240 BBIRDS Wasatch sandstone Campbell 2000 670/690 BDUS Wasatch sandstone Johnson 2006
BIGCATS Wasatch sandstone Johnson 2003 2065 862/888 BEAVFEDS Wasatch sandstone Campbell 2003 552/625 BOWERSS Wasatch sandstone Campbell 2002 600 520/595 BOWERSSS Wasatch sandstone Campbell 2002 445 385/440 BOWERSVSS Wasatch sandstone Campbell 2002 355 265/350 BOWERSVVSS Wasatch sandstone Campbell 2002 83 65/80 BUFFSES Wasatch sandstone Johnson 2001 1482/1498 BUFFSESS Wasatch sandstone Johnson 2002 520/595 BUFFSEVSS Wasatch sandstone Johnson 2002 155/230 BUFFSEVVSS Wasatch sandstone Johnson 2002 55/130 BULLCRKS Wasatch sandstone Johnson 2005 978 1338/1430 BULLCRKSS Wasatch sandstone Johnson 2005 1652
BULLWACKS Wasatch sandstone Johnson 2002 1300
CEDARS Wasatch sandstone Campbell 2004 1390/1470 DILTSS Wasatch sandstone Campbell 1999 260/300 DRYWILLS Wasatch sandstone Campbell 1999 1734 148/202 HOES Wasatch sandstone Campbell 1998 150/210 HUBERLTS Wasatch sandstone Campbell 2000 490/530 HUBERPDS Wasatch sandstone Sheridan 2000 352/400 HUBERPDSS Wasatch sandstone Sheridan 2002 280 235/270 JUNIPERS Wasatch sandstone Johnson 2001 1150 1086/1130 JUNIPERSS Wasatch sandstone Johnson 2002 550/640 KENNEDYS Wasatch sandstone Campbell 2000 520/578 LQCS Wasatch sandstone Sheridan 2005 650
MP2S Wasatch sandstone Campbell 1993 260/310 MP22S Wasatch sandstone Campbell 1993 340/400 MP22SS Wasatch sandstone Campbell 1998 107/185 MP22VSS Wasatch sandstone Campbell 1998 50/80 NAPIERS Wasatch sandstone Campbell 2001 1462/1522 NGILLS Wasatch sandstone Campbell 2001 736 215/320 PALOS Wasatch sandstone Campbell 2001 290/380 PERSSONS Wasatch sandstone Campbell 2001 1180/1230 REDSTNS Wasatch sandstone Campbell 1988 160/185 REMCRKS Quaternary alluvial sand bed Sheridan 2005 30.5 20/26 SCOALS Wasatch sandstone Campbell 2001 524/575 THRONES Wasatch sandstone Campbell 2001 1400/1450 SASQUATS Wasatch sandstone Johnson 2001 1296/1360 STREETERS Wasatch sandstone Johnson 2004 522/730 WILDTURS Wasatch sandstone Johnson 2004 998/1018
Table 4. Sandstone and alluvial monitoring wells for BLM deep monitoring well network, Powder River
Well acronym Drawdown/rise (ft) Coal Deposit(s) TD (ft) Initial Water Level (ft) Measured Depth (ft) Anderson wells (7) HUBERPDC -456.2 Anderson 653 168 653 NGILLAND -348.6 Anderson 575 500 582 KENNEDYC -231.1 Anderson 743 428 738
HUBERLTC -205.7 Wyodak/Anderson N/A 453 723
REMCRKANDC -107 Anderson 639 160 336
20MILEA -98 Anderson 933 560 933
BULLCRKC -17.1 Anderson N/A 214 1430
Big George wells (17)
BULLWACKC -592 Big George 1447 93 1440
JUNIPERC -583.1 Big George 1614 168 1614
BIGCATBG -486.7 Big George 1967 200 2047
ANCC -476.2 Big George 1051 439 1051
DTANKBG -420.4 Big George 1515 295 1230
SASQUATC -275.4 Big George 1640 230 1640
WILDTURC -259.5 Big George 1332 268 1288
BEAVFEDBG -241.3 Big George 1256 330 1256
21MILEBG -195.7 Big George 933 626 1325
NAPIERC -121.5 Big George 1705 432 1674
ECHETA -78.9 Big George or “Echeta” 880 246 867
BBIRDBG -38.3 Big George N/A N/A N/A
GILMORE -36.6 Big George 1375 369 1375
CGUBG -27.8 Big George/Lower Smith 1854 469 1854
STREETERC -20.6 Big George coal #3 1400 259 1378
BDUC -10.3 Big George N/A 494 2314
PISTOL 1.7 Big George 1559 457 1559
Smith coal wells (2)
BUFFSEC -28.8 Smith 1610 277 1596
CGUBG -27.8 Big George/Lower Smith 1854 469 1854
Wyodak coal wells (19)
HOEC -625.9 Wyodak 910 231 910 457301A1 -557.6 Wyodak 777 162 777 467225C1 -402.8 Wyodak 525 48 525 21MILEWC -395.5 Wyodak 1560 629 1522 447131A2 -320.8 Wyodak 780 332 780 447214A1 -311.9 Wyodak 816 268 816
THRONEC -310.8 Wyodak 1511 815 N/A
DILTSC -261.4 Wyodak 658 341 658
MP22C -257.2 Wyodak 515 174 515
477236B1 -253.5 Wyodak 480 244 547
DTANKWY -240.7 Wyodak 1512 149 1500
BOWERSC -234 Wyodak 752 420 N/A
HUBERLTC -205.7 Wyodak/Anderson 723 453 723 MP2C -203.8 Wyodak 410 163 410 467106C1 -198.9 Wyodak 363 158 358 457106C1 -173.2 Wyodak 363 118 363 PERSSONC -153.8 Wyodak 1334 826 1334 477119C1 -104.8 Wyodak 392 245 392 BBIRDC -69.6 Wyodak 1500 371 1500 Canyon wells (4) REDSTNC -220.7 Canyon 310 33 310 PALOC -139.6 Canyon 471 299 464 NGILLCAN -84.5 Canyon 620 447 620
REMCRKCANC -57.8 Canyon N/A 378 639
Cook wells (3) BARTONC -154.7 Cook 1055 365 1055 REMCRKCOOKC -98.1 Cook 802 378 802 LQCC -9.2 Cook 711 23 711 Cook-Lower Wall-Pawnee well (1)
SCOALC -28.3 Cook/Lower Wall/Pawnee N/A 561 818
Wall wells (4) CEDARC -196.6 Wall 1679 231 1674 20MILEW -130.1 Wall 1520 521 1518 BARTONW -12.6 Wall 1245 200 1245 LQCW 0.9 Wall/Pawnee 954 15 N/A Pawnee wells (1)
20MILEP -76.3 Pawnee N/A 552 1850
Table 5. Maximum water-level drawdowns and rises grouped by coal deposit for the Fort Union Formation
the BLM coal monitoring wells that recorded the presence or absence of methane.
As shown in Table 8, monitoring wells in the Big George, Wyodak, and Anderson recorded the largest wellhead gas pressures. Sensors are designed to withstand 4x over-pressures without damage; however, sensors may fail to read pressures greater than design pressure. The pressure transducer probes monitoring two Big George coal wells (BULLWACKC and JUNIPERC) were damaged by excessive gas pressures, both wells recording more than 300 psi.
Some of the monitored coal deposits showed little to no build-up of wellhead gas pressures. Coal monitoring wells with the lowest wellhead gas pressure are shown in Table 9. These monitoring wells show no evidence of natural gas pressure. Wellhead gas pressure data are plotted over time on the well graphs in the Appendix.
A summary discussion of the wellhead gas pressures by coal deposit follows:
• Anderson wellhead gas pressure – The maxi-mum wellhead gas pressures in four of the seven Anderson coal wells peaked in the second quarter of 2002 for HUBERLTC; in the first quarter of 2004 for 20MILEA; in the first quarter of 2004 for HUBER-PDC; and in the third quarter of 2005 for REMCRKANDC (Appendix). The well-head gas pressure curve for HUBERLTC or LTREEC well is an excellent example of a typical CBNG-production decline of gas pressure over time (Appendix). Wellhead pressures were very low for the remaining three Anderson coal wells (BULLCRKC, KENNEDYC, and NGILLAND) (Appen-dix).
• Big George wellhead gas pressure – The maximum wellhead gas pressures in four of the 17 Big George coal wells peaked in the fourth quarter of 2003 for BULLWACKC; in the fourth quarter of 2003 for ANCC; in the fourth quarter of 2004 for JUNIPERC; and in the third quarter of 2006 for
WILD-TURC (Appendix). The Big George coal wellhead gas pressure curves exhibit a typi-cal CBNG-production decline of gas pres-sure over time. The recorded prespres-sures are
Sandstone well acronym
Footage separation from coal zone (feet)
2006 Water level change (feet)
THRONES 56 -268.8
PERSSONS 36 -252.6
447131A3 -14 (below coal) -248.7
457301A2 47 -218 BULLWACKS (unknown) -139.6 CEDARS 107 -105.4 SASQUATS 75 -100.3 447131A1 89 -58.9 457106C2 43 -57.3 MP2S 26 -52.9 MP22S 38 -42.5 447214A2 26 -21.2 NAPIERS 63 -20.5 KENNEDYS 128 -15.6 JUNIPERS 418 -11.9 STREETERS 621 -9.1 BULLCRKS 100 -8.4 20MILES 357 -7.1 WILDTURS 187 -7 HUBERLTS 117 -6 NGILLS 214 -5.7 HUBERPDS 238 -5.5
Table 6. Maximum water-level drawdowns measured
in the sandstone wells of the Wasatch Formation and Fort Union Formation monitoring wells, Powder River Basin, Wyoming (1993–2006). Note: Well 447131A3 is a Fort Union Formation underlying sandstone well; the rest are Wasatch.
Well acronym
Footage separation from coal zone (feet)
Water-level rise (feet) ANCS 124 26.1 BUFFSESS 993 11.3 BUFFSES 90 9.8 BUFFSEVVSS 1458 3.2 REDSTNS 56 2.6 BOWERSVVSS 632 1.1 ANCVVSS 744 0.6 BOWERSS 117 0.5 ANCVSS 564 0.3 21MILES 197 0.2 BOWERSVSS 362 0.2 BUFFSEVSS 1,358 0
Table 7. Maximum water-level rises measured in
the Wasatch Formation sandstone monitoring wells, Powder River Basin, Wyoming (1993–2006).
Well acronym Wellhead gas pressure
(psi) Coal deposit(s)
BULLWACKC 311.1 Big George
JUNIPERC 221.3 Big George
DILTSC 92.6 Wyodak
457106C1 83.7 Wyodak
WILDTURC 80.9 Big George
HUBERLTC 66.7 Wyodak/Anderson 467225C1 63.8 Wyodak MP22C 61.2 Wyodak 457301A1 61 Wyodak REMCRKANDC 60.4 Anderson HOEC 60.4 Wyodak REDSTNC 58.4 Canyon PALOC 55.9 Canyon 467106C1 55.3 Wyodak
ANCC 48.5 Big George
HUBERPDC 45.1 Anderson 447131A2 37.9 Wyodak 477236B1 34.1 Wyodak 477119C1 33.8 Wyodak 21MILEWC 28.6 Wall 447214A1 28.1 Wyodak MP2C 26.8 Wyodak CGUS 21.9 Smith 20MILEA 19.4 Anderson
21MILEBG 15.3 Big George
ECHETA 14 Big George or “Echeta”
SCOALC 12.7 Cook/Lower
Wall/Pawnee
Table 8. Highest recorded wellhead gas pressures by well and coal deposit, Powder River Basin, Wyoming
(1993–2006).
Well acronym
Wellhead gas
pressure (psi) Coal deposit
STREETERC 0.1 Big George #3
REMCRKCOOKC 0.1 Cook
NAPIERC 0.2 Big George
CEDARC 0.2 Wall
BDUC 0.2 Big George
BARTONC 0.2 Cook
REMCRKCANC 0.3 Canyon
GILMORE 0.3 Big George
Table 9. Lowest recorded wellhead gas pressures by well and coal deposit, Powder River Basin, Wyoming