August 2013
PFMR 13-03
Department of Agricultural and Resource Economics, Fort Collins, CO 80523-1172
http://dare.colostate.edu/pubs/PFMR/PFMR%2011-02.pdfPrecipitation, whether realized as rain showers during the growing season or stored as snowmelt in reservoirs, is critical for crop and pasture production in Colorado. Drought is the persistent absence of precipitation, and this lack of moisture results in reduced yields, fewer harvested acres and less forage for livestock. Since October of 2010, extreme drought has plagued agricul-tural producers throughout much of Southern Colora-do, and in May of 2012 the drought advanced to encompass the entire state (U.S. Drought Monitor Archive, 2013). Agriculture is absorbing faced with economic hardship and drought impacts statewide. Given agriculture’s prominent role as a base industry in rural regional economies, the impact of drought extends well beyond lost crop and livestock revenues. Declining revenues lead to fewer input purchases and less labor income is spent in rural towns. Main Street businesses may also suffer from a drought induced re-duction of economic activity. (Bauman et al, 2013) The primary objective of this research is to describe and quantify the broader economic impacts of the drought on agricultural productivity and allied economic activity in Colorado. The scope of the anal-ysis takes three forms: a description of agricultural
production and prices received for important Colorado crops; calculation of actual 2012 crop revenues juxta-posed against what might have been received if har-vested acres and yields were consistent with historical averages; and a broader estimate of the drought’s eco-nomic impact by accounting for reduced input purchas-es and wagpurchas-es spent locally.
Overall Drought Impacts:
Table 1 summarizes an estimate of crop revenues in 2012. The values are calculated from data reported by the US Department of Agriculture, National Agricul-ture Statistics Service (NASS) including estimates of planted acres, harvested acres, yields and marketing year prices.
While not an exhaustive list, the crops listed in the first column of Table 1 represent more than ninety percent of crop production in the state and includes both irri-gated and non-irriirri-gated cropping. The second column represents an estimate of revenues in which the 2012 marketing year price is multiplied by the 2012 statewide average yield and 2012 harvested acres. Corn grain production represents the greatest revenue generator ($947 million) followed by hay production ($885 million) and wheat production ($602 million). Total crop sales are approximately $2.9 billion.
2012 DROUGHT IN COLORADO: ESTIMATES OF FOREGONE REVENUES, INDIRECT
AND INDUCED ECONOMIC ACTIVITY FOR THE CROP SECTOR
Christopher Goemans, James Pritchett and Ron Nelson1
1Authors are Associate Professor, Professor and Graduate Research Associate, respectively, Department of Agricultural and
In spite of the drought, total revenues are significantly higher than the ten year average of 2000 through 2010 that is reported at the bottom of the third column as $1.65 billion. The difference between 2012 revenues and the average amounts are very strong commodity prices in 2012. Persistently high prices were also observed in 2011.
Higher prices mitigate some drought impacts, but farmers experiencing yield losses and/or abandoning planted acres did miss an opportunity to sell some of their crop at higher prices. The fourth column is an estimate of this “foregone” potential – values represent the 2012 marketing year price multiplied by average yields (year 2000 to 2010) multiplied by planted acres for 2012 multiplied by the historical average ratio of harvested to planted acres. More simply, if farmers had an average year in producing crops, but sold at 2012 prices, they would have received $3.3 billion, or about $409 million more than was actually received. The $409 million of foregone revenues may also be spent on crop inputs or as labor income, both of which might have contributed to other economic activity in the local community. This indirect and induced
eco-nomic activity is based on an ecoeco-nomic concept called a “multiplier.” In this context, a multiplier is the total reduction in economic activity divided by the amount of foregone revenues. In sum, the $409 million of fore-gone revenues (second column of Table 2) resulted in more than $726 million in foregone economic activity (last column of Table 2).
Planted acres are abandoned rather than harvested when the revenues from the crop are smaller than har-vest costs. Abandoned acres are one explanation for the $409 million of foregone revenues, but not for eve-ry crop. When examining Table 3, large proportions of traditionally non-irrigated crops were not harvested: sunflowers, millet and sorghum. The exception is wheat, most of which is grown as a non-irrigated crop in Colorado. Why the difference? Note that sunflower, millet and sorghum are crops sown in the Spring and harvested in the Fall, whereas wheat is planted in the previous September/October and harvested in July. The full impact of the drought was not realized statewide until mid to late summer 2012 after wheat had been harvested. Thus wheat would not be as af-fected by the 2012 drought when compared to other crops.
Table 1. 2012 and Average Revenues for Selected Colorado Crops
2012 Revenues
2000 - 2010 Average Revenue
What Might Have
Been Revenuesa
Difference Between 2012 Revenues and
What Might Have Been Crops Barley $45,663,750 $29,513,530 $46,967,828 -$1,304,078 Corn Grain $947,026,500 $514,752,255 $1,201,519,061 -$254,492,561 Corn Silage $166,400,000 $62,668,182 $183,040,000 -$16,640,000 Dry Beans $32,457,600 $26,968,564 $30,009,411 $2,448,189
Hay (alfalfa & other) $885,198,000 $473,898,618 $960,408,099 -$75,210,099
Millet $22,848,000 $20,393,591 $63,542,169 -$40,694,169 Potatoes $150,678,450 $188,995,952 $145,700,620 $4,977,830 Sorghum $20,328,000 $14,940,581 $34,285,537 -$13,957,537 Sunflower $18,313,120 $22,091,421 $28,005,838 -$9,692,718 Wheat $602,482,930 $301,562,112 $606,979,514 -$4,496,584 Total $2,891,396,350 $1,655,784,805 $3,300,458,076 -$409,061,726
1What Might Have Been Revenues are 2012 prices multiplied
by historical average yields multiplied by 2012 planted acres multiplied by the historical ratio of harvested acres to planted acres.
Table 2. Economic Activity Lost as a Result of Foregone Revenues
Crop
Difference Between 2012 Revenues and
What Might Have Been
Foregone Indirect and In-duced Economic Activity
Sum of Foregone Reve-nues, Indirect and In-duced Economic Activity
Barley (bu/ac) $1,304,078 $988,322 $2,292,400
Corn Grain (bu/ac) $254,492,561 $192,872,377 $447,364,938
Corn Silage (tons/ac) $16,640,000 $12,610,963 $29,250,963
Dry Beans (lbs/ac) -$2,448,189 -$1,855,410 -$4,303,598
Hay (tons/ac) $75,210,099 $66,040,493 $141,250,592 Millet (bu/ac) $40,694,169 $30,840,906 $71,535,074 Potatoes (cwt/ac) -$4,977,830 -$3,801,866 -$8,779,697 Sorghum (bu/ac) $13,957,537 $10,578,004 $24,535,541 Sunflower (lbs/ac) $9,692,718 $5,483,312 $15,176,030 Wheat (bu/ac) $4,496,584 $3,407,828 $7,904,411 Total $409,061,726 $317,164,929 $726,226,655
Table 3. Comparison of Planted vs. Harvested Acres for Selected Crops
2012 2000 - 2010 Average
Crops Planted Acres Harvested Acres Planted Acres Harvested Acres
Barley 58,000 55,000 76,818 72,091
Corn Grain 1,420,000 1,010,000 1,184,545 995,455
Corn Silage N/Aa 160,000 N/Aa 108,182
Dry Beans 50,000 45,000 76,636 68,545
Hay N/Ab 1,460,000 N/Ab 1,529,091
Millet 210,000 120,000 261,818 226,818
Potatoes 60,500 59,900 68,173 67,700
Sorghum 245,000 150,000 251,818 155,455
Sunflower 86,000 70,000 151,000 132,727
Wheat 2,363,000 2,182,000 2,438,455 2,122,909
aCorn silage acres are reported as “Corn” for planting, but separated into “grain” and “silage” categories at harvest. bHay is alfalfa and other, but are only reported as harvested acres by USDA-NASS
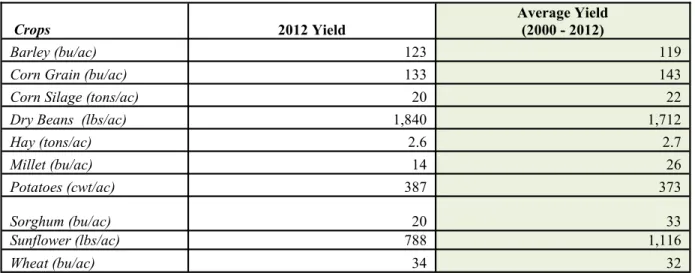
Declining yields might also account for foregone reve-nues, though these could be partially offset by higher prices. Table 4 compares averages yields (irrigated and
non irrigated prices. Table 4 illustrates the prices re-ceived for these crops relative to their historical aver-ages.
Table 4. Selected Colorado Crop Yields in 2012 and on Average (2000 – 2010)
Crops 2012 Yield Average Yield (2000 - 2012)
Barley (bu/ac) 123 119
Corn Grain (bu/ac) 133 143
Corn Silage (tons/ac) 20 22
Dry Beans (lbs/ac) 1,840 1,712
Hay (tons/ac) 2.6 2.7 Millet (bu/ac) 14 26 Potatoes (cwt/ac) 387 373 Sorghum (bu/ac) 20 33 Sunflower (lbs/ac) 788 1,116 Wheat (bu/ac) 34 32
Table 5. Marketing Year Price Received for Selected Crops
2012 Price Received Average Price Received (2010-2010)
Crops
Barley ($/bu) $6.75 $3.45
Corn Grain ($/bu) $7.05 $3.04
Corn Silage ($/ton) $52.00 $26.41
Dry Beans ($/cwt) $39.20 $24.39 Hay ($/ton) $235.00 $114.95 Millet ($/bu) $13.60 $3.81 Potatoes ($/cwt) $6.50 $7.73 Sorghum ($/bu) $6.78 $2.74 Sunflower ($/lb) $0.33 $0.15 Wheat ($/bu) $8.05 $4.21
Notable reduction in yields is observed for sunflowers, sorghum, millet and corn for grain. Tremendously improved prices can be observed for all crops except potatoes. While the high prices offset revenue losses for farmers, they represent a severe price shock for the buyers of these inputs such as cow-calf producers, feedlots and millers.
The 2012 drought is with few precedents in its intensity and geographic reach. Drought impacts include sharply reduced yields and substantial aban-doned acres. Losses were mitigated by historically high prices. These prices are the direct result of short national supplies when the drought’s reach extended to much of the United States. As a result, the revenues generated by Colorado crop production were well above the historical average of years 2000 through 2010. However, these revenues also represent a
missed opportunity – Colorado farmers would have benefitted tremendously if production had been closer to the average. Indeed, foregone revenues total $409 million that would have generated more than $317 mil-lion of additional spending in local communities. This analysis is but one narrative of the 2012 drought. Important impacts that are not represented are the increased costs borne by livestock producers purchas-ing forage and grain when prices were at historically high levels. Some of these producers chose to liquidate livestock production rather than experience continued losses. A second important narrative is how farm and ranch resiliency was eroded by the drought. The erod-ed resiliency is directly tierod-ed to debt and an inability to generate cash flow for making payments. The drought persists into 2013 further challenging the viability of some agricultural enterprises
For more information on research related the econom-ic impacts of drought consider:
Bauman et al, 2013, Estimating the Economic and Social Impacts from the Drought in Southern Colorado, Journal of Contemporary Water Research & Education, Issue 151, Au-gust 2013.
Nelson, R., C. Goemans and J. Pritchett. 2013. Farmer Re-siliency Under Drought Conditions. PFMR 13-02. Depart-ment of Agricultural and Resource Economics., Colorado State University. http://webdoc.agsci.colostate.edu/DARE/ PFMR/PFMR%2013-02.pdf
Pritchett, J. . Goemans and R. Nelson. 2013. Adaptations to Drought: Evidence from a Producer Survey. PFMR 13-01. Department of Agricultural and Resource Economics, Colo-rado State University. http://webdoc.agsci.colostate.edu/ DARE/PFMR/PFMR%2013-01.pdf