Tec hni c al Report
TR16-12
Ag
ricultural
Experiment Station
College of Agricultural Sciences Department of BioagriculturalSciences and Pest Management
2014 Colorado Field Crop
Insect Management Research
and Demonstration Trials
2014 Colorado Field Crop
Insect Management Research
and Demonstration Trials
1Frank B. Peairs2 Jeff Rudolph2
Terri L. Randolph2 Darren Cockrell
1
Mention of a trademark or proprietary product does not constitute endorsement by the Colorado Agricultural Experiment Station.
2Department of Bioagricultural Sciences and Pest Management, Colorado State University
Colorado State University is an equal opportunity/affirmative action institution and complies with all Federal and Colorado State laws, regulations, and executive orders regarding affirmative action requirements in all programs. The Office of Equal Opportunity is located in 101 Student Services. In order to assist Colorado State University in meeting its affirmative action responsibilities, ethnic minorities, women, and other protected class members are encouraged to apply and to so identify themselves.
TABLE OF CONTENTS
CONTROL OF BIOTYPE RWA2 RUSSIAN WHEAT APHID IN WINTER WHEAT WITH HAND-APPLIED
INSECTICIDES, ARDEC, FORT COLLINS, CO, 2014. . . 2
CONTROL OF BIOTYPE 2 RUSSIAN WHEAT APHID IN SPRING WHEAT WITH SEED TREATMENTS, ARDEC, FORT COLLINS, CO, 2014. . . 5
CONTROL OF BIOTYPE RWA2 RUSSIAN WHEAT APHID IN SPRING BARLEY WITH HAND-APPLIED INSECTICIDES, ARDEC, FORT COLLINS, CO, 2014. . . 7
CONTROL OF WHEAT STEM SAWFLY IN WINTER WHEAT, NEW RAYMER, CO, 2014. . . 9
CONTROL OF ALFALFA INSECTS IN ALFALFA WITH HAND-APPLIED INSECTICIDES, ARDEC, FORT COLLINS, CO, 2014. . . 11
CONTROL OF ALFALFA INSECTS WITH EARLY AND LATE WARRIOR II TREATMENTS, ARDEC, FORT COLLINS, CO, 2014. . . 16
CONTROL OF WESTERN CORN ROOTWORM IN FIELD CORN WITH PLANTING-TIME SOIL INSECTICIDES, SEED TREATMENTS, AND PLANT-INCORPORATED PROTECTANTS, ARDEC, FORT COLLINS, CO, 2014. . . 18
CONTROL OF SPIDER MITES IN CORN WITH HAND-APPLIED INSECTICIDES AND MITICIDES, ARDEC, FORT COLLINS, CO, 2014. . . 20
CONTROL OF WESTERN BEAN CUTWORM IN FIELD CORN HYBRIDS WITH COMMERCIAL Bt EVENTS, ARDEC, FORT COLLINS, CO, 2014.. . . 24
2014 PEST SURVEY RESULTS. . . 25
INSECTICIDE PERFORMANCE SUMMARIES.. . . 30
ACKNOWLEDGMENTS. . . 34
CONTROL OF BIOTYPE RWA2 RUSSIAN WHEAT APHID IN WINTER WHEAT WITH HAND-APPLIED INSECTICIDES, ARDEC, FORT COLLINS, CO, 2014
Jeff Rudolph, Terri Randolph, Frank Peairs, Darren Cockrell, Claire Tovrea, Christene Ward, Matthew Miller, and Michael Mayfield, Department of Bioagricultural Sciences and Pest Management
CONTROL OF RUSSIAN WHEAT APHID IN WINTER WHEAT WITH HAND-APPLIED INSECTICIDES, ARDEC, FORT COLLINS, CO, 2014: Treatments were applied on 5 May 2014 with a 'rickshaw-type' CO2 powered
sprayer calibrated to apply 20 gal/acre at 3 mph and 32 psi through three 8002 (LF2) nozzles mounted on a 5.0 ft boom. Conditions at the time of treatment were mostly cloudy and 55EF with 3-6 Mph winds from the southwest. Plots were 6 rows (5.0 ft) by 25.0 ft and were arranged in six replicates of a randomized, complete block design. Crop stage at application was tillering (Zadoks 20-25). The crop had been infested with greenhouse-reared Biotype RWA2 aphids on 12 March and 1 April 2014. Treatments were evaluated for Russian wheat aphid control by collecting 20 symptomatic tillers along the middle four rows of each plot 10, 15 and 21 days after treatment (DAT). Tiller samples were placed in Berlese funnels for 24 hours to extract aphids into alcohol for counting. Symptomatic tiller samples taken the day before treatment averaged 3.9 Russian wheat aphids per tiller.
A naturally occurring brown wheat mite infestation was evaluated by taking two five-second
subsamples per plot with a Vortis suction sampler and placing the collected material in Berlese funnels for 48 h to extract mites into alcohol for counting. Each subsample was collected from an area 0.2 m2 in
size. The brown wheat mite precounts taken the day before treatment averaged 154.2 mites per sample.
Aphid and mite counts were transformed by the log + 1 method to correct for nonadditivity, and transformed counts were used for analysis of variance and mean separation by Tukey’s HSD test
(á=0.05). Original means are presented in Table 1. Total aphid days per tiller were calculated according the method of Ruppel (Journal of Economic Entomology 76: 375-7, 1983), transformed by the log + 1 method, and analyzed in the same manner, with original means presented in Table 1.
Aphid pressure was much higher than in 2013, with approximately 127 aphid days/tiller in the untreated control 21 DAT (Table 1) compared to 38 aphid days/tiller 21 DAT in 2013. Crop condition was poor. All treatments had fewer aphid days than the untreated control. No treatment reduced total aphid days over three weeks by 90% or more, the level of performance observed by the more effective treatments in past experiments. Brown wheat mite abundance was similar to 2013, with ca. 154 mites/sample in the precount, compared to ca. 136 mites per precount sample in 2013. Only the Baythroid XL and sulfoxaflor treatments did not reduce mite abundance relative to the untreated control (Table 2). No phytotoxicity was observed with any treatment.
Field History
Pest: Russian wheat aphid, Diuraphis noxia (Kurdjumov)
Brown wheat mite, Petrobia latens (Müller)
Cultivar: 'Thunder CL'
Planting Date: 30 September 2013
Irrigation: Pre planting, with a “big gun” irrigation device Crop History: Oats in 2013
Herbicide: Huskie, 13 oz + Olympus, 0.9 oz + 0.15 pt NIS + 25 lb, 32-0-0 on 19 April 20143
Insecticide: None prior to experiment
Fertilization: None
Soil Type: Sandy clay loam
Location: ARDEC, 4616 North Frontage Road, Fort Collins, CO 80524 Field 3140, SW corner, N40.66470, W105.00015
Table 1. Control of Russian wheat aphid in winter wheat with hand-applied insecticides, ARDEC, Fort Collins, CO. 2014.
APHIDS PER TILLER ± SE1 APHID DAYS PER BROWN WHEAT MITES PER 0.4 M2 IN 5 SEC1 ± SE
PRODUCT, FL. OZ/ACRE 10 DAT 15 DAT 21 DAT TILLER2 ± SE
Lorsban Advanced, 16 fl oz 0.0 ± 0.0 B 0.0 ± 0.0 B 0.0 ± 0.0 B 19.7 ± 0.3 B 1.3 ± 0.8 D Stallion, 11.75 fl oz 0.0 ± 0.0 B 0.1 ± 0.1 B 0.0 ± 0.0 B 19.9 ± 1.4 B 0.0 ± 0.0 D Warrior II 2.09 CS, 1.92 oz/acre 0.1 ± 0.0 B 0.1 ± 0.1 B 0.0 ± 0.0 B 20.3 ± 1.4 B 0.7 ± 0.5 D MustangMax, 4.0 fl oz 0.1 ± 0.0 B 0.0 ± 0.0 B 0.1 ± 0.0 B 20.4 ± 1.1 B 4.0 ± 1.1 CD Dimethoate 267, 16 fl oz 0.0 ± 0.0 B 0.2 ± 0.1 B 0.1 ± 0.0 B 21.1 ± 2.1 B 1.2 ± 0.7 D Cobalt Advanced, 11 fl oz 0.1 ± 0.0 B 0.3 ± 0.3 B 0.0 ± 0.0 B 21.4 ± 3.6 B 0.0 ± 0.0 D
Endigo ZC, 4 oz/acre + COC 1% v/v 0.1 ± 0.1 B 0.3 ± 0.3 B 0.0 ± 0.0 B 21.8 ± 5.4 B 3.7 ± 2.3 CD
Baythroid XL, 2.4 oz/acre 0.4 ± 0.3 AB 0.6 ± 0.5 B 0.3 ± 0.2 AB 27.2 ± 12.2 B 10.2 ± 5.0 BCD
Sulfoxaflor 1.5 oz + COC 1% v/v 0.5 ± 0.2 AB 1.3 ± 0.5 B 0.4 ± 0.2 AB 32.3 ± 11.5 B 19.2 ± 4.5 ABC
Sulfoxaflor 0.75 oz + COC 1% v/v 1.3 ± 0.7 AB 0.6 ± 0.3 B 0.2 ± 0.1 B 33.1 ± 14.8 B 34.0 ± 8.9 A
Untreated Control 2.4 ± 1.6 A 13.4 ± 10.8 A 2.7 ± 2.1 A 127.1 ± 205.0 A 31.5 ± 17.0 AB
F value 3.97 5.81 3.72 5.55 9.87
p>F 0.0005 0.0000 0.0009 0.0000 0.0000
1
SE, standard error of the mean. Means in the same column followed by the same letters(s) are not statistically different, Tukey’s HSD (%=0.05).
2
Total aphid days per tiller calculated by the Ruppel method.
CONTROL OF BIOTYPE RWA2 RUSSIAN WHEAT APHID IN SPRING WHEAT WITH SEED TREATMENTS, ARDEC, FORT COLLINS, CO, 2014
Jeff Rudolph, Terri Randolph, Frank Peairs, Darren Cockrell, Claire Tovrea, Christene Ward, Brandyn Davis, and Matt Miller, Department of Bioagricultural Sciences and Pest Management
CONTROL OF RUSSIAN WHEAT APHID IN SPRING WHEAT WITH SEED TREATMENTS, ARDEC, FORT COLLINS, CO, 2014: Treated seeds were planted at 100 lb of seed per acre on 9 April 2014 using a small
plot precision cone planter. ‘Bullseye’ spring wheat seed had been treated by Syngenta Seeds, Stanton, MN. Plots were 6 rows (5.0 ft) by 25 ft and were arranged in six replicates of a randomized, complete block design. Three ft sections of the two middle rows of each plot were infested with ca. 75
greenhouse-reared Biotype RWA2 Russian wheat aphids per row ft on 6 May 2014.
Treatments were evaluated for Russian wheat aphid control by collecting 20 tillers at random from the infested area of each plot on 5 May and 9 June 2014. Tiller samples were placed in Berlese funnels for 24 hours to extract aphids into alcohol for counting.
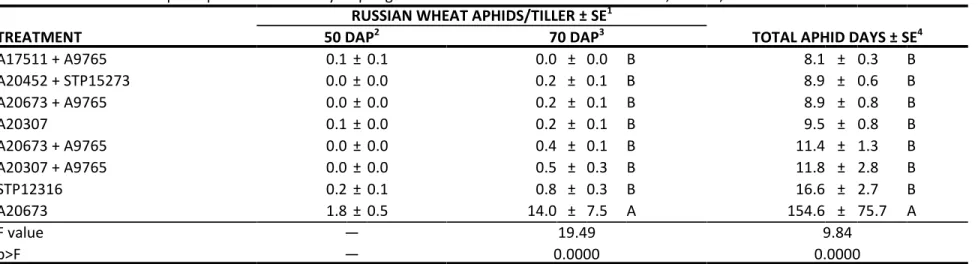
Aphid counts were transformed by the log + 1 method to correct for nonadditivity, and transformed counts were used for analysis of variance and mean separation by Tukey’s HSD test (á=0.05). Total Russian wheat aphid days each treatment were calculated according to the method of Ruppel (Journal of Economic Entomology 76: 375-7, 1983), transformed by the log +1 method, and analyzed in the same manner. Original means for both aphid counts and aphid days are presented in Table 2.
Aphid abundance was moderate and uneven, likely due to above average precipitation. Treatment A20673 had more aphids than any other treatment. Crop condition was good, and no phytotoxicity was observed with any treatment.
Field History
Pest: Russian wheat aphid, Diuraphis noxia (Kurdjumov)
Cultivar: 'Bullseye'
Planting Date: 9 April 2014
Irrigation: Pre planting, linear move sprinkler with drop nozzles Crop History: Spring barley with conventional tillage in 2013
Herbicide: Husky, 13 oz/acre on 23 May 2014
Insecticide: None prior to experiment
Fertilization: None
Soil Type: Sandy clay loam
Location: ARDEC, 4616 North Frontage Road, Fort Collins, CO 80524 (Block 1080 north, W 40.65580, W 104.99686)
Table 2. Russian wheat aphids per tiller in ‘Bullseye’ spring wheat with insecticidal seed treatments, ARDEC, 2014. RUSSIAN WHEAT APHIDS/TILLER ± SE1
TREATMENT 50 DAP2 70 DAP3 TOTAL APHID DAYS ± SE4
A17511 + A9765 0.1 ± 0.1 0.0 ± 0.0 B 8.1 ± 0.3 B A20452 + STP15273 0.0 ± 0.0 0.2 ± 0.1 B 8.9 ± 0.6 B A20673 + A9765 0.0 ± 0.0 0.2 ± 0.1 B 8.9 ± 0.8 B A20307 0.1 ± 0.0 0.2 ± 0.1 B 9.5 ± 0.8 B A20673 + A9765 0.0 ± 0.0 0.4 ± 0.1 B 11.4 ± 1.3 B A20307 + A9765 0.0 ± 0.0 0.5 ± 0.3 B 11.8 ± 2.8 B STP12316 0.2 ± 0.1 0.8 ± 0.3 B 16.6 ± 2.7 B A20673 1.8 ± 0.5 14.0 ± 7.5 A 154.6 ± 75.7 A F value — 19.49 9.84 p>F — 0.0000 0.0000 1
SE, standard error of the mean. Means in the same column followed by the same letter(s) are not statistically different, Tukey’s HSD (%=0.05).
2One day prior to artificial infestation 3
19 days after artificial infestation
4
Calculated by the Ruppel method.
CONTROL OF BIOTYPE RWA2 RUSSIAN WHEAT APHID IN SPRING BARLEY WITH HAND-APPLIED INSECTICIDES, ARDEC, FORT COLLINS, CO, 2014
Jeff Rudolph, Terri Randolph, Frank Peairs, Darren Cockrell, Claire Tovrea, Brandyn Davis, Christene Ward, and Matt Miller, Department of Bioagricultural Sciences and Pest Management
CONTROL OF RUSSIAN WHEAT APHID IN SPRING BARLEY WITH HAND-APPLIED INSECTICIDES, ARDEC, FORT COLLINS, CO, 2014: Treatments were applied on 23 May 2014 with a 'rickshaw-type' CO2
powered sprayer calibrated to apply 20 gal/acre at 3 mph and 32 psi through three 8002 (LF2) nozzles mounted on a 5.0 ft boom. Conditions during treatment were 68EF, clear skies, and S wind at 0-3 mph. Plots were 6 rows (5.0 ft) by 25.0 ft and were arranged in six replicates of a randomized, complete block design. Crop stage at application was tillering (Zadoks 25). The crop had been infested with
greenhouse-reared Russian wheat aphid biotype RWA2 on 6 May 2014.
Treatments were evaluated for Russian wheat aphid control by collecting 20 symptomatic tillers along the middle four rows of each plot -3, 7, 14 and 21 days after treatment (DAT). Tiller samples were placed in Berlese funnels for 24 hours to extract aphids into alcohol for counting. Symptomatic tiller samples taken -3 DAT averaged 16.8 Russian wheat aphids per tiller.
Aphid counts were transformed by the log + 1 method to correct for nonadditivity, and transformed counts were used for analysis of variance and mean separation by Tukey’s HSD test (á=0.05). Original means are presented in Table 1. Total aphid days per tiller for each treatment were calculated
according the method of Ruppel (Journal of Economic Entomology 76: 375-7, 1983), transformed by the log + 1 method, and analyzed in the same manner, with original means presented in Table 1.
Reductions in insect days were calculated by Abbott's (1925) formula: (percent reduction = ((untreated-treated)/untreated) X 100).
Aphid abundance was much lower than in 2013, with approximately 239 and 1870 aphid days per tiller in 2014 and 2013, respectively (Table 3). Crop condition was excellent. All treatments had fewer aphid days per tiller than the untreated control. No treatment reduced total aphid days over three weeks by 90% or more, the level of performance observed by the more effective treatments in past experiments. No phytotoxicity was observed with any treatment.
Field History
Pest: Russian wheat aphid, Diuraphis noxia (Kurdjumov)
Cultivar: 'Voyager'
Planting Date: 20 March 2014
Irrigation: Post planting, linear move sprinkler with drop nozzles Crop History: Field corn in 2013
Herbicide: Huskie, 13 fl oz, on 21 April 2014
Insecticide: None prior to experiment
Fertilization: None
Soil Type: Sandy clay loam
Location: ARDEC, 4616 North Frontage Road, Fort Collins, CO 80524 (Block 1080 South) N40.65394, W104.99720
Table 3. Control of biotype RWA2 Russian wheat aphid in spring barley with hand-applied insecticides, ARDEC, Fort Collins, CO, 2014. APHIDS PER TILLER ± SE2
APHID DAYS/TILLER3 ± SE2
% REDUCTION IN APHID DAYS
PRODUCT, FL OZ/ACRE 7 DAT 14 DAT 21 DAT
Endigo ZC, 4 oz/acre1 0.2 ± 0.1 D 0.4 ± 0.1 CD 0.7 ± 0.3 C 83.0 ± 1.8 C 65 Cobalt Advanced, 11 fl oz 0.1 ± 0.0 D 0.2 ± 0.1 D 1.5 ± 0.5 BC 83.9 ± 2.3 C 65 Besiege, 9 oz/acre 1 0.4 ± 0.2 CD 0.4 ± 0.1 CD 0.8 ± 0.5 C 84.7 ± 3.4 C 65 Warrior II 2.09 CS, 1.92 oz/acre1 0.6 ± 0.1 BCD 1.7 ± 0.8 BCD 1.3 ± 0.4 BC 97.0 ± 6.9 BC 60 Sulfoxaflor 0.75 oz1 1.1 ± 0.2 BC 1.8 ± 0.4 BCD 3.7 ± 0.6 B 111.2 ± 4.4 B 54 Sulfoxaflor 1.5 oz1 1.6 ± 0.4 B 2.4 ± 0.8 BC 2.5 ± 0.4 BC 113.9 ± 8.3 B 53 Baythroid XL, 2.4 oz/acre1 1.7 ± 0.4 B 3.0 ± 0.8 AB 1.9 ± 0.6 BC 117.1 ± 7.7 B 51 Untreated control 6.4 ± 1.1 A 8.3 ± 2.2 A 14.7 ± 2.2 A 239.9 ± 22.2 A — F value 27.38 10.59 18.92 34.82 — p>F 0.0000 0.0000 0.0000 0.0000 — 1
plus crop oil concentrate 1% v/v
2
SE, standard error of the mean. Means in the same column followed by the same letters(s) are not statistically different, Tukey’s HSD (%=0.05).
3Total aphid days per tiller calculated by the Ruppel method.
CONTROL OF WHEAT STEM SAWFLY IN WINTER WHEAT, NEW RAYMER, CO, 2014
Terri Randolph, Jeff Rudolph, Frank Peairs, Darren Cockrell, Claire Tovrea, Christene Ward, Mathew Miller, Michael Mayfield, Department of Bioagricultural Sciences and Pest Management, Cole and Jim Mertens, Mertens Farms.
CONTROL OF WHEAT STEM SAWFLY IN WINTER WHEAT, NEW RAYMER, CO, 2014: Treatments at
wheat stem sawfly pupation were applied on 16 May 2014. Foliar liquids were applied using an ATV sprayer with a 15 foot boom with nine 8002 nozzles calibrated to apply 15.5 gpa at 5 mph and 32 psi. Plots were 15 ft by 30 ft and arranged in six replicates of a randomized complete block design.
Conditions at the time of this treatment were 58EF with 9 mph wind from the north. Thimet 20G was applied by shaking granules from a bottle into a 3 ft shallow trench that had been dug between two rows. The granules were applied through a small aperture drilled through the bottle cap. Plots treated with Thimet 20G were two rows by 3.3 ft. A precipitation event of 0.7" occurred with 24 h of the early foliar and Thimet 20G treatments. Foliar treatments two weeks after wheat stem sawfly pupation were applied in the same manner on 30 May 2014. Conditions at the time of this treatment were 57EF with 14 mph wind from the north. Wheat stem sawfly adults were abundant at the time of this treatment, averaging ca. 5 adults per 180Esweep with a standard insect net.
At the time of the first foliar treatment, infested stubble also was treated to determine if adult emergence could be reduced. Stubble was treated with Cobalt Advanced, 25 oz, + COC 1% v/v in the manner described above. A 2 ft x 3 ft emergence cage was placed in the center of each plot to collect adults. Emergence was not affected; adults collected on 28 May and 17 June 2014 averaged 21.3 and 23.7 per trap in the treated and untreated plots, respectively (F=0.11; df=1,5; p>F=0.7532).
Treatments were evaluated for infested stems on 20 June 2014 by collecting all tillers in a 0.5 row meter in each plot. These were placed in coolers and returned to the laboratory for subsequent
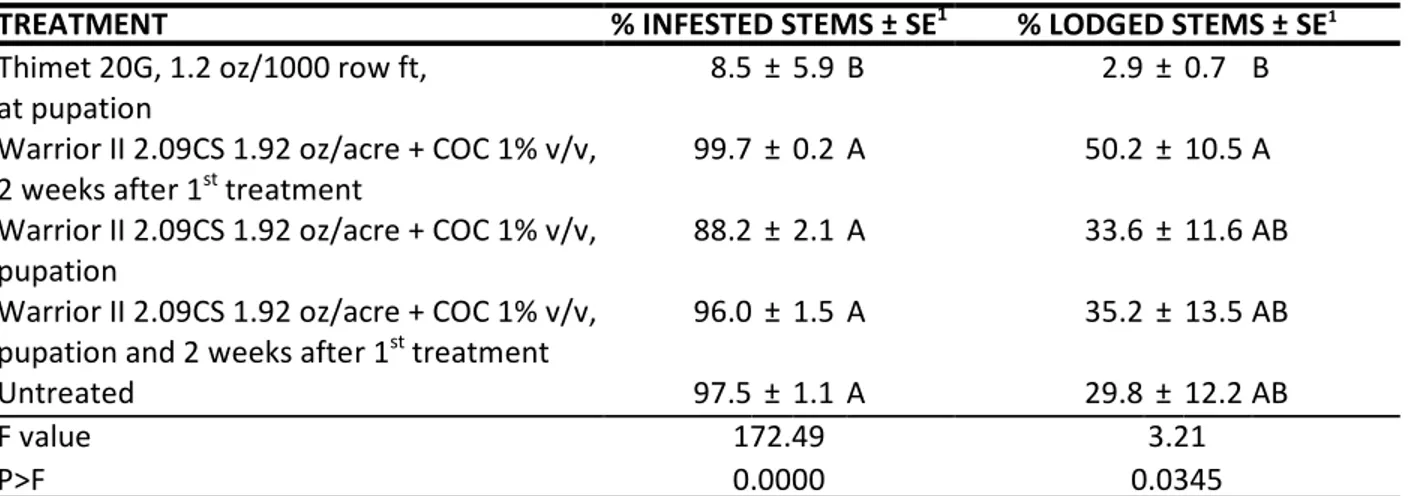
evaluation. Tillers were counted and then dissected to determine the presence or absence of living and dead wheat stem sawfly larvae. On 8 July 2014 all stems in 1 row-meter per plot were counted, as were the number of lodged stems. Percentage infested stems and percentage lodged stems were analyzed by ANOVA and subsequent mean separation by Tukey’s HSD test (%=0.05). Means are presented in Table 4.
No foliar treatment was different than the untreated control in terms of percentage infested stems or lodging. The percentage infested stems was lower in the Thimet 20G treatment. Also, there was less lodging in the Thimet 20G treatment than in the late Warrior II foliar treatment. Lodging data were taken on 8 July, however, lodging eventually reached 100% in the foliar treatments and untreated control prior to harvest, while lodging in the Thimet 20G plots did not change noticeably.
Field History
Pest: Wheat stem sawfly, Cephus cinctus Norton
Cultivar: ‘Byrd’
Planting Date: 10 September 2013
Plant Population: Not available
Irrigation: Dryland
Crop History: Fallow in 2013
Insecticide: None prior to experiment
Soil Type: Clay loam
Location: ½ mile S of Co Hwy 14 and 1 mile east of WCR 123 (foliar trial
N40.57998, W103.89841; stubble trial N40.59254, W103.87868)
Table 4. Control of wheat stem sawfly larval infestation and stem damage with foliar and soil-applied
insecticides, New Raymer, CO, 2014.
TREATMENT % INFESTED STEMS ± SE1 % LODGED STEMS ± SE1
Thimet 20G, 1.2 oz/1000 row ft, at pupation
8.5 ± 5.9 B 2.9 ± 0.7 B
Warrior II 2.09CS 1.92 oz/acre + COC 1% v/v, 2 weeks after 1st treatment
99.7 ± 0.2 A 50.2 ± 10.5 A
Warrior II 2.09CS 1.92 oz/acre + COC 1% v/v, pupation
88.2 ± 2.1 A 33.6 ± 11.6 AB
Warrior II 2.09CS 1.92 oz/acre + COC 1% v/v, pupation and 2 weeks after 1st treatment
96.0 ± 1.5 A 35.2 ± 13.5 AB
Untreated 97.5 ± 1.1 A 29.8 ± 12.2 AB
F value 172.49 3.21
P>F 0.0000 0.0345
1
SE, standard error of the mean. Means in the same column followed by the same letters(s) are not statistically different, Tukey’s HSD (%=0.05).
CONTROL OF ALFALFA INSECTS IN ALFALFA WITH HAND-APPLIED INSECTICIDES, ARDEC, FORT COLLINS, CO, 2014
Jeff Rudolph, Terri Randolph, Frank Peairs, Darren Cockrell, Christene Ward, Claire Tovrea, Matt Miller, and Michael Mayfield, Department of Bioagricultural Sciences and Pest Management
CONTROL OF ALFALFA INSECTS IN ALFALFA WITH HAND-APPLIED INSECTICIDES, ARDEC, FORT COLLINS, CO, 2014: Early treatments were applied on 21 April 2014 with a ‘rickshaw-type’ CO2
powered sprayer calibrated to apply 20 gal/acre at 3 mph and 30 psi through six 8002 nozzles mounted on a 10.0 ft boom. Early treatments were made approximately when army cutworm treatments are applied in the region. This was done to determine the effect of army cutworm treatment in alfalfa on subsequent alfalfa weevil larval densities. All other treatments were applied in the same manner on 23 May 2014. Conditions for the early treatments were 69EF with 4 mph wind from the south and clear skies, and 68EF with 0 - 3mph wind from the south and clear skies during the later treatments. No precipitation was recorded during the 24 h period following either treatment date. Plots were 10.0 ft by 25.0 ft and arranged in six replicates of a randomized, complete block design. The untreated control and Warrior II, 1.92 oz./acre, plots were replicated 12 times for a more accurate comparison of
treatment effects on yield (insect counts from six reps of each treatment were included in the analyses described below). The crop was 6 inches in height at the time of early treatments and 12 inches at the time of the later treatments.
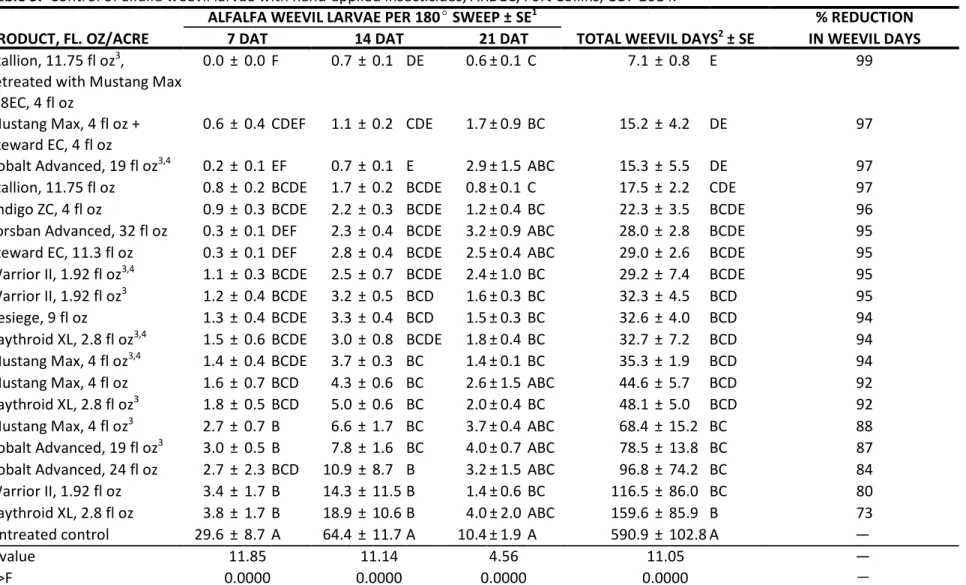
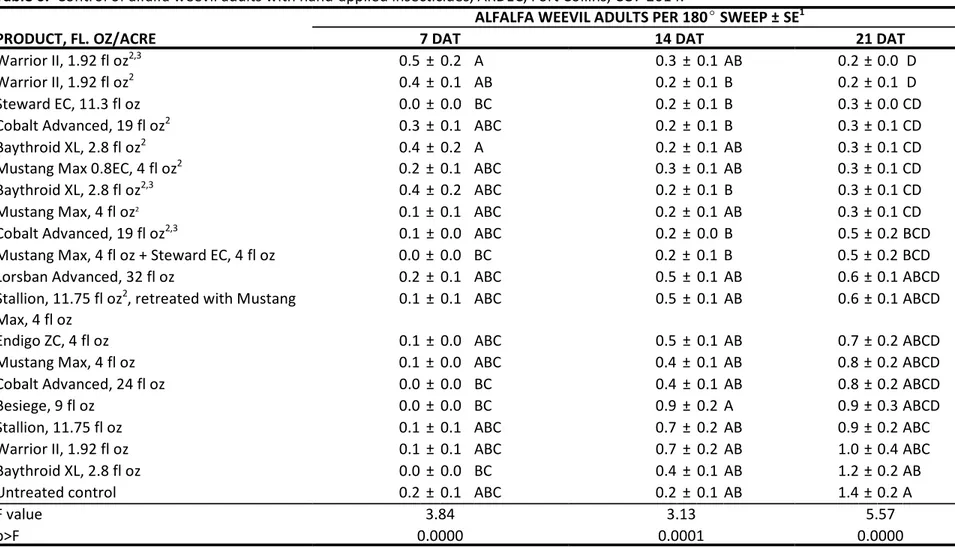
Treatments were evaluated by taking ten 180N sweeps per plot with a standard 15 inch diameter insect net 7, 14, and 21 days after the later treatments (DAT). Alfalfa weevil larvae, alfalfa weevil adults and pea aphids were counted. A pretreatment sample was taken on 20 May 2014 by taking 100, 180N sweeps around the experimental area. This sample averaged 3.1 and 6.4 alfalfa weevil larvae and pea aphids per sweep, respectively. Alfalfa weevil adult counts were transformed by the square root + 0.5 method, and alfalfa weevil larval and pea aphid counts were transformed by the log +1 to correct for nonadditivity. Transformed counts were subjected to analysis of variance and mean separation by Tukey’s HSD procedure (á=0.05). Original means are presented in Tables 5-7. Total alfalfa weevil larval days and pea aphid days for each treatment were calculated according to the method of Ruppel
(Journal of Economic Entomology 76: 375-7, 1983), transformed by the log +1 method, and analyzed in the same manner, with original means presented in the tables. Yields were measured on 16 July 2014 by hand harvesting a 0.5 m2 area per plot. Samples were weighed wet and dry and converted to lbs of dry hay per acre prior to comparing yields of treated plots to those of untreated plots using analysis of variance.
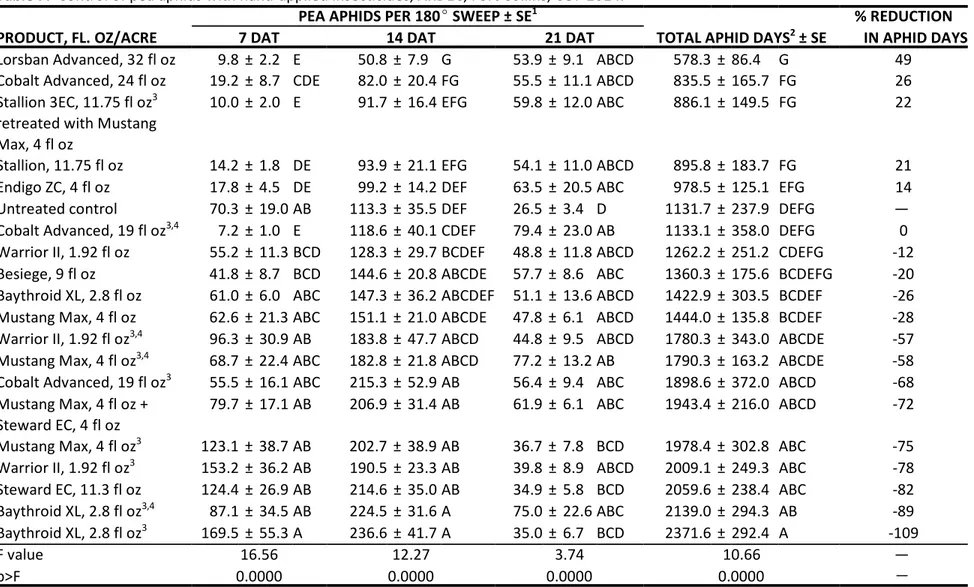
In 2014, pea aphid densities were lower and alfalfa weevil larval densities were greater than those observed in 2013. Total alfalfa weevil days averaged ca. 591 and 223 in 2014 and 2013, respectively. Pea aphid days averaged 2372 and 15,385 in 2014 and 2013, respectively. All treatments had fewer total alfalfa weevil days than the untreated control (Table 5). Adult alfalfa weevil were not abundant, however, statistical differences from the untreated control were noted at 21 DAT (Table 6). With the exception of the Steward EC, 11.3 fl oz, the only treatments with fewer adults than the untreated control were most of the early pyrethroid treatments. No treatment had fewer pea aphid days than the untreated control (Table 7). No phytotoxicity was observed with any treatment. Yield were reduced 7.2%, (F=6.49; df=9,19; p>F=0.0313). Yield reductions since 1995 have averaged 6.9%, with a range of 0.0% to 23.9%.
Field History
Pests: Alfalfa weevil, Hypera postica (Gyllenhal)
Pea aphid, Acyrthosiphon pisum (Harris)
Cultivar: Dekalb DKA41-18RR
Plant Stand: Good
Irrigation: Furrow
Crop History: Alfalfa since August 2011
Herbicide: Roundup PowerMax, 22 fl oz, + Helfire, 6.4 fl oz, on 30 June 2014
Insecticide: None prior to experiment
Fertilization: 150 lbs of 22-52-0-12S on 25 February 2014
Soil Type: Sandy clay loam
Location: ARDEC, 4616 North Frontage Road, Fort Collins, CO, 80524 (SW corner of Bee
Circle) (N40.66864, W104.99976)
Table 5. Control of alfalfa weevil larvae with hand-applied insecticides, ARDEC, Fort Collins, CO. 2014.
ALFALFA WEEVIL LARVAE PER 180E SWEEP ± SE1 % REDUCTION PRODUCT, FL. OZ/ACRE 7 DAT 14 DAT 21 DAT TOTAL WEEVIL DAYS2 ± SE IN WEEVIL DAYS
Stallion, 11.75 fl oz3,
retreated with Mustang Max 0.8EC, 4 fl oz
0.0 ± 0.0 F 0.7 ± 0.1 DE 0.6 ± 0.1 C 7.1 ± 0.8 E 99
Mustang Max, 4 fl oz + Steward EC, 4 fl oz
0.6 ± 0.4 CDEF 1.1 ± 0.2 CDE 1.7 ± 0.9 BC 15.2 ± 4.2 DE 97
Cobalt Advanced, 19 fl oz3,4 0.2 ± 0.1 EF 0.7 ± 0.1 E 2.9 ± 1.5 ABC 15.3 ± 5.5 DE 97
Stallion, 11.75 fl oz 0.8 ± 0.2 BCDE 1.7 ± 0.2 BCDE 0.8 ± 0.1 C 17.5 ± 2.2 CDE 97
Endigo ZC, 4 fl oz 0.9 ± 0.3 BCDE 2.2 ± 0.3 BCDE 1.2 ± 0.4 BC 22.3 ± 3.5 BCDE 96
Lorsban Advanced, 32 fl oz 0.3 ± 0.1 DEF 2.3 ± 0.4 BCDE 3.2 ± 0.9 ABC 28.0 ± 2.8 BCDE 95
Steward EC, 11.3 fl oz 0.3 ± 0.1 DEF 2.8 ± 0.4 BCDE 2.5 ± 0.4 ABC 29.0 ± 2.6 BCDE 95
Warrior II, 1.92 fl oz3,4 1.1 ± 0.3 BCDE 2.5 ± 0.7 BCDE 2.4 ± 1.0 BC 29.2 ± 7.4 BCDE 95
Warrior II, 1.92 fl oz3 1.2 ± 0.4 BCDE 3.2 ± 0.5 BCD 1.6 ± 0.3 BC 32.3 ± 4.5 BCD 95
Besiege, 9 fl oz 1.3 ± 0.4 BCDE 3.3 ± 0.4 BCD 1.5 ± 0.3 BC 32.6 ± 4.0 BCD 94
Baythroid XL, 2.8 fl oz3,4 1.5 ± 0.6 BCDE 3.0 ± 0.8 BCDE 1.8 ± 0.4 BC 32.7 ± 7.2 BCD 94
Mustang Max, 4 fl oz3,4 1.4 ± 0.4 BCDE 3.7 ± 0.3 BC 1.4 ± 0.1 BC 35.3 ± 1.9 BCD 94
Mustang Max, 4 fl oz 1.6 ± 0.7 BCD 4.3 ± 0.6 BC 2.6 ± 1.5 ABC 44.6 ± 5.7 BCD 92
Baythroid XL, 2.8 fl oz3 1.8 ± 0.5 BCD 5.0 ± 0.6 BC 2.0 ± 0.4 BC 48.1 ± 5.0 BCD 92
Mustang Max, 4 fl oz3 2.7 ± 0.7 B 6.6 ± 1.7 BC 3.7 ± 0.4 ABC 68.4 ± 15.2 BC 88
Cobalt Advanced, 19 fl oz3 3.0 ± 0.5 B 7.8 ± 1.6 BC 4.0 ± 0.7 ABC 78.5 ± 13.8 BC 87
Cobalt Advanced, 24 fl oz 2.7 ± 2.3 BCD 10.9 ± 8.7 B 3.2 ± 1.5 ABC 96.8 ± 74.2 BC 84
Warrior II, 1.92 fl oz 3.4 ± 1.7 B 14.3 ± 11.5 B 1.4 ± 0.6 BC 116.5 ± 86.0 BC 80 Baythroid XL, 2.8 fl oz 3.8 ± 1.7 B 18.9 ± 10.6 B 4.0 ± 2.0 ABC 159.6 ± 85.9 B 73 Untreated control 29.6 ± 8.7 A 64.4 ± 11.7 A 10.4 ± 1.9 A 590.9 ± 102.8 A — F value 11.85 11.14 4.56 11.05 — p>F 0.0000 0.0000 0.0000 0.0000 — 1
SE, standard error of the mean. Means in the same column followed by the same letter(s) are not statistically different, Tukey’s HSD (%=0.05).
2
Calculated by the Ruppel method.
Table 6. Control of alfalfa weevil adults with hand-applied insecticides, ARDEC, Fort Collins, CO. 2014.
ALFALFA WEEVIL ADULTS PER 180E SWEEP ± SE1
PRODUCT, FL. OZ/ACRE 7 DAT 14 DAT 21 DAT
Warrior II, 1.92 fl oz2,3 0.5 ± 0.2 A 0.3 ± 0.1 AB 0.2 ± 0.0 D
Warrior II, 1.92 fl oz2 0.4 ± 0.1 AB 0.2 ± 0.1 B 0.2 ± 0.1 D
Steward EC, 11.3 fl oz 0.0 ± 0.0 BC 0.2 ± 0.1 B 0.3 ± 0.0 CD
Cobalt Advanced, 19 fl oz2 0.3 ± 0.1 ABC 0.2 ± 0.1 B 0.3 ± 0.1 CD
Baythroid XL, 2.8 fl oz2 0.4 ± 0.2 A 0.2 ± 0.1 AB 0.3 ± 0.1 CD
Mustang Max 0.8EC, 4 fl oz2 0.2 ± 0.1 ABC 0.3 ± 0.1 AB 0.3 ± 0.1 CD
Baythroid XL, 2.8 fl oz2,3 0.4 ± 0.2 ABC 0.2 ± 0.1 B 0.3 ± 0.1 CD
Mustang Max, 4 fl oz2 0.1 ± 0.1 ABC 0.2 ± 0.1 AB 0.3 ± 0.1 CD
Cobalt Advanced, 19 fl oz2,3 0.1 ± 0.0 ABC 0.2 ± 0.0 B 0.5 ± 0.2 BCD
Mustang Max, 4 fl oz + Steward EC, 4 fl oz 0.0 ± 0.0 BC 0.2 ± 0.1 B 0.5 ± 0.2 BCD
Lorsban Advanced, 32 fl oz 0.2 ± 0.1 ABC 0.5 ± 0.1 AB 0.6 ± 0.1 ABCD
Stallion, 11.75 fl oz2, retreated with Mustang
Max, 4 fl oz
0.1 ± 0.1 ABC 0.5 ± 0.1 AB 0.6 ± 0.1 ABCD
Endigo ZC, 4 fl oz 0.1 ± 0.0 ABC 0.5 ± 0.1 AB 0.7 ± 0.2 ABCD
Mustang Max, 4 fl oz 0.1 ± 0.0 ABC 0.4 ± 0.1 AB 0.8 ± 0.2 ABCD
Cobalt Advanced, 24 fl oz 0.0 ± 0.0 BC 0.4 ± 0.1 AB 0.8 ± 0.2 ABCD
Besiege, 9 fl oz 0.0 ± 0.0 BC 0.9 ± 0.2 A 0.9 ± 0.3 ABCD
Stallion, 11.75 fl oz 0.1 ± 0.1 ABC 0.7 ± 0.2 AB 0.9 ± 0.2 ABC
Warrior II, 1.92 fl oz 0.1 ± 0.1 ABC 0.7 ± 0.2 AB 1.0 ± 0.4 ABC
Baythroid XL, 2.8 fl oz 0.0 ± 0.0 BC 0.4 ± 0.1 AB 1.2 ± 0.2 AB
Untreated control 0.2 ± 0.1 ABC 0.2 ± 0.1 AB 1.4 ± 0.2 A
F value 3.84 3.13 5.57
p>F 0.0000 0.0001 0.0000
1
SE, standard error of the mean. Means in the same column followed by the same letter(s) are not statistically different, Tukey’s HSD (%=0.05).
2
Early treatment
3
Retreated at conventional timing.
Table 7. Control of pea aphids with hand-applied insecticides, ARDEC, Fort Collins, CO. 2014.
PEA APHIDS PER 180E SWEEP ± SE1 % REDUCTION PRODUCT, FL. OZ/ACRE 7 DAT 14 DAT 21 DAT TOTAL APHID DAYS2 ± SE IN APHID DAYS
Lorsban Advanced, 32 fl oz 9.8 ± 2.2 E 50.8 ± 7.9 G 53.9 ± 9.1 ABCD 578.3 ± 86.4 G 49
Cobalt Advanced, 24 fl oz 19.2 ± 8.7 CDE 82.0 ± 20.4 FG 55.5 ± 11.1 ABCD 835.5 ± 165.7 FG 26
Stallion 3EC, 11.75 fl oz3 retreated with Mustang Max, 4 fl oz
10.0 ± 2.0 E 91.7 ± 16.4 EFG 59.8 ± 12.0 ABC 886.1 ± 149.5 FG 22
Stallion, 11.75 fl oz 14.2 ± 1.8 DE 93.9 ± 21.1 EFG 54.1 ± 11.0 ABCD 895.8 ± 183.7 FG 21
Endigo ZC, 4 fl oz 17.8 ± 4.5 DE 99.2 ± 14.2 DEF 63.5 ± 20.5 ABC 978.5 ± 125.1 EFG 14
Untreated control 70.3 ± 19.0 AB 113.3 ± 35.5 DEF 26.5 ± 3.4 D 1131.7 ± 237.9 DEFG —
Cobalt Advanced, 19 fl oz3,4 7.2 ± 1.0 E 118.6 ± 40.1 CDEF 79.4 ± 23.0 AB 1133.1 ± 358.0 DEFG 0
Warrior II, 1.92 fl oz 55.2 ± 11.3 BCD 128.3 ± 29.7 BCDEF 48.8 ± 11.8 ABCD 1262.2 ± 251.2 CDEFG -12
Besiege, 9 fl oz 41.8 ± 8.7 BCD 144.6 ± 20.8 ABCDE 57.7 ± 8.6 ABC 1360.3 ± 175.6 BCDEFG -20
Baythroid XL, 2.8 fl oz 61.0 ± 6.0 ABC 147.3 ± 36.2 ABCDEF 51.1 ± 13.6 ABCD 1422.9 ± 303.5 BCDEF -26
Mustang Max, 4 fl oz 62.6 ± 21.3 ABC 151.1 ± 21.0 ABCDE 47.8 ± 6.1 ABCD 1444.0 ± 135.8 BCDEF -28
Warrior II, 1.92 fl oz3,4 96.3 ± 30.9 AB 183.8 ± 47.7 ABCD 44.8 ± 9.5 ABCD 1780.3 ± 343.0 ABCDE -57
Mustang Max, 4 fl oz3,4 68.7 ± 22.4 ABC 182.8 ± 21.8 ABCD 77.2 ± 13.2 AB 1790.3 ± 163.2 ABCDE -58
Cobalt Advanced, 19 fl oz3 55.5 ± 16.1 ABC 215.3 ± 52.9 AB 56.4 ± 9.4 ABC 1898.6 ± 372.0 ABCD -68
Mustang Max, 4 fl oz + Steward EC, 4 fl oz
79.7 ± 17.1 AB 206.9 ± 31.4 AB 61.9 ± 6.1 ABC 1943.4 ± 216.0 ABCD -72
Mustang Max, 4 fl oz3 123.1 ± 38.7 AB 202.7 ± 38.9 AB 36.7 ± 7.8 BCD 1978.4 ± 302.8 ABC -75
Warrior II, 1.92 fl oz3 153.2 ± 36.2 AB 190.5 ± 23.3 AB 39.8 ± 8.9 ABCD 2009.1 ± 249.3 ABC -78
Steward EC, 11.3 fl oz 124.4 ± 26.9 AB 214.6 ± 35.0 AB 34.9 ± 5.8 BCD 2059.6 ± 238.4 ABC -82
Baythroid XL, 2.8 fl oz3,4 87.1 ± 34.5 AB 224.5 ± 31.6 A 75.0 ± 22.6 ABC 2139.0 ± 294.3 AB -89
Baythroid XL, 2.8 fl oz3 169.5 ± 55.3 A 236.6 ± 41.7 A 35.0 ± 6.7 BCD 2371.6 ± 292.4 A -109
F value 16.56 12.27 3.74 10.66 —
p>F 0.0000 0.0000 0.0000 0.0000 —
1
SE, standard error of the mean. Means in the same column followed by the same letter(s) are not statistically different, Tukey’s HSD (%=0.05).
2
% reduction in total pea aphid days, calculated by the Ruppel method.
3
Early treatment. 4
CONTROL OF ALFALFA INSECTS WITH EARLY AND LATE WARRIOR II TREATMENTS, ARDEC, FORT COLLINS, CO, 2014
Jeff Rudolph, Terri Randolph, Frank Peairs, Darren Cockrell, Claire Tovrea, Christene Ward, Matt Miller, and Michael Mayfield, Department of Bioagricultural Sciences and Pest Management
CONTROL OF ALFALFA INSECTS WITH EARLY AND LATE WARRIOR II TREATMENTS, ARDEC, FORT COLLINS, CO, 2014: Early treatments were applied on 11 April 2014 with an ATV-mounted sprayer
calibrated to apply 15.5 gpa at 5 mph and 32 psi through nine 8002 nozzles on a 15 foot boom. Early treatments were made approximately when army cutworm treatments are applied in the region. This was done to determine the effect of army cutworm treatment in alfalfa on subsequent alfalfa weevil larval densities and whether the interval between treatment and honey bee foraging and potential insecticide exposure could be increased without compromising the level of alfalfa weevil control. The late treatment was applied in the same manner on 22 May 2014. Conditions for the early treatment were clear skies, 65EF and 5 mph winds from the south. Conditions for the late treatment were hazy skies, 68EF and 8 mph winds from the south. No precipitation was recorded during the 24 h period following either treatment date. Plots were 30 ft by the length of the field (ca. 1100 ft) and arranged in six replicates of a randomized, complete block design. The crop was 3 inches in height at the time of early treatments and 12 inches at the time of the later treatments.
The early treatment was evaluated by taking three sets of two samples (0.1 m2per sample) per plot with a Vortis suction sampler -14 and 11 days after treatment (DAT). The late treatment was evaluated by taking three sets of 10 180N sweeps per plot with a standard 15 inch diameter insect net -3 and 17 DAT. Alfalfa weevil larvae, alfalfa weevil adults and pea aphids from each sample were combined and
counted. Counts were subjected to analysis of variance and mean separation by Tukey’s HSD procedure (á=0.05). Means are presented in Tables 8-10.
Adult alfalfa weevil were found at all sample dates, however, its abundance was not affected by
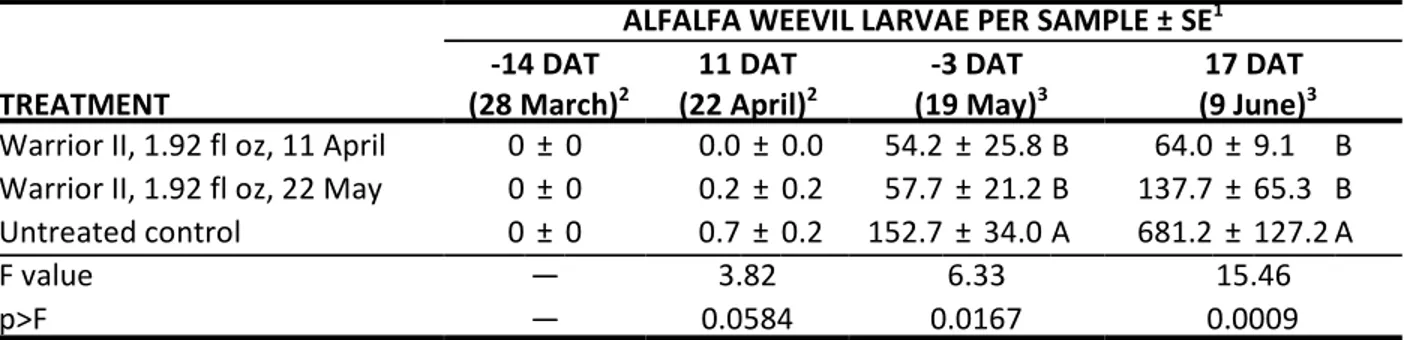
treatment (Table 8). Adults also were sampled through the winter in a nearby alfalfa field. Abundance, again, was low, however adults were detected on 8 October 2013 and 21 February 2014, but not on 31 December 2013. Larval abundance was very low after the early treatment. There were more alfalfa weevil larvae in the untreated control before and after the late treatment (Table 9). It is unclear as to why larval abundance was greater in the untreated control prior to the late treatment. Pea aphid densities were very low after the early treatment. More pea aphids were found in the early treatment than in the late treatment (Table 10). Early and late treatments were equally effective in controlling alfalfa weevil larvae, which is consistent with results from nearby small plot experiments over the past several years.
Field History
Pests: Alfalfa weevil, Hypera postica (Gyllenhal)
Pea aphid, Acyrthosiphon pisum (Harris)
Cultivar: Dekalb DKA41-18RR
Plant Stand: Good
Irrigation: Furrow
Crop History: Alfalfa since June 2013
Herbicide: Roundup PowerMax, 22 fl oz, + Helfire, 6.4 fl oz, on 30 June 2014
Insecticide: None prior to experiment
Fertilization: 150 lbs of 22-52-0-12S on 25 February 2014
Soil Type: Sandy clay loam
Location: ARDEC, 4616 North Frontage Road, Fort Collins, CO, 80524 (Kerbel field SW)
(N40.67800, W104.99945)
Table 8. Control of alfalfa weevil adults with early and late Warrior II treatments, ARDEC, Fort Collins, CO. 2014.
ALFALFA WEEVIL ADULTS PER SAMPLE ± SE1 TREATMENT -14 DAT (28 March)2 11 DAT (22 April)2 -3 DAT (19 May)3 17 DAT (9 June)3
Warrior II, 1.92 fl oz, 11 April 0.8 ± 0.4 1.0 ± 0.5 6.2 ± 1.2 5.0 ± 1.5
Warrior II, 1.92 fl oz, 22 May 0.3 ± 0.2 0.7 ± 0.4 8.5 ± 2.4 6.5 ± 1.3
Untreated control 0.7 ± 0.3 1.8 ± 0.7 11.3 ± 2.5 6.2 ± 1.4
F value 0.66 1.76 1.64 0.27
p>F 0.5378 0.2219 0.2414 0.7707
1
SE, standard error of the mean.
2
DAT, days after early treatment. Sampled with Vortis suction sampler.
3
DAT, days after late treatment. Sampled with standard insect sweep net.
Table 9. Control of alfalfa weevil larvae with early and late Warrior II treatments, ARDEC, Fort Collins,
CO. 2014.
ALFALFA WEEVIL LARVAE PER SAMPLE ± SE1 TREATMENT -14 DAT (28 March)2 11 DAT (22 April)2 -3 DAT (19 May)3 17 DAT (9 June)3
Warrior II, 1.92 fl oz, 11 April 0 ± 0 0.0 ± 0.0 54.2 ± 25.8 B 64.0 ± 9.1 B
Warrior II, 1.92 fl oz, 22 May 0 ± 0 0.2 ± 0.2 57.7 ± 21.2 B 137.7 ± 65.3 B
Untreated control 0 ± 0 0.7 ± 0.2 152.7 ± 34.0 A 681.2 ± 127.2 A
F value — 3.82 6.33 15.46
p>F — 0.0584 0.0167 0.0009
1
SE, standard error of the mean. Means in the same column followed by the same letter(s) are not statistically different, Tukey’s HSD (%=0.05).
2
DAT, days after early treatment. Sampled with Vortis suction sampler.
3
DAT, days after late treatment. Sampled with standard insect sweep net.
Table 10. Control of pea aphids with early and late Warrior II treatments, ARDEC, Fort Collins, CO.
2014.
PEA APHIDS PER SAMPLE ± SE1 TREATMENT -14 DAT (28 March)2 11 DAT (22 April)2 -3 DAT (19 May)3 17 DAT (9 June)3
Warrior II, 1.92 fl oz, 11 April 0 ± 0 0.8 ± 0.3 246.8 ± 47.1 3218.7 ± 467.8 A
Warrior II, 1.92 fl oz, 22 May 0 ± 0 2.3 ± 0.6 254.3 ± 54.9 1526.7 ± 353.4 B
Untreated control 0 ± 0 4.2 ± 1.1 362.0 ± 38.8 2292.3 ± 240.9 AB
F value — 3.99 2.09 5.24
p>F — 0.0532 0.1747 0.0278
1
SE, standard error of the mean. Means in the same column followed by the same letter(s) are not statistically different, Tukey’s HSD (%=0.05).
2
3DAT, days after late treatment. Sampled with standard insect sweep net.
CONTROL OF WESTERN CORN ROOTWORM IN FIELD CORN WITH PLANTING-TIME SOIL INSECTICIDES, SEED TREATMENTS, AND PLANT-INCORPORATED PROTECTANTS, ARDEC, FORT COLLINS, CO, 2014
Jeff Rudolph, Terri Randolph, Frank Peairs, Darren Cockrell, Claire Tovrea, Michael Mayfield, Matt Miller and Christene Ward, Department of Bioagricultural Sciences and Pest Management.
CONTROL OF WESTERN CORN ROOTWORM IN FIELD CORN WITH PLANTING-TIME SOIL INSECTICIDES, SEED TREATMENTS, AND PLANT-INCORPORATED PROTECTANTS, ARDEC, FORT COLLINS, CO, 2014: All
treatments were planted on 21 May 2014. Granular insecticides were applied with modified Wintersteiger meters mounted on a two-row John Deere Maxi-Merge planter. T-band granular
applications were applied with a 4-inch John Deere spreader located between the disk openers and the press wheel. Liquid applications were applied with a CO2 powered-sprayer calibrated to apply 0.5 gpa
through a microtube directed into the furrow. Conditions at the time of application were good soil moisture and a soil temperature of 55EF. Plots were one 25-ft row arranged in six replicates of a randomized complete block design. Untreated control seed was rinsed with tap water to remove the Cruiser 0.25. On 6 June 2014, (growth stage V2-3), each plant to be rated was infested with ca. 560 western corn rootworm eggs obtained from Dr. Bruce Hibbard, USDA-ARS, Plant Genetics Research Unit, Columbia, MO and Dr. Lee French, French Ag Research, Lamberton, MN. Eggs were suspended in 0.15% agar and placed in a hole approximately three inches deep next to each plant.
Treatments were evaluated by digging three plants per plot on 15 July 2014. The roots were washed and the damage rated on the 0-3 node injury scale
(http://www.ent.iastate.edu/pest/rootworm/nodeinjury/nodeinjury.html). Plot means were used for analysis of variance and mean separation by Tukey’s HSD method (á=0.05). Treatment efficiency was determined as the percentage of total plants per treatment (18) having a root rating of 0.25 or lower. Due to the use of artificial infestation in both years, western corn rootworm pressure was similar, 1.09 and 1.07 on the Iowa 0-3 scale in 2014 and 2013, respectively. The average rating of adjacent
uninfested control plants was 0.11. All treatments, except AMV1118 2.78 CS 0.36 oz IF, Capture LFR, 0.49 oz IF, and Avicta Complete, were less damaged than the untreated control (Table 11). No phytotoxicity was observed with any treatment.
Field History
Pest: Western corn rootworm, Diabrotica virgifera virgifera LeConte
Cultivar: Northrup King N45GT, unless otherwise indicated
Planting Date: 21 May 2014
Plant Population: 29,000
Irrigation: Linear move sprinkler
Crop History: Corn in 2013
Insecticide: None prior to experiment
Soil Type: Clay loam
Location: ARDEC, 4616 North Frontage Road, Fort Collins, CO 80524 (Block 1030
Table 11. Commercial and experimental treatments for control of western corn rootworm, ARDEC,
Fort Collins, CO. 2014.
TREATMENT AND/OR EVENT IOWA 0-3 ROOT RATING1 EFFICIENCY2
SmartStax 0.00 C 100 Capture LFR, 0.49 oz IF + SmartStax 0.00 C 100 Capture LFR, 0.98 oz IF + SmartStax 0.00 C 100 Force CS, 0.46 oz IF + SmartStax 0.00 C 100 Herculex XTRA 0.00 C 100 Agrisure RW 0.00 C 100 SMARTCHOICE 5G, 5 oz IF 0.00 C 100 Counter 15G, 8 oz IF 0.01 C 100 AMV1091 2.77 ME 0.406 oz IF 0.02 C 94 Force 3G, 5 oz IF 0.02 C 100 Agrisure Duracade 0.02 C 100 Aztec 2.1G, 6.7 oz IF 0.04 C 100 AMV1091 2.49 CS, 0.45 oz IF 0.05 C 94 AMV1091 2.49 CS, 0.227 oz IF 0.06 BC 94 Force CS, 0.46 oz IF 0.08 BC 83 AMV1118 2.78 CS 0.72 oz IF 0.10 BC 78 AMV1091 2.49 CS, 0.68 oz IF 0.13 BC 78 AMV1091 2.49 EC, 0.45 oz IF 0.17 BC 72 Capture LFR, 0.98 oz IF 0.29 BC 56 Lorsban 15G, 8 oz IF 0.37 BC 50 AMV1118 2.78 CS 0.36 oz IF 0.51 ABC 56 Capture LFR, 0.49 oz IF 0.53 ABC 61 Avicta Complete 0.69 AB 44 Untreated 1.09 A 6 F value 5.32 p>F <0.0001 1
Means in the same column followed by the same letters(s) are not statistically different, Tukey’s HSD (%=0.05).
2
% total plants (18) per treatment having a root rating of 0.25 or lower.
CONTROL OF SPIDER MITES IN CORN WITH HAND-APPLIED INSECTICIDES AND MITICIDES, ARDEC, FORT COLLINS, CO, 2014
Terri Randolph, Jeff Rudolph, Darren Cockrell, Claire Tovrea, Christene Ward, Mathew Miller, Michael Mayfield and Frank Peairs, Department of Bioagricultural Sciences and Pest Management
CONTROL OF SPIDER MITES IN CORN WITH HAND-APPLIED INSECTICIDES AND MITICIDES, ARDEC, FORT COLLINS, CO, 2014: Early treatments were applied on 1 August 2014 using a two row boom
sprayer mounted on a backpack calibrated to deliver 17.8 gal/acre at 32 psi with five 8002VS nozzles. All other treatments were applied in the same manner on 14 August 2014. Conditions were partly cloudy, 60 to 70E F with calm winds at the time of early treatments. Conditions were partly cloudy, calm and 70 to 76E F at the time of late treatments. Early treatments were applied at tassel emergence and late treatments were applied at brown silk. All treatments, except the untreated control, were applied with Dyne-Amic 0.25% v/v. Plots were 25 ft by two rows (30 inch centers) and were arranged in six replicates of a randomized complete block design. Because of the number of treatments, two experiments, containing several treatments in common, were planted. Plots were separated from neighboring plots by a single buffer row. Plots were infested on 9 July 2014 by laying mite infested corn leaves, collected earlier that day in Mesa County, CO, across the corn plants on which mites were to be counted. On 11 July 2014, the experimental area was treated with permethrin 3.2E, 10 fl oz, to control beneficial insects and promote spider mite abundance.
Treatments were evaluated by collecting three leaves (ear leaf, second leaf above the ear, second leaf below the ear) from two plants per plot -1 or 0 days prior to and 7, 14, and 21 days after the later treatments (DAT). Corn leaves were placed in Berlese funnels for 48 hours to extract mites into alcohol for counting. Grain yields in both trials were estimated for the Brigade 6.4 fl oz + dimethoate, 0.5 lb ai (late), dimethoate 0.5 lb AI (late), Oberon 4SC, 5 fl oz (early), Onager, 12 fl oz (early), and untreated control treatments by harvesting the ears from 0.001 acre per plot, drying and shelling the ears, weighing the dried grain, and converting yields to bu/acre at 15.5% moisture. Mite counts were transformed by the log + 1 method to address nonadditivity issues. Total mite days were calculated by the method of Ruppel (J. Econ. Entomol. 76: 375-377). Transformed counts and total mite days were subjected to analysis of variance and mean separation by Tukey's HSD method (á=0.05), with original means presented in Tables 1 and 2. Reductions in mite days were calculated by Abbott's (1925) formula: (percent reduction = ((untreated-treated)/untreated) X 100) using the average accumulated mite days of the untreated control. Grain yields were compared with ANOVA.
Mite abundance in 2014 was much less than that observed in 2013, with total mite days in the untreated control in the two experiments averaging 361 and 5077 in 2014 and 2013, respectively. In Trial 1, the Onager, 12 fl oz + GWN 1708, 20 fl oz (early), Onager, 12 fl oz (early), and Brigade 6.4 fl oz + dimethoate, 0.5 lb ai (late) treatments had fewer mite days than the untreated control (Table 12). In Trial 2, Onager, 12 fl oz (early), Onager, 24 fl oz (early), Onager, 12 fl oz + dimethoate 0.5 lb ai (early), Oberon, 5 oz + dimethoate 0.5 lb ai (early), Brigade 6.4 fl oz + dimethoate, 0.5 lb ai (late), and Brigade 2EC, 6.4 fl oz (late) had fewer mite days than the untreated control (Table 13). Yields measured for five treatments, including the untreated control, averaged 130 bu/acre and there were no treatment differences observed (F=1.30; df= 5,20; p>F=0.3038). No phytotoxicity was observed.
Field History:
Pest: Banks grass mite, Oligonychus pratensis (Banks)
Cultivar: Northrup King N29T 3000 GT
Planting Date: 29 April 2014 Plant Population: 34,000
Irrigation: Center pivot sprinkler programed to deliver 60% of ET after stand establishment.
Crop History: Corn in 2013
Herbicide: Roundup PowerMax, 1qt + Dual Magnum, 1.5 pt, Sterling Blue (dicamba) 5.0 oz + Induce 3.2 + Hellfire, 6.4 on 4 June, 2014
Fertilization: 150 lbs N, 40 lbs P, 12 lbs Zn on 8 April 2014 and 120 N on 3 June 2014
Soil Type: Clay loam
Location: ARDEC, 4616 North Frontage Road, Fort Collins, CO 80524, Field 3100 Trial 1 (N40.66685, W104.99778) and Trial 2 (N40.66674, W104.99837)
Table 12. Control of spider mites in field corn with hand-applied miticides (Trial 1), ARDEC, Fort Collins, CO, 2014. MITES PER LEAF ± SE1
TREATMENT, PRODUCT/ACRE -1 DAT 7 DAT 14 DAT 21 DAT TOTAL MITE DAYS ± SE1,2 %3
Onager, 12 fl oz + GWN 1708, 20 fl oz* 1.3 ± 0.2 1.6 ± 0.5 BCD 2.5 ± 1.0 DE 2.1 ± 0.6 D 39.6 ± 4.4 F 83
Onager, 12 fl oz* 2.4 ± 1.3 0.7 ± 0.3 D 1.6 ± 0.3 E 4.4 ± 2.4 D 40.4 ± 10.8 F 83
Brigade 6.4 fl oz + dimethoate, 0.5 lb ai** 4.5 ± 2.4 0.9 ± 0.3 CD 2.4 ± 0.6 DE 3.2 ± 1.5 D 51.0 ± 13.1 EF 79
Onager, 16 fl oz* 2.3 ± 0.9 1.6 ± 0.3 BCD 4.3 ± 1.5 BCDE 5.6 ± 1.1 BCD 67.4 ± 13.5 DEF 72
Agri-Flex, 7.5 fl oz** 2.5 ± 0.7 4.6 ± 2.0 ABCD 5.7 ± 2.5 BCDE 3.8 ± 1.6 D 92.2 ± 25.1 CDEF 61
Agri-Mek SC, 3.0 fl oz** 5.3 ± 3.3 5.3 ± 2.5 ABCD 4.1 ± 0.7 BCDE 4.0 ± 1.4 D 99.5 ± 24.9 BCDEF 58
Dimethoate 0.5 lb AI** 3.4 ± 1.7 6.7 ± 3.6 ABCD 5.8 ± 3.5 ABCDE 4.5 ± 1.6 CD 114.3 ± 44.6 BCDEF 52
Onager, 16 fl oz** 0.9 ± 0.3 8.5 ± 3.4 AB 6.2 ± 1.3 ABCDE 5.9 ± 2.4 BCD 124.1 ± 37.3 ABCDEF 49
Agrimek 0.70 SC, 2.5 fl oz** 4.8 ± 2.4 6.7 ± 1.5 ABCD 5.6 ± 1.7 BCDE 11.9 ± 4.8 ABCD 144.3 ± 32.6 ABCDEF 40
Oberon 4SC, 6 fl oz* 2.9 ± 1.4 6.2 ± 1.8 ABCD 8.3 ± 2.6 ABCDE 13.4 ± 5.4 ABCD 155.4 ± 40.2 ABCDEF 35
Zeal, 2 oz* 4.3 ± 2.8 6.1 ± 2.1 ABCD 9.4 ± 5.1 ABCDE 11.6 ± 3.7 ABCD 161.2 ± 58.5 ABCDEF 33
Brigade 2EC, 6.4 fl oz** 15.3 ± 9.6 2.8 ± 1.2 BCD 9.8 ± 2.9 ABCDE 7.3 ± 3.5 BCD 170.1 ± 51.5 ABCDEF 29
Onager, 12 fl oz** 2.6 ± 1.1 10.4 ± 5.0 AB 7.4 ± 2.6 ABCDE 14.6 ± 4.5 ABCD 181.9 ± 60.5 ABCDE 24
Untreated 1.5 ± 0.4 8.3 ± 2.2 AB 15.9 ± 6.0 ABCD 20.4 ± 4.3 ABC 238.9 ± 52.8 ABCD —
Onager, 12 fl oz + GWN 1708, 20 fl oz** 3.6 ± 1.5 11.6 ± 4.0 AB 18.5 ± 4.9 ABC 14.4 ± 3.0 ABCD 266.1 ± 48.7 ABC -11
Oberon 4SC, 5 fl oz* 3.1 ± 1.5 9.7 ± 2.5 AB 10.1 ± 1.3 ABCDE 36.0 ± 9.0 A 271.5 ± 42.4 ABC -14
Experimental A1* 3.2 ± 1.1 9.3 ± 2.6 AB 20.2 ± 3.9 ABC 25.0 ± 7.0 ABC 296.7 ± 62.6 ABC -24
Experimental A2* 3.2 ± 1.5 11.0 ± 2.8 AB 19.5 ± 4.5 ABC 25.3 ± 8.3 ABC 304.9 ± 34.6 AB -28
Experimental A3* 3.0 ± 0.7 19.3 ± 4.1 A 21.4 ± 5.4 ABC 38.7 ± 9.3 A 421.7 ± 79.0 A -76
Experimental A4* 3.4 ± 1.6 14.5 ± 2.3 A 31.5 ± 11.9 A 35.3 ± 9.0 A 443.3 ± 120.9 A -85
F value 0.88 5.56 5.72 7.56 7.85 —
p>F 0.6020 0.0000 0.0000 0.0000 0.0000 —
*early treatment; **late treatment.
1
SE, standard error of the mean, DAT, days after the late treatment. Means in the same column followed by the same letter(s) are not statistically different, Tukey’s HSD (%=0.05).
2
Total mite days, calculated by the Ruppel method.
3
Table 13. Control of spider mites in field corn with hand-applied miticides (Trial 2), ARDEC, Fort Collins, CO, 2013. MITES PER LEAF ± SE1
TREATMENT, PRODUCT/ACRE 0 DAT 7 DAT 14 DAT 21 DAT TOTAL MITE DAYS ± SE1,2 %3
Onager, 12 fl oz* 1.4 ± 0.4 2.7 ± 1.0 A 2.7 ± 0.4 F 9.1 ± 3.6 BCDE 73.5 ± 18.1 F 85
Onager, 24 fl oz* 2.1 ± 0.8 2.8 ± 1.9 A 2.4 ± 0.5 F 10.1 ± 3.1 BCDE 78.6 ± 20.3 F 84
Onager, 12 fl oz + dimethoate 0.5 lb ai* 3.9 ± 3.2 2.1 ± 0.5 A 4.6 ± 1.9 CDEF 8.2 ± 1.8 BCDE 88.4 ± 21.1 EF 82
Oberon, 5 oz + dimethoate 0.5 lb ai* 1.4 ± 0.5 5.4 ± 2.5 A 3.6 ± 0.4 DEF 9.9 ± 2.4 BCDE 101.4 ± 25.5 DEF 83
Brigade, 6.4 fl oz + dimethoate, 0.5 lb ai** 5.8 ± 1.6 3.4 ± 1.5 A 5.2 ± 2.9 CDEF 8.1 ± 3.6 E 108.8 ± 33.3 DEF 77
Brigade 2EC, 6.4 fl oz** 3.0 ± 1.3 5.8 ± 1.7 A 6.2 ± 4.2 CDEF 10.8 ± 6.6 BCDE 131.0 ± 62.7 DEF 73
Agrimek 0.70 SC, 3.0 fl oz** 8.4 ± 4.4 6.9 ± 2.3 A 4.5 ± 1.1 CDEF 13.0 ± 4.1 ABCDE 157.0 ± 37.0 BCDEF 67
Oberon 4SC, 8.5 fl oz* 2.3 ± 0.7 4.8 ± 2.0 A 8.3 ± 1.7 BCDEF 17.8 ± 5.2 ABCDE 158.9 ± 25.0 BCDEF 67
Dimethoate 0.5 lb AI** 2.7 ± 0.4 4.4 ± 1.3 A 5.5 ± 1.7 CDEF 27.0 ± 8.2 ABCDE 171.7 ± 40.7 BCDEF 64
Oberon 4SC, 6 fl oz* 2.3 ± 1.4 10.4 ± 3.5 A 9.7 ± 1.3 ABCDEF 26.3 ± 3.1 ABCDE 237.2 ± 27.1 ABCDE 51
Oberon 4SC, 5 fl oz* 3.3 ± 2.4 9.0 ± 2.1 A 10.3 ± 4.6 ABCDEF 33.7 ± 6.3 ABC 260.7 ± 37.8 ABCDE 46
NA-89 EC, 4.3 fl oz * 3.4 ± 1.3 9.3 ± 4.3 A 14.2 ± 3.9 ABCDEF 33.1 ± 3.8 ABC 286.7 ± 48.3 ABCD 41
Zeal, 2 oz* 2.6 ± 0.9 11.4 ± 3.5 A 18.3 ± 2.3 ABCD 29.3 ± 8.3 ABCDE 311.9 ± 33.0 ABC 35
Portal XLO, 32 fl oz* 5.3 ± 4.0 7.8 ± 1.6 A 27.1 ± 8.8 ABC 34.3 ± 4.2 ABC 371.8 ± 59.0 ABC 23
NA-89 EC, 5.3 fl oz * 5.3 ± 1.4 9.1 ± 2.9 A 26.4 ± 4.6 ABC 39.9 ± 7.9 ABC 396.6 ± 59.4 ABC 18
Zeal, 4 fl oz* 4.8 ± 0.9 9.3 ± 3.4 A 30.1 ± 12.0 ABC 36.9 ± 7.9 ABC 409.0 ± 63.5 ABC 15
Portal XLO, 32 fl oz** 6.0 ± 2.2 14.8 ± 7.6 A 21.6 ± 8.3 ABCD 40.6 ± 13.9 ABC 409.5 ± 119.5 ABC 15
Untreated 9.6 ± 3.9 9.9 ± 3.6 A 31.2 ± 10.9 AB 49.3 ± 16.4 AB 482.8 ± 117.8 ABC —
NA-89 SC, 3.9 fl oz * 7.4 ± 3.7 6.2 ± 1.9 A 36.7 ± 9.4 AB 59.8 ± 17.0 A 521.0 ± 98.3 AB -8
NA-89 EC, 3.6 fl oz * 4.1 ± 1.0 16.0 ± 6.5 A 46.4 ± 12.7 A 40.0 ± 16.6 ABC 569.6 ± 115.3 A -18
F value 1.66 2.25 8.44 5.16 9.42 —
p>F 0.0586 0.0055 0.0000 0.0000 0.0000 —
*early treatment; **late treatment.
1SE, standard error of the mean, DAT, days after the late treatment. Means in the same column followed by the same letter(s) are not statistically different, Tukey’s HSD (%=0.05). 2
Total mite days, calculated by the Ruppel method.
3
Percentage reduction in total mite days.
CONTROL OF WESTERN BEAN CUTWORM IN FIELD CORN HYBRIDS WITH COMMERCIAL Bt EVENTS, ARDEC, FORT COLLINS, CO, 2014
Frank Peairs, Terri Randolph, Christene Ward and Jeff Rudolph, Department of Bioagricultural Sciences and Pest Management
CONTROL OF WESTERN BEAN CUTWORM IN FIELD CORN HYBRIDS WITH COMMERCIAL Bt EVENTS, ARDEC, FORT COLLINS, CO, 2014: The experiment was planted on 21 May 2014. Plants were infested
during the green silk stage by using a Davis insect inoculator (Davis, F. M. and T. G. Oswalt. 1979. Hand inoculator for dispensing lepidopterous insects. Agricultural Research [Southern Region], Science and Education Administration, USDA, New Orleans, LA. Southern Series 9) to place neonate western bean cutworm larvae mixed with corn cob grits on the silks. Larvae were hatched from field-collected egg masses purchased from Appel Crop Consulting, Grant, NE. Plants were infested on 1 August with ca. 25 larvae per primary ear, respectively. Approximately one week later, infested ears were covered with tassel bags to exclude birds and rootworm adults. Plots consisted of three 20-ft rows, and 10 plants in the middle of each treatment row were infested. The experiment was replicated eight times.
Treatments were evaluated on 3 September 2014 by opening the husks of the primary ear of each of the infested plants and counting damaged ears, western bean cutworm larvae and naturally occurring corn earworm larvae. The damaged area per damaged ear then was determined by estimating the cm2 of ear fed upon, using a transparent grid held over the affected area. Western bean cutworm counts and area damaged by western bean cutworm were subjected to analysis of variance and mean separation by Tukey's HSD method (%=0.05), with results presented in Table 1.
Infestation levels were very low. The SmartStax trait reduced the number of damaged ears and the area damaged per ear (Table 14).
Field History
Pest: Western bean cutworm, Striacosta albicosta (Smith)
Cultivar: Experimentals
Planting Date: 21 May 2014
Plant Population: 29,000
Irrigation: Linear move sprinkler
Crop History: Field corn
Insecticide: None prior to experiment
Soil Type: Clay loam
Location: ARDEC, 4616 North Frontage Road, Fort Collins, CO 80524 (Block 1030
east), N 40.65394, W 104.99720
Table 14. Western bean cutworm (WBC) on corn with Bt events, ARDEC, Fort Collins, CO. 2014. TRAIT CM2 WBC FEEDING DAMAGE1 WBC/EAR1 DAMAGED EARS1
SmartStax 1.7 B 0.3 A 0.9 B
No trait 14.6 A 0.9 A 6.4 A
F value 25.29 1.84 77.00
p>F 0.0292 0.2168 0.0001
1
2014 PEST SURVEY RESULTS Table 15. 2014 pheromone trap catches at ARDEC, Fort Collins, CO.
ARDEC – 1030*
Species Total Caught2 Trapping Period
Army cutworm 198 (283) 8/15 - 11/7
Banded sunflower moth – (8) –
Beet armyworm 11 (7) 5/29 - 9/12
European corn borer (IA)1 45 (10) 5/23 - 10/31
Fall armyworm 344 (277) 4/8 - 11/7
Pale western cutworm 270 (101) 8/15 - 11/7
Sunflower moth – (18) –
Western bean cutworm 32 (4) 5/23 - 10/31
Wheat head armyworm 170 (18) 4/8 - 9/12
Wheat stem sawfly 0 (0) 5/29 - 6/26
*
(N40.654201, W104.997667)
1
IA, Iowa strain
2–, not trapped. Number in () is 2013 total catch for comparison *
WHEAT STEM SAWFLY SURVEY 2014
Claire Tovrea, Christene Ward, Matt Miller and Terri Randolph, , Department of Bioagricultural Sciences and Pest Management.
WHEAT STEM SAWFLY SURVEY 2014: The wheat stem sawfly, Cephus cinctus Norton, is a major pest of
wheat and other cereals, but also utilizes a wide range of grass hosts. Its distribution includes the northern Great Plains region, reaching from North Dakota and Montana to southeastern Wyoming and Colorado and the Nebraska panhandle.
Wheat stem sawfly adults emerge in late May to early June, generally around the time winter wheat is in late stem elongation or early boot. Females insert eggs inside the stems of wheat, usually near a node. Larvae hatch within 5-7 days and feed downward through the stem for approximately one month. When the plants begin to mature, the larvae move to the base of the plant, cut a small v-shaped notch around the stem and fill the end of the stem with frass. The larvae overwinter within a thin cocoon that they construct to prevent them from dessication. In early spring, larvae pupate and emerge as adults when conditions are favorable. Wheat stem sawfly has one generation per year.
In 2010, the wheat stem sawfly was found in winter wheat in northeastern Colorado. In 2011,
damaging populations were found in winter wheat planted near New Raymer, CO, where losses of 40% were incurred due to lodging from the sawfly. A one-day survey, conducted in 2011 in northeastern Colorado at anthesis revealed that 57% of the fields surveyed were infested with wheat stem sawfly. A more formal survey was initiated in 2012.
Approximately 100 samples are collected annually, with the samples per county based on the number of acres each county had in wheat production in 2010. The 2013 and 2014 samples were collected near the 2012 survey sites for comparison purposes. Each site is a minimum of 10 miles from its closest neighbor to allow appropriate mapping and to improve the distribution of samples with counties. Each site consisted of a wheat field that shared a field edge with a fallow wheat field.
Site data was collected from each field visited. GPS coordinates were recorded at each location using a Garmin model GPSmap76S. A hand drawn map was then made for ease of returning to sites. Data on previous crop, presence of adjacent alternative host grasses, tillage type, stubble/residue percent cover, irrigation, county and wheat growth stage were recorded in Microsoft Excel on a tablet computer. Wheat stem sawfly presence and abundance were determined by sampling adults and larvae. Adults were collected in 100 180Esweeps with a standard insect sweep net within the wheat crop, along the field edge closest to the adjacent fallow field, during the sawfly flight. Contents of the net were then emptied into ziplock plastic baggies and transported in coolers. The samples were then stored in the freezer for later sawfly counts and future genetic analyses. After anthesis, each site was revisited to collect tillers for determining percentage of larval infestation. Whole plants were dug up along the wheat/fallow border and were placed into ziplock baggies and transported to the lab in coolers. The plants were kept in a refrigerator and later dissected to determine percentage larval infestation. Maps of wheat stem sawfly infested and non-infested sites were constructed using ESRI Arcmap 10.0. Different colored circles indicate the level of infestation and white circles indicates no sawfly present. In
2012, a total of 32.6 % of the sites sampled were infested with wheat stem sawfly. Sites with the highest infestation levels were located in Weld and Morgan counties. Mild to moderate infestation levels were found as south as Cheyenne county. In 2013, 38.6% of the sites sampled were infested with wheat stem sawfly, with some heavier infestations found further south than in 2012. In 2014, 50% of the sites sampled were infested and sawfly was found as far south as Baca county. The results from this survey indicate that infestation frequency and intensity is increasing throughout eastern Colorado. This survey will be repeated in 2015 to track the wheat stem sawfly spread and severity.
INSECTICIDE PERFORMANCE SUMMARIES
Insecticide performance in a single experiment can be quite misleading. To aid in the interpretation of the tests included in this report, long term performance summaries are presented below for insecticides that are registered for use in Colorado and that have been tested at least three times. These
summaries are complete through 2014.
Table 16. Performance of planting-time insecticides against western corn rootworm, 1987-2014, in
northern Colorado.
INSECTICIDE 0 -3 ROOT RATING1
AGRISURE RW 0.14 (7)
AZTEC 2.1G 0.06 (35)
COUNTER 15G 0.06 (38)
CRUISER, 1.25 mg (AI)/seed 0.06 (10)
FORCE 1.5G (8 OZ) or 3G (4 OZ) 0.06 (32)
FORCE 3G (5 OZ) 0.07 (12) FORCE CS, 0.46 oz 0.09 (3) FORTRESS 5G 0.08 (14) HERCULEX RW or xTRA 0.13 (6) LORSBAN 15G 0.12 (31) PONCHO 600, 1.25 mg (AI)/seed 0.04 (8) SMARTSTAX 0.04 (3) THIMET 20G 0.50 (15) UNTREATED CONTROL 1.10 (40) 1
Rated on the node damage scale of 0-3, where 0 is least damaged, and 3 is 3 root nodes completely damaged. Ratings taken prior to 2006 were based on the Iowa 1-6 scale and approximated to the 0-3 scale. Number in parenthesis is number of times the product was tested in average. Planting time treatments averaged over application methods.
Table 17. Performance of cultivation insecticide treatments against western corn rootworm,
1987-2005, in northern Colorado.
INSECTICIDE IOWA 1-6 ROOT RATING1
COUNTER 15G 2.8 (21)
FORCE 3G 3.3 (8)
LORSBAN 15G 3.1 (17)
THIMET 20G 2.9 (19)
UNTREATED CONTROL 4.2 (24)
1Rated on a scale of 1-6, where 1 is least damaged, and 6 is most heavily damaged. Number in () is number of times tested for average.
Table 18. Insecticide performance against first generation European corn borer, 1982-2002, in
northeast Colorado.
MATERIAL LB/ACRE METHOD1 % CONTROL2
DIPEL ES 1 QT + OIL I 91 (4)
LORSBAN 15G 1.00 (AI) A 77 (5)
LORSBAN 15G 1.00 (AI) C 80 (6)
LORSBAN 4E 1.0 (AI) I 87 (9)
POUNCE 3.2E 0.15 (AI) I 88 (11)
POUNCE 1.5G 0.15 (AI) C 87 (4) POUNCE 1.5G 0.15 (AI) A 73 (7) THIMET 20G 1.00 (AI) C 77 (4) THIMET 20G 1.00 (AI) A 73 (3) WARRIOR 1E 0.03 (AI I 85 (4) 1
A = Aerial, C = Cultivator, I = Center Pivot Injection. CSU does not recommend the use of aerially-applied liquids for control of first generation European corn borer.
2
Numbers in () indicate that percent control is the average of that many trials.
Table 19. Insecticide performance against western bean cutworm, 1982-2002, in northeast Colorado. MATERIAL LB (AI)/ACRE METHOD1 % CONTROL2
CAPTURE 2E 0.08 A 98 (5) CAPTURE 2E 0.08 I 98 (5) LORSBAN 4E 0.75 A 88 (4) LORSBAN 4E 0.75 I 94 (4) POUNCE 3.2E 0.05 A 97 (7) POUNCE 3.2E 0.05 I 99 (5) WARRIOR 1E (T) 0.02 I 96 (2) 1
A = Aerial, I = Center Pivot Injection
2
Numbers in () indicated that percent control is average of that many trials.
Table 20. Insecticide performance against second generation European corn borer, 1982-2002, in
northeast Colorado.
MATERIAL LB (AI)/ACRE METHOD1 % CONTROL2
DIPEL ES 1 QT PRODUCT I 56 (16) CAPTURE 2E 0.08 A 85 (8) CAPTURE 2E 0.08 I 86 (14) LORSBAN 4E 1.00 + OIL I 72 (14) POUNCE 3.2E 0.15 I 74 (11) WARRIOR 1E 0.03 A 81 (4) WARRIOR 1E 0.03 I 78 (4) 1
A = Aerial, I = Center Pivot Injection
2
Numbers in () indicate how many trials are averaged.
Table 21. Performance of hand-applied insecticides against alfalfa weevil larvae, 1984-2014, in
northern Colorado.
PRODUCT LB (AI)/ACRE % CONTROL AT 2 WK1
BAYTHROID XL 0.022 93 (20)
BAYTHROID XL 0.022 (early)3 93 (11)
COBALT OR COBALT ADVANCED 19 fl oz 90 (7)
LORSBAN 4E 0.75 93 (23)
LORSBAN 4E 1.00 90 (11)
LORSBAN 4E 0.50 83 (10)
MUSTANG MAX 0.025 92 (10)
MUSTANG MAX 0.025 (early)3 89 (12)
PERMETHRIN 2 0.10 67 (7) PERMETHRIN 2 0.20 80 (4) STALLION 11.75 FL OZ 96 (4) STEWARD EC 0.065 80 (7) STEWARD EC 0.110 85 (10) WARRIOR 1E or T or II 0.02 92 (18) WARRIOR II 0.03 (early)3 92 (6) WARRIOR 1E or T or II 0.03 91 (13) 1
Number in () indicates number of years included in average.
2
Includes both Ambush 2E and Pounce 3.2E.
3
Table 22. Control of Russian wheat aphid with hand-applied insecticides in winter wheat, 1986-20141. TESTS WITH > 90% LORSBAN 4E 0.50 29 51 57 COBALT ADVANCED 13 FL OZ 3 6 50 BAYTHROID XL 0.019 0 8 0 DIMETHOATE 4E 0.375 9 43 21 ENDIGO 2.71 ZCX 4.0 FL OZ 2 5 40 MUSTANG MAX 0.025 2 12 17 LORSBAN 4E 0.25 10 27 37 LORSBAN 4E 0.38 5 6 83 WARRIOR 1E 0.03 4 20 20 1
Includes data from several states.
Table 23. Control of spider mites in artificially-infested corn, ARDEC, 1993-2013.
PRODUCT LB (AI)/ACRE % REDUCTION IN TOTAL MITE DAYS1
CAPTURE 2E 0.08 47 (20) CAPTURE 2E + DIMETHOATE 4E 0.08 + 0.50 66 (22) COMITE II 1.64 17 (17) COMITE II 2.53 37 (9) COMITE II + DIMETHOATE 4E 1.64 + 0.50 55 (13) DIMETHOATE 4E 0.50 44 (20) OBERON 4SC 0.135 50 (8) OBERON 4SC 0.156 57 (6) OBERON 4SC 0.188 55 (5) ONAGER 0.078 69 (9) ONAGER 0.094 71 (5) 1
Number in () indicates number of tests represented in average. 2009 data not included.
Table 24. Control of sunflower stem weevil, USDA Central Great Plains Research Station, 1998-2002. PRODUCT LB (AI)/ACRE TIMING % CONTROL1
BAYTHROID 2E 0.02 CULTIVATION 57 (3)
BAYTHROID 2E 0.03 CULTIVATION 52 (3)
WARRIOR 1E 0.02 CULTIVATION 63 (3)
WARRIOR 1E 0.03 CULTIVATION 61 (3)
1
Number in () indicates number of tests represented in average.
ACKNOWLEDGMENTS
2014 COOPERATORS
PROJECT LOCATION COOPERATORS
Alfalfa insecticides ARDEC, Fort Collins Chris Fryrear, Mark Collins
Barley insecticides ARDEC, Fort Collins Chris Fryrear, Mark Collins
Corn rootworm control ARDEC, Fort Collins Chris Fryrear, Mark Collins, Bruce
Hibbard Western bean cutworm
control
ARDEC, Fort Collins Chris Fryrear, Mark Collins, Larry
Appel
Corn spider mite control ARDEC, Fort Collins Chris Fryrear, Mark Collins, Bob
Hammon Russian wheat aphid
control
ARDEC, Fort Collins Chris Fryrear, Mark Collins
Wheat stem sawfly control New Raymer Jim and Cole Mertens
Brown wheat mite control ARDEC Chris Fryrear, Mark Collins
Pheromone traps ARDEC, Fort Collins Chris Fryrear, Mark Collins
Suction trap ARDEC, Fort Collins Chris Fryrear, Mark Collins
Suction trap Akron (Central Great Plains
Research Station)
Dave Poss, Merle Vigil
Suction trap Lamar Jeremy Stulp
Suction trap Walsh (Plainsman Research
Center)
A17511
Manufacturer: Syngenta EPA Registration Number: NA
Active ingredient(s) (common name): experimental.. . . 6 A20307
Manufacturer: Syngenta EPA Registration Number: NA
Active ingredient(s) (common name): experimental.. . . 6 A20452
Manufacturer: Syngenta EPA Registration Number: NA
Active ingredient(s) (common name): experimental.. . . 6 A20673
Manufacturer: Syngenta EPA Registration Number: NA
Active ingredient(s) (common name): experimental.. . . 5, 6 A9765
Manufacturer: Syngenta EPA Registration Number: NA
Active ingredient(s) (common name): experimental.. . . 6 Agri-Mek SC
Manufacturer: Syngenta
EPA Registration Number: 100-1351
Active ingredient(s) (common name): abamectin. . . 22, 23 Agrisure Duracade
Manufacturer: Syngenta Genetic insertion events: 5907
Active ingredient(s) (common name): eCry3.1Ab. . . 19 Agrisure RW
Manufacturer: Syngenta
Genetic insertion events: MIR604
Active ingredient(s) (common name): mCry3A.. . . 19, 30 Agri-Flex
Manufacturer: Syngenta
EPA Registration Number: 100-1350
Active ingredient(s) (common name): abamectin + thiamethoxam. . . 22
Ambush 2E
Manufacturer: AMVAC
EPA Registration Number: 5481-549
Active ingredient(s) (common name): cypermethrin. . . 32 Aztec 2.1G
Manufacturer: AMVAC
EPA Registration Number: 5481-9030
Active ingredient(s) (common name): 2% tebupirimphos, 0.1% cyfluthrin. . . 19, 30 Baythroid 2E
Manufacturer: AMVAC
EPA Registration Number: 5481-9030
Active ingredient(s) (common name): 2% tebupirimphos, 0.1% cyfluthrin. . . 33 Baythroid XL
Manufacturer: Bayer CropScience EPA Registration Number: 264-840
Active ingredient(s) (common name): cyfluthrin.. . . 2, 4, 8, 13-15, 32, 33 Besiege
Manufacturer: Syngenta
EPA Registration Number: 100-1402
Active ingredient(s) (common name): lambda-cyhalothrin + chlorantraniliprole. . . 8, 13-15 Brigade 2EC
Manufacturer: FMC
EPA Registration Number: 279-3313
Active ingredient(s) (common name): bifenthrin. . . 20, 22, 23 Capture 2E
Manufacturer: FMC
EPA Registration Number: 279-3069
Active ingredient(s) (common name): bifenthrin. . . 31-33 Capture LFR
Manufacturer: FMC
EPA Registration Number: 279-3302
Active ingredient(s) (common name): bifenthrin. . . 18, 19 Cobalt Advanced
Manufacturer: Dow Agrosciences EPA Registration Number: 62719-615
Comite II
Manufacturer: Chemtura
EPA Registration Number: 400-154
Active ingredient(s) (common name): propargite. . . 33 Counter 15G
Manufacturer: AMVAC
EPA Registration Number: 5481-545
Active ingredient(s) (common name): terbufos.. . . 19, 30 Cruiser 5FS
Manufacturer: Syngenta
EPA Registration Number: 100-941
Active ingredient(s) (common name): thiamethoxam. . . 18, 30 Dimethoate 4E
Manufacturer: generic
EPA Registration Number: various
Active ingredient(s) (common name): dimethoate. . . 33 Dimethoate 267
Manufacturer: generic
EPA Registration Number: various
Active ingredient(s) (common name): dimethoate. . . 4, 20, 22, 23 Dipel ES
Manufacturer: Valent
EPA Registration Number: 73049-17
Active ingredient(s) (common name): Bacillus thuringiensis. . . 31, 32 Endigo ZC
Manufacturer: Syngenta
EPA Registration Number: experimental
Active ingredient(s) (common name): lambda cyhalothrin + thiamethoxam. . . 4, 8, 13-15 Force 3G
Manufacturer: Syngenta
EPA Registration Number: 100-1075
Active ingredient(s) (common name): tefluthrin. . . 19, 30 Force CS
Manufacturer: Syngenta
EPA Registration Number: 100-1253
Active ingredient(s) (common name): tefluthrin. . . 19, 30
GWN-1708
Manufacturer: Gowan EPA Registration Number: NA
Active ingredient(s) (common name): experimental.. . . 20, 22 Herculex RW
Manufacturer: Dow Agrosciences Genetic insertion event DAS 59122-7
Active ingredient(s) (common name): Cry34/35Ab1.. . . 30 Herculex XTRA
Manufacturer: Dow Agrosciences
Genetic insertion event DAS 59122-7 and TC1507
Active ingredient(s) (common name): Cry34/35Ab1 + Cry 1F. . . 19 Lorsban 15G
Manufacturer: Dow Agrosciences EPA Registration Number: 62719-34
Active ingredient(s) (common name): chlorpyrifos.. . . 19, 30, 31 Lorsban 4E
Manufacturer: Dow Agrosciences EPA Registration Number: 62719-220
Active ingredient(s) (common name): chlorpyrifos.. . . 31-33 Lorsban Advanced
Manufacturer: Dow Agrosciences EPA Registration Number: 62719-591
Active ingredient(s) (common name): chlorpyrifos.. . . 4, 13-15 Mustang Max
Manufacturer: FMC
EPA Registration Number: 279-3249
Active ingredient(s) (common name): zeta cypermethrin. . . 13-15, 32, 33 NA-89 EC
Manufacturer: Gowan EPA Registration Number: NA
Active ingredient(s) (common name): experimental.. . . 23 NA-89 SC
Manufacturer: Gowan EPA Registration Number: NA