Mesa Montrose Delta Weld Sedgwick Washington Yuma Kit Carson Otero Denver
Western Slope Trials
Eastern Colorado Trials
2000 Colorado Corn Variety
Performance Trials
Fruita (G+S,I)
Delta (G,I)
Rocky Ford (G+S,I) Ovid (G,D) Julesburg (G,I) Greeley (G,I) Akron (G,D) Yuma (G,I) Burlington (G,I) Stratton (G,D) Fort Collins (S,I)
Olathe (S) Symbols Grain = G Silage = S Irrigated = I Dryland = D Morgan Wiggins(G,I) Larimer
KNOW YOUR CORN IMPROVEMENT TEAM
Jerry J. Johnson, Extension Specialist Crop Production, Soil and Crop Sciences (970) 491-1454 jjj@lamar.colostate.edu Frank C. Schweissing, Superintendent, Arkansas Valley Research Center (719) 254-6312 fschwei@ria.net
Calvin H. Pearson, Professor, Western Colorado Research Center (970) 858-3629 cpearson@coop.ext.colostate.edu James P. Hain, Research Associate, Soil and Crop Sciences (970) 345-2259
Cynthia L. Johnson, Research Associate, Soil and Crop Sciences (970) 491-1914 cjohnson@agsci.colostate.edu
ACKNOWLEDGMENTS
The authors express their gratitude to the Colorado farmers who generously contributed the use of their land, equipment, and time to conduct these trials for the good of all Colorado corn producers: Burlington - Don Sircy; SW Greeley - Brent Adler; Delta - Wayne Brew; Julesburg - Gene Bauerle; Julesburg - Josh Lechman; Olathe - David Seymour; Stratton - Tim Pautler; Wiggins - Larry Rothe; Yuma - Byron Weathers. We also acknowledge the participation of the Agricultural Research, Development and Education Center (ARDEC) - Fort Collins; Central Great Plains Field Station - Akron; Western Colorado Research Center - Fruita; Arkansas Valley Research Center - Rocky Ford.
Technical Report TR 00-10
Agricultural
Department of
Cooperative
December
Experiment
Soil and Crop
Extension
2000
Station
Sciences
TABLE OF CONTENTS
Introduction . . . 1
The 2000 Cropping Season . . . 1
Eastern Colorado Irrigated Grain Corn Performance Data . . . 2
Irrigated corn cultural conditions in 2000
Table 1 . . . 2
Burlington
Table 2-3 . . . 3
Greeley
Table 4-5 . . . 4
Julesburg
Table 6-7 . . . 5
Rocky Ford
Table 8-9 . . . 6
Wiggins
Table 10-11 . . . 7
Yuma
Table 12-13 . . . 8
Dryland Grain Corn Performance Data . . . 9
Dryland cultural conditions in 2000
Table 14 . . . 9
Akron
Table 15-16 . . . 10
Julesburg
Table 17-18 . . . 11
Western Slope Grain Corn Performance Data . . . 12
Western Slope irrigated corn cultural conditions in 2000
Table 19 . . . 12
Delta Short Season
Table 20-21 . . . 12
Fruita Short Season
Table 22-23 . . . 13
Fruita Long Season
Table 24-25 . . . 13
Corn Silage Performance Data for Eastern Colorado and the Western Slope . . . 13
2000 COLORADO CORN HYBRID PERFORMANCE TRIALS
Introduction
The importance of corn in Colorado has
fluctuated greatly during the last 120 years with the
earliest records dating back to 1879 when Colorado
farmers planted 23,000 acres and yields averaged 19.8
bu/acre. The highest corn acreage in the state was
2.58 million acres in 1934. Average grain yields did
not exceed 30 bu/acre until 1956 when 68% of the
corn acreage was irrigated. In 1997, the average
irrigated corn grain yield was over 160 bu/acre.
Colorado corn producers annually plant
approximately one million acres of hybrid corn, for
both grain and silage. Hybrid corn seed, valued above
$30 million, is purchased every year by Colorado corn
producers from hybrid seed corn companies. Variable
climatic conditions, innovations from biotechnology,
acquisitions and mergers of seed companies, and rapid
evolution of new hybrid lines means that unbiased
performance information is very important to Colorado
corn producers when choosing the best hybrid for their
farm.
To provide Colorado corn growers with
reliable and unbiased performance information,
Colorado State University personnel annually evaluate
commercial corn hybrids at multiple locations.
Participation by the seed companies in the state trials
is voluntary and companies are given the opportunity to
enter one or more hybrids at any location. Reference
to commercial companies or hybrids is made with the
understanding that no discrimination is intended and no
endorsement is implied by Colorado State University.
The 2000 Cropping Season
In 2000 corn grain hybrids were tested under
irrigation at six Eastern Colorado locations (Burlington,
SW Greeley, Julesburg, Rocky Ford, Yuma, and
Wiggins) and two Western Slope locations (Delta and
Fruita). Corn hybrids were also tested at three dryland
locations in Eastern Colorado (Akron, Julesburg, and
Stratton). The Stratton dryland trial was lost due to
prolonged drought. Irrigated silage corn hybrids were
tested at two Eastern Colorado locations (Rocky Ford
and Fort Collins) and two Western Slope locations
(Fruita and Olathe). Eastern Colorado trials were
of Soil and Crop Sciences, Crops Testing program, and
Western Slope trials were conducted by Calvin
Pearson of the Fruita Research Center, Colorado
Agricultural Experiment Station. A randomized
complete block field design with three replicates was
used at all Eastern Colorado irrigated trials and four
replicates were used in all dryland trials. Target plant
populations for the trials were 32,000 and 15,000 plants
per acre for irrigated and dryland trials, respectively.
Irrigated trials were planted at 15% above target
population and dryland trial target populations were
attained by hand thinning. Western Slope trials were
planted at a target population of 33,500 seeds per acre.
All grain yields are reported in bushels per
acre adjusted to 15.5% moisture content. Additional
variables reported are grain moisture at harvest, test
weight, plant height, lodging and/or stalk breakage,
plants per acre, and ear drop. Ears dropped per plot
were counted at the time of harvest, but fallen ears are
not included in the plot yields. A silk date is reported
for the Rocky Ford trial. Silage yields are reported in
tons per acre adjusted to 70% moisture content. The
moisture content of silage at harvest is reported as an
indicator of hybrid maturity. The least significant
difference (LSD) value (alpha=0.30) and the
Eastern Colorado Irrigated Grain Corn
Performance Data
Each year about 750,000 acres of irrigated
corn for grain is planted in Colorado, yielding 120-165
bu/acre, and producing upwards of 100 million bushels
of corn with a value over $150 million. Irrigated corn
producers spend over $20 million a year for seed.
CSU conducts hybrid performance trials to provide
unbiased and reliable information to Colorado
producers so they may select the best hybrids for their
farming conditions.
An important climatic factor determining
irrigated corn yield is growing degree days. Growing
degree days (GDD) calculations are accumulated from
May 1 to September 30 based on daily temperatures
as the average daily high and low temperature minus
50
oF. For calculating the mean daily temperature, a
minimum temperature below 50
oF is counted as 50
oF,
and a maximum above 86
oF is counted as 86
oF.
GDD’s in 2000 were above the long term average
GDD at all locations.
Trial Location Weather Station 2000 GDD Long Term Average GDD Burlington Burlington 2879 2673 Julesburg Julesburg 2949 2755SW Greeley Fort Collins 2479 2335
Rocky Ford Rocky Ford 2982 2837
Wiggins Fort Morgan 2730 2535
Yuma Yuma 2722 2615
Table 1. Irrigated corn cultural conditions in 2000.
Burlington Greeley Julesburg Rocky Ford Wiggins Yuma Soil Type Keith
Silt Loam Weld Silt Loam Keith, Goshen Kuma Silt Loam Silty Clay Loam Bijou Loamy Sand Manter Loamy Sand
Previous Crop Beans Barley Corn Onions Corn Corn
Fertilization N acre -1 P2O5 acre -1 K2O acre -1 Zn acre -1 S acre -1 210 0 0 0 0 185 0 0 0 0 174 45 0 1.5 5 185 50 0 0 0 275 30 48 1 5 250 98 10 1 10 Herbicide Marksman Distinct Dual II
Bladex Bladex Dual II Gramoxone Tuff Atrazine Bicep Light Magnum
Insecticide Furadan Comite Dimethoate
Pen Cap Comite II Capture
Force None
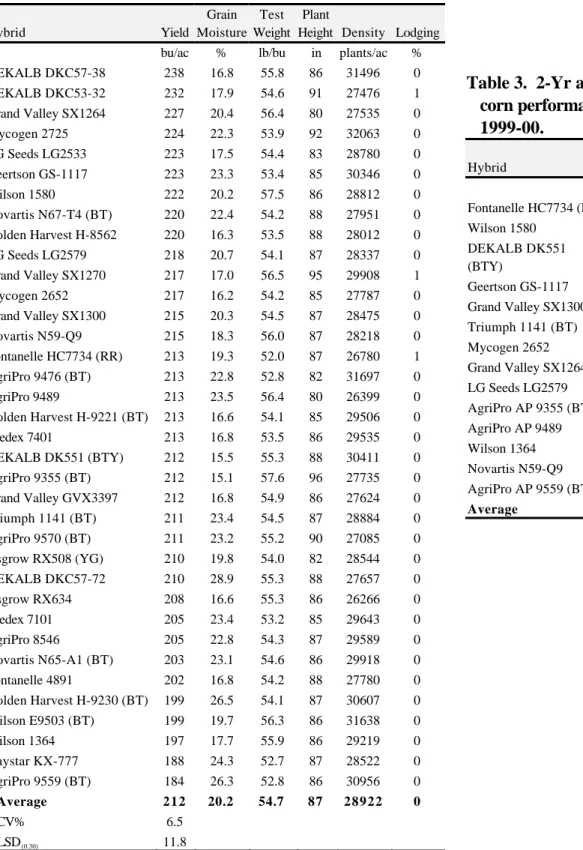
Table 2. Irrigated corn performance at Burlington
1in
2000.
Hybrid Yield Grain Moisture Test Weight PlantHeight Density Lodging bu/ac % lb/bu in plants/ac % DEKALB DKC57-38 238 16.8 55.8 86 31496 0 DEKALB DKC53-32 232 17.9 54.6 91 27476 1 Grand Valley SX1264 227 20.4 56.4 80 27535 0 Mycogen 2725 224 22.3 53.9 92 32063 0 LG Seeds LG2533 223 17.5 54.4 83 28780 0 Geertson GS-1117 223 23.3 53.4 85 30346 0 Wilson 1580 222 20.2 57.5 86 28812 0 Novartis N67-T4 (BT) 220 22.4 54.2 88 27951 0 Golden Harvest H-8562 220 16.3 53.5 88 28012 0 LG Seeds LG2579 218 20.7 54.1 87 28337 0 Grand Valley SX1270 217 17.0 56.5 95 29908 1 Mycogen 2652 217 16.2 54.2 85 27787 0 Grand Valley SX1300 215 20.3 54.5 87 28475 0 Novartis N59-Q9 215 18.3 56.0 87 28218 0 Fontanelle HC7734 (RR) 213 19.3 52.0 87 26780 1 AgriPro 9476 (BT) 213 22.8 52.8 82 31697 0 AgriPro 9489 213 23.5 56.4 80 26399 0 Golden Harvest H-9221 (BT) 213 16.6 54.1 85 29506 0 Seedex 7401 213 16.8 53.5 86 29535 0 DEKALB DK551 (BTY) 212 15.5 55.3 88 30411 0 AgriPro 9355 (BT) 212 15.1 57.6 96 27735 0 Grand Valley GVX3397 212 16.8 54.9 86 27624 0 Triumph 1141 (BT) 211 23.4 54.5 87 28884 0 AgriPro 9570 (BT) 211 23.2 55.2 90 27085 0 Asgrow RX508 (YG) 210 19.8 54.0 82 28544 0 DEKALB DKC57-72 210 28.9 55.3 88 27657 0 Asgrow RX634 208 16.6 55.3 86 26266 0 Seedex 7101 205 23.4 53.2 85 29643 0 AgriPro 8546 205 22.8 54.3 87 29589 0 Novartis N65-A1 (BT) 203 23.1 54.6 86 29918 0 Fontanelle 4891 202 16.8 54.2 88 27780 0 Golden Harvest H-9230 (BT) 199 26.5 54.1 87 30607 0 Wilson E9503 (BT) 199 19.7 56.3 86 31638 0 Wilson 1364 197 17.7 55.9 86 29219 0 Kaystar KX-777 188 24.3 52.7 87 28522 0 AgriPro 9559 (BT) 184 26.3 52.8 86 30956 0 Average 212 20.2 54.7 87 28922 0 CV% 6.5 LSD(0.30) 11.8
1Trial conducted on the Don Sircy farm; seeded 5/6 and harvested 10/16.
Table 3. 2-Yr average irrigated
corn performance at Burlington,
1999-00.
Hybrid Yield Grain Moisture Test Weight bu/ac % lb/bu Fontanelle HC7734 (RR) 190 17.8 52.5 Wilson 1580 189 19.7 57.7 DEKALB DK551 (BTY) 188 15.4 55.8 Geertson GS-1117 188 21.1 54.6 Grand Valley SX1300 186 20.3 55.0 Triumph 1141 (BT) 182 24.0 53.5 Mycogen 2652 182 15.3 54.6 Grand Valley SX1264 182 19.5 57.1 LG Seeds LG2579 181 21.0 55.1 AgriPro AP 9355 (BT) 180 14.5 57.3 AgriPro AP 9489 180 21.4 57.0 Wilson 1364 175 16.9 56.6 Novartis N59-Q9 172 17.5 56.5 AgriPro AP 9559 (BT) 165 25.3 53.6 Average 181 19.2 55.5Table 4. Irrigated corn performance at Greeley
1in 2000.
Hybrid Yield Grain Moisture Test Weight PlantHeight Density Lodging bu/ac % lb/bu in plants/ac % DEKALB DK507 204 16.5 57.0 89 32959 1 DEKALB DKC48-83 204 16.8 57.1 93 31794 1 DEKALB DKC44-42 201 14.9 54.5 89 30710 0 Seedex 6101 194 19.3 56.6 94 33480 0 Geertson GS-1067 194 20.5 54.7 94 31270 2 Novartis N43-C4 (BT) 190 17.2 55.0 90 32293 0 Grand Valley GVX7214 189 15.5 55.4 87 30976 2 Seedex 6201 189 16.7 56.7 95 32295 1 Grand Valley SX1177 188 14.4 56.2 92 31700 2 AgriPro 9355 (BT) 173 20.7 56.5 90 30880 0 Asgrow RX393 (YG) 170 16.0 55.1 89 32363 0 Grand Valley GVX4615 170 19.2 55.7 93 31453 2 NC+ 1550 168 15.3 55.4 89 31801 1 LG Seeds LG2512 168 18.7 56.3 94 31839 1 Asgrow RX452 (YG) 164 21.8 57.2 94 31548 0 Grand Valley SX1211 163 15.1 55.0 95 30884 4 Kaystar X0031 161 20.6 57.3 87 31117 1 LG Seeds LG2499 161 20.4 56.3 90 31634 1 Garst 8590 161 20.4 56.9 93 29066 1 AgriPro 9340 160 16.5 55.5 95 31384 4 AgriPro 9313 160 14.8 54.9 90 33187 2 Seedex 6202 160 19.4 58.4 93 31081 3 Seedex 5701 157 14.4 55.3 92 32599 2 Kaystar KX-688 154 21.1 53.8 89 32399 1 Grand Valley SX1216 153 20.1 56.6 91 31879 3 Grand Valley GVX0946 150 14.7 54.8 94 33400 2 Average 173 17.7 55.9 92 31769 1 CV% 11.6 LSD(0.30) 17.2
1Trial conducted on the Brent Adler farm; seeded 4/27 and harvested 10/30.
No ear drop.
Table 5. 2-Yr average irrigated
corn performance at SW Greeley,
1999-00.
Hybrid Yield Grain Moisture Test Weight bu/ac % lb/bu DEKALB DK507 186 15.1 55.1 Grand Valley SX1177 178 13.7 55.5 Seedex 6101 174 16.7 54.6 AgriPro AP 9355 (BT) 171 17.2 53.7 AgriPro AP 9313 169 14.1 53.0 AgriPro AP 9340 161 15.3 53.1 Grand Valley SX1216 161 17.0 54.5 Average 171 15.6 54.2Table 6. Irrigated corn performance at Julesburg
1in 2000.
Hybrid Yield Grain Moisture Test Weight PlantHeight Density Lodging bu/ac % lb/bu in plants/ac % Fontanelle 4990 202 14.3 56.2 89 34252 0 DEKALB DKC57-72 194 17.4 57.2 87 33504 0 DEKALB DKC57-38 194 13.6 56.5 87 33227 2 AgriPro 9340 193 12.6 54.9 86 33925 2 Mycogen 2767 (BT) 192 13.2 54.7 88 36052 1 DEKALB DKC53-32 191 12.9 54.4 89 32915 2 Garst 8590 191 13.5 56.7 89 34661 0 Grand Valley SX1263 188 13.7 57.2 83 32473 0 Novartis N59-Q9 187 14.0 56.4 90 32111 1 Grand Valley SX1264 186 14.3 57.5 83 33418 2 Wilson E9503 (BT) 184 13.5 57.5 88 34573 1 Fontanelle 4891 181 13.5 57.8 87 35424 1 Grand Valley SX1229 181 12.2 54.5 85 34848 0 Fontanelle 4997 181 15.7 58.5 89 34670 2 Wilson 1364 180 13.3 58.0 85 32828 0 Seedex 7101 178 13.9 55.7 88 32851 1 Mycogen 2657 (BT) 177 13.0 55.7 92 36537 0 NC+ 3320 177 13.2 56.7 85 33712 0 Fontanelle 4193 176 14.0 57.5 80 32566 1 AgriPro 9313 174 12.3 54.8 86 31548 1 Asgrow RX508 (YG) 174 13.4 54.5 75 29594 2 Grand Valley GVX1646 174 13.3 57.2 89 33686 1 Asgrow RX634 171 12.9 55.2 91 34710 1 AgriPro 9489 167 15.2 57.4 79 31992 2 AgriPro 9476 (BT) 167 13.3 53.8 89 34966 5 Seedex 6201 165 13.4 57.3 79 29780 3 DEKALB DK551 (BTY) 164 12.6 54.7 88 34457 3 Mycogen 2652 164 12.3 54.1 89 34233 3 Kaystar KX-688 162 12.6 52.5 87 32460 1 Triumph TRX0301 159 12.4 54.6 84 32787 2 Seedex 7401 155 12.4 53.7 89 31379 2 Geertson GS-998 149 11.9 53.9 85 35092 3 Average 177 13.4 55.8 86 33476 1 CV% 8.5 LSD(0.30) 12.9
1Trial conducted on the Gene Bauerle farm; seeded 5/6 and harvested 10/14.
No ear drop.
Table 7. 2-Yr average irrigated
corn performance at Julesburg,
1999-00.
Hybrid Yield Grain Moisture Test Weight bu/ac % lb/bu Grand Valley GVX3376 174 21.0 57.0 DEKALB DK551 (BTY) 173 17.6 54.6 Grand Valley SX1264 171 23.1 56.1 Fontanelle 4997 169 23.0 56.5 Fontanelle 4193 169 23.5 56.0 Wilson 1364 167 20.3 56.6 Seedex 7401 166 21.3 54.0 AgriPro AP 9489 160 23.1 55.8 Average 169 21.6 55.8Table 8. Irrigated corn performance at Rocky Ford
1in
2000.
Hybrid Yield Grain Moistur e Test Weight Plant HeightDensity Lodging Silking2
bu/ac % lb/bu in plants/ac % date Pioneer brand 33P67 (BT) 268 20.2 61.5 94 33214 1 198 Novartis N67-T4 (BT) 266 18.8 57.9 92 33487 0 196 Grand Valley GVX5458 250 17.7 58.2 95 31762 0 198 Garst 8546 248 21.8 57.7 93 33124 0 197 Grand Valley SX1600 247 19.2 59.4 109 31490 3 202 Mycogen 2725 246 21.2 57.6 89 32035 0 197 DEKALB DK611 246 15.4 59.6 92 33396 1 198 Pioneer brand 33B51 (BT) 246 21.2 59.7 90 30855 0 196 AgriPro 9570 (BT) 243 21.4 58.7 95 32942 1 196 Pioneer brand 31A13 (BT) 242 19.2 59.8 96 31490 1 200 Grand Valley SX1300 241 19.2 57.6 92 31036 1 196 Pioneer brand 32R42 237 18.9 60.2 92 30220 2 199 Novartis N7070 (BT) 237 16.8 57.6 94 31672 0 197 Kaystar KX-920 236 25.4 56.4 96 32942 0 198 Triumph 1514A (BT)(IMI) 234 20.3 57.4 94 31218 3 199 Mycogen 2784 (BT) 234 16.8 57.9 99 33578 1 196 Grand Valley GVX4478 233 19.7 57.4 93 30310 1 197 DEKALB DK655 217 20.5 60.2 92 30129 1 198 DEKALB DK647 (BTY) 211 20.3 56.7 103 31036 0 199 Asgrow RX799 (BT) 209 23.4 59.7 98 30764 0 199 Pioneer brand 31G98 204 22.3 59.9 99 32126 1 203 Asgrow RX889 203 27.3 58.8 91 31309 5 200 Grand Valley GVX0145 195 25.7 57.1 103 29584 2 203 Grand Valley GVX5345 193 26.0 56.9 107 30764 1 203 Average 233 20.8 58.5 96 31687 1 198 CV% 6.8 LSD(0.30) 13.5
1Trial conducted on the Arkansas Valley Research Center; seeded 5/4 and harvested
10/26. No ear drop.
2Julian date.
Table 9. 2-Yr average irrigated
corn performance at Rocky Ford,
1999-00.
Hybrid Yield Grain Moisture Test Weight bu/ac % lb/bu Garst 8546 238 17.8 57.9 Grand Valley SX1300 231 16.8 57.9 Mycogen 2725 230 17.5 58.0 DEKALB DK611 223 14.8 59.7 Novartis N7070 (BT) 220 15.3 57.8 DEKALB DK647 (BTY) 213 17.5 57.5 Asgrow RX799 (BT) 206 21.0 59.9 DEKALB DK655 206 19.6 60.1 Asgrow RX889 202 24.6 59.3 Average 219 18.3 58.7Table 10. Irrigated corn performance at Wiggins
1in 2000.
Hybrid Yield Grain Moisture Test Weight PlantHeight Density Lodging bu/ac % lb/bu in plants/ac % DEKALB DKC53-32 236 15.3 56.4 83 32344 1 LG Seeds LG2533 223 17.3 55.0 83 35020 3 Asgrow RX508 (YG) 222 17.4 55.5 79 34172 1 AgriPro 9570 (BT) 218 27.1 55.0 85 33013 2 Geertson GS-1117 218 22.0 55.0 85 27510 9 Seedex 6201 215 15.7 57.5 79 30902 2 Novartis N67-T4 (BT) 214 22.9 55.4 83 36662 1 Garst 8590 212 18.8 57.0 83 37052 2 DEKALB DKC57-38 211 17.7 57.3 87 34646 3 Seedex 5701 210 14.6 57.9 83 31763 1 Grand Valley SX1229 210 16.5 57.3 82 46152 3 Grand Valley GVX4615 209 17.5 56.6 86 35230 8 Asgrow RX634 208 16.7 56.8 87 34742 2 Novartis N59-Q9 206 20.1 57.1 86 38151 4 Grand Valley SX1264 203 20.7 58.4 79 36740 1 Seedex 6101 191 17.2 57.1 82 40195 1 AgriPro 9555 (BT) 189 27.8 55.0 89 34201 1 Kaystar KX-688 183 16.7 54.1 80 32571 3 Grand Valley GVX1646 180 18.5 58.3 85 34946 4 DEKALB DKC57-72 175 27.3 56.0 79 44243 0 Seedex 6202 162 17.9 59.0 84 34940 9 Average 204 19.3 56.6 83 35486 3 CV% 10.7 LSD(0.30) 18.7
1Trial conducted on the Larry Rothe farm; seeded 5/4 and harvested 11/3.
No ear drop.
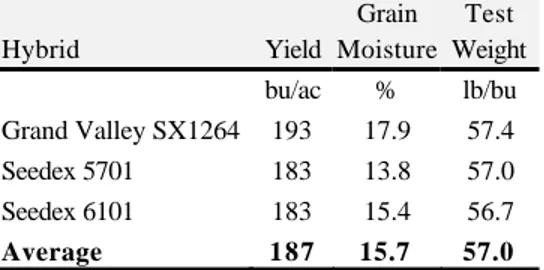
Table 11. 2-Yr average irrigated
corn performance at Wiggins,
1999-00.
Hybrid Yield Grain Moisture Test Weight bu/ac % lb/bu Grand Valley SX1264 193 17.9 57.4 Seedex 5701 183 13.8 57.0 Seedex 6101 183 15.4 56.7 Average 187 15.7 57.0Table 12. Irrigated corn performance at Yuma
1in 2000.
Hybrid Yield Grain Moisture Test Weight PlantHeight Density Lodging bu/ac % lb/bu in plants/ac % DEKALB DKC57-72 262 20.8 57.6 94 32290 5 DEKALB DKC57-38 247 14.7 58.1 90 31244 4 Producers PH 717 (BT) 246 17.4 56.8 95 33496 3 Seedex 7101 243 15.2 56.2 94 29780 4 DEKALB DK551 (BTY) 243 14.0 56.4 92 31484 2 Novartis N65-A1 (BT) 242 15.5 57.1 92 29790 2 Geertson GS-1117 242 16.6 56.4 92 29197 2 Novartis N67-T4 (BT) 241 15.7 57.5 90 30261 5 Grand Valley SX1300 238 14.4 56.7 95 30974 1 AgriPro 9555 (BT) 235 18.4 54.5 94 33320 5 Novartis N59-Q9 232 14.2 57.1 93 32488 4 AgriPro 9570 (BT) 232 17.9 57.3 97 31230 5 Asgrow RX634 232 14.4 57.4 92 30747 2 Garst 8590 231 15.0 58.4 93 31149 1 Wilson 1364 230 14.7 58.4 97 31613 2 NC+ 4880 230 15.8 56.7 90 31309 3 Grand Valley SX1264 230 14.7 59.1 88 29520 3 Triumph 1141 (BT) 230 18.6 58.1 98 30717 6 Producers PH 714 (BT) 229 16.2 56.4 95 32196 4 Grand Valley GVX3397 229 13.6 57.1 92 31410 5 DEKALB DKC53-32 228 13.6 56.3 90 32474 3 LG Seeds LG2579 227 15.9 57.4 91 30771 8 Fontanelle 4990 224 17.9 58.5 98 29622 3 LG Seeds LG2584 (BT) 223 15.2 56.5 91 31251 1 Asgrow RX508 (YG) 221 13.7 56.4 82 31059 5 Mycogen 2767 (BT) 219 15.7 56.8 97 30855 9 Fontanelle 4193 218 15.2 58.5 86 31075 5 Kaystar KX-688 218 13.0 55.2 93 30264 4 Fontanelle 4997 214 16.3 60.1 91 30452 4 Fontanelle 4891 214 14.1 58.1 94 31036 3 AgriPro 9476 (BT) 211 16.4 57.2 93 30112 3 Wilson 1580 210 18.5 59.1 97 30564 3 Seedex 7401 209 14.7 56.2 88 30327 5 Mycogen 2657 (BT) 209 13.8 56.3 92 31628 1 Grand Valley SX1270 208 14.4 58.9 96 30984 2 LG Seeds LG2533 207 13.9 56.6 90 30722 1
Table 13. 2-Yr average irrigated
corn performance at Yuma,
1999-00.
Hybrid Yield Grain Moisture Test Weight bu/ac % lb/bu DEKALB DK551 (BTY) 236 16.0 57.2 LG Seeds LG2584 (BT) 228 19.6 56.0 LG Seeds LG2579 225 19.6 56.7 NC+ 4880 225 20.1 56.7 Wilson 1364 223 16.8 58.5 Grand Valley SX1264 222 16.9 58.7 Garst 8590 220 16.8 58.5 Triumph 1141 (BT) 219 23.4 57.3 Novartis N59-Q9 219 16.8 57.5 Fontanelle 4193 217 18.0 58.4 Seedex 7401 214 17.3 57.4 Wilson 1580 210 19.9 59.2 Fontanelle 4997 209 18.2 60.0 Average 220 18.4 57.8Dryland Grain Corn Performance Data
Northeastern Colorado growers have been
adopting more intensive dryland cropping systems as
shown by increased dryland corn acreage which rose
from 26,000 acres in 1990 to 290,000 acres in 1999.
Average dryland corn yield was 69 bu/acre in 1999 with
most of the acreage in nine NE Colorado counties.
Trial Location 2000 GDD Long Term Average GDD 2000 Precip. 7/15-8/25 % of normal 7/15-8/25 Akron 2807 2559 2.63 85% Haxtun 2949 2755 2.39 83%
The 2000 dryland trials suffered from below
average precipitation in the critical July-August period at
both locations. The Stratton location was lost to
prolonged drought. Nielsen et al. (1996) determined that
70% of variation in dryland corn yield can be explained by
rainfall during the six-week period, from 15 July to 25
August, corresponding to tasseling, silking, and early
grain-filling. Dryland grain yields were remarkably high given
the duration and severity of the 2000 summer drought.
Reference: Nielsen, D., Peterson, G., Anderson, R.. , Ferreira, V., Shawcroft, W. and Remington, K. 1996. Estimating Corn Yields From Precipitation Records. Conservation Tillage Fact Sheet #2-96. USDA-ARS, P.O. Box 400, Akron, CO.
Table 14. Dryland cultural conditions in 2000.
Akron Julesburg Soil Type Rago Silt
Loam
Kieth, Goshen Kuma Silt Loam Previous Crop Wheat Wheat Fertilization N lb acre-1 P2O5 lb acre-1 50 0 108 30 Herbicide Round Up Frontier Atrazine Dual II Bladex
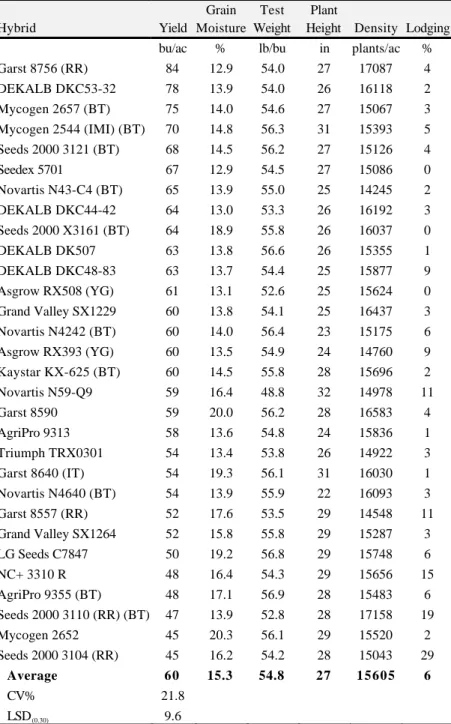
Table 15. Dryland corn performance at Akron
1in 2000.
Hybrid Yield Grain Moisture Test Weight PlantHeight Density Lodging bu/ac % lb/bu in plants/ac % Garst 8756 (RR) 84 12.9 54.0 27 17087 4 DEKALB DKC53-32 78 13.9 54.0 26 16118 2 Mycogen 2657 (BT) 75 14.0 54.6 27 15067 3 Mycogen 2544 (IMI) (BT) 70 14.8 56.3 31 15393 5 Seeds 2000 3121 (BT) 68 14.5 56.2 27 15126 4 Seedex 5701 67 12.9 54.5 27 15086 0 Novartis N43-C4 (BT) 65 13.9 55.0 25 14245 2 DEKALB DKC44-42 64 13.0 53.3 26 16192 3 Seeds 2000 X3161 (BT) 64 18.9 55.8 26 16037 0 DEKALB DK507 63 13.8 56.6 26 15355 1 DEKALB DKC48-83 63 13.7 54.4 25 15877 9 Asgrow RX508 (YG) 61 13.1 52.6 25 15624 0 Grand Valley SX1229 60 13.8 54.1 25 16437 3 Novartis N4242 (BT) 60 14.0 56.4 23 15175 6 Asgrow RX393 (YG) 60 13.5 54.9 24 14760 9 Kaystar KX-625 (BT) 60 14.5 55.8 28 15696 2 Novartis N59-Q9 59 16.4 48.8 32 14978 11 Garst 8590 59 20.0 56.2 28 16583 4 AgriPro 9313 58 13.6 54.8 24 15836 1 Triumph TRX0301 54 13.4 53.8 26 14922 3 Garst 8640 (IT) 54 19.3 56.1 31 16030 1 Novartis N4640 (BT) 54 13.9 55.9 22 16093 3 Garst 8557 (RR) 52 17.6 53.5 29 14548 11 Grand Valley SX1264 52 15.8 55.8 29 15287 3 LG Seeds C7847 50 19.2 56.8 29 15748 6 NC+ 3310 R 48 16.4 54.3 29 15656 15 AgriPro 9355 (BT) 48 17.1 56.9 28 15483 6 Seeds 2000 3110 (RR) (BT) 47 13.9 52.8 28 17158 19 Mycogen 2652 45 20.3 56.1 29 15520 2 Seeds 2000 3104 (RR) 45 16.2 54.2 28 15043 29 Average 60 15.3 54.8 27 15605 6 CV% 21.8 LSD(0.30) 9.6
1Trial conducted on the Central Great Plains Research Center; seeded 4/29 and
harvested 10/9. Insignificant ear drop.
Table 16. 2-Yr average dryland
corn performance at Akron,
1999-00.
Hybrid Yield Grain Moisture Test Weight bu/ac % lb/bu Kaystar KX-625 (BT) 92 13.9 56.9 AgriPro AP 9313 88 13.2 55.4 Novartis N4640 (BT) 87 13.3 56.4 Novartis N4242 (BT) 84 13.9 56.1 Mycogen 2544 (BT) 83 14.4 55.8 AgriPro AP 9355 (BT) 83 15.0 56.9 Mycogen 2652 78 16.6 55.2 Average 85 14.3 56.1Table 17. Dryland corn performance at Julesburg
1in 2000.
Hybrid Yield Grain Moisture Test Weight Ear Height Density lb/ac % lb/bu in plants/ac Novartis N43-C4 (BT) 65 19.4 54.1 29 15374 Mycogen 2544 (IMI) (BT) 64 17.5 55.0 34 14131 Asgrow RX508 (YG) 64 19.1 52.0 27 16243 Seeds 2000 3121 (BT) 62 17.1 55.0 32 14525 DEKALB DKC48-83 62 14.8 51.4 32 14055 Garst 8756 (RR) 61 15.7 53.2 31 16258 Novartis N4242 (BT) 60 17.4 56.2 28 14540 Seedex 5701 59 15.5 54.4 30 13205 Grand Valley SX1229 59 14.6 54.7 28 16262 Novartis N4640 (BT) 58 17.2 55.3 25 14434 Grand Valley SX1264 57 24.1 55.4 30 16078 Kaystar KX-625 (BT) 56 25.3 53.0 32 15834 DEKALB DKC53-32 54 26.7 51.8 30 13098 AgriPro 9313 54 19.3 54.3 27 16074 Golden Harvest H-2547 53 24.4 54.3 32 16673 DEKALB DK507 52 16.7 57.0 28 13714 Mycogen 2616 (IMI) (IT) 50 25.8 52.9 32 15028 Golden Harvest H-8250 50 22.0 55.7 33 14686 Seeds 2000 3110 (RR) (BT) 50 18.3 52.0 33 14968 Mycogen 2657 (BT) 50 30.0 53.0 33 13702 AgriPro 9555 (BT) 49 30.0 53.1 33 14586 Garst 8590 48 29.2 54.4 32 14139 Seeds 2000 3104 (RR) 48 28.9 52.0 30 14518 Garst 8640 (IT) 46 29.3 55.4 35 15601 Mycogen 2652 45 27.6 52.5 34 15801 Triumph TRX0301 45 22.1 53.4 30 14979 Golden Harvest H-8562 44 30.0 51.1 33 15753 Seeds 2000 X3161 (BT) 44 30.0 54.2 31 15588 Garst 8557 (RR) 44 28.2 51.0 32 14975 Average 54 22.6 53.7 31 14994 CV% 15.3 LSD(0.30) 6.01Trial conducted on the Josh Lechman farm; seeded 5/13 and harvested 10/12.
No ear drop.
Table 18. 2-Yr average dryland
corn performance at Julesburg,
1999-00.
Hybrid Yield Grain Moistur e Test Weight bu/ac % lb/bu Novartis N4640 (BT) 77 14.6 55.8 Novartis N4242 (BT) 77 15.0 56.7 Mycogen 2544 (BT) 76 15.3 55.4 Mycogen 2657 (BT) 70 21.8 53.4 Mycogen 2652 62 19.9 52.4 Average 72 17.3 54.7Western Slope Grain Corn Performance Data
Over 3,000,000 bushels of corn grain are produced
on some 30,000 acres of irrigated farmland on the Western
Slope every year, bringing in over $8 million to local
producers. Calvin Pearson of the Colorado Agricultural
Experiment Station evaluates long-season and short-season
corn grain hybrids to provide reliable and unbiased
information to Western Slope producers.
Table 19. Western Slope irrigated corn cultural
conditions in 2000.
Delta Fruita Short Season Fruita Long Season Soil Type Mesa, SandyClay Loam
Youngston Loam
Youngston Loam Previous Crop Sweet Corn Alfalfa Alfalfa Fertilization N lb acre -1 P2O5 acre -1 190 77 202 104 202 104 Herbicide Lasso Clarity, 2,4-D Bladex 4L Bladex 4L Insecticide Comite Dimethoate Lorsban Comite II Comite II
Irrigation Furrow Furrow Furrow
Table 20. Irrigated short season corn performance
at Delta
1in 2000.
Hybrid Yield Grain Moisture
Test
Weight Density Lodging bu/ac % lb/bu plants/ac % Geertson GS-1117 286 15.1 59.4 32769 2 DEKALB DK551 264 14.2 59.3 34670 2 Grand Valley GVX4615 263 14.2 59.2 33372 1 Grand Valley SX1238 253 14.0 59.2 33882 2 DEKALB DK537 247 13.3 59.9 37266 14 Grand Valley SX1229 242 13.1 58.8 37173 1 DEKALB DK477 233 13.1 59.5 32352 4 Grand Valley GVX0111 224 13.6 59.4 32445 6 DEKALB DKC48-83 223 13.2 61.0 34948 2 Grand Valley GVX7214 223 13.0 59.8 31889 2 Grand Valley GVX1646 216 14.2 61.0 31982 0 Garst 8756 (RR) 182 13.4 59.4 32306 4 Average 238 13.7 59.6 33754 3 CV% 5.8 LSD(0.30) 10.2
1Trial conducted on the Wayne Brew farm; seeded 5/2 and harvested
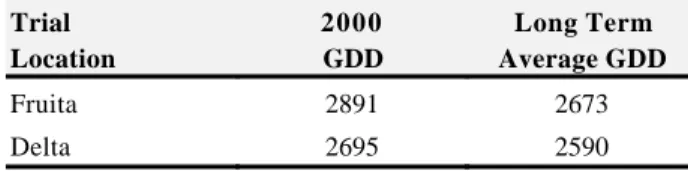
10/30. No ear drop. Trial Location 2000 GDD Long Term Average GDD Fruita 2891 2673 Delta 2695 2590
Table 21. 2-yr ave irrigated corn
performance at Delta, 1999-00.
Hybrid Yield Grain Moisture Test Weight bu/ac % lb/bu DEKALB DK551 230 14.0 53.7 Grand Valley GVX4615 224 14.2 54.8 DEKALB DK537 221 13.0 55.4 Grand Valley SX1238 220 13.2 53.8 DEKALB DK477 205 12.3 56.2 Average 220 13.3 54.8Table 22. Irrigated short season corn performance
at Fruita
1in 2000.
Hybrid Yield Grain Moistur e Test Weight Density Lodgingbu/ac % lb/bu plants/ac % Grand Valley SX1300 244 19.8 56.2 31490 0 Geertson GS-1067 218 17.2 57.6 32761 2 DEKALB DK537 217 14.7 60.1 32988 2 DEKALB DK551 210 15.3 59.2 31944 3 Grand Valley GVX1646 210 15.9 60.5 32352 0 Grand Valley SX1270 205 16.0 60.8 32353 0 DEKALB DKC48-83 205 15.1 59.8 28859 0 DEKALB DK477 201 14.8 59.1 30810 0 Grand Valley GVX4615 182 15.6 59.5 32716 0 Average 210 16.1 59.2 31808 1 CV% 11.4 LSD(0.30) 18.0
1Trial conducted on the Western Colorado Research Center; seed 5/3 and
harvested 10/27. No ear drop.
Table 23. 2-yr average irrigated short
season corn performance at Fruita,
1999-00.
Hybrid Yield Grain Moisture Test Weight bu/ac % lb/bu Grand Valley SX1300 250 20.0 54.9 Grand Valley SX1270 220 16.2 59.3 DEKALB DK551 217 14.3 57.8 DEKALB DK537 212 14.6 58.6 Grand Valley GVX4615 202 15.9 58.1 DEKALB DK477 192 13.8 58.2 Average 216 15.8 57.8Table 24. Irrigated long season corn performance at
Fruita
1in 2000.
Hybrid Yield Grain Moistur e Test Weight Density Lodgingbu/ac % lb/bu plants/ac % Grand Valley SX1600 270 20.8 56.3 31627 0 Grand Valley GVX5378 269 23.2 52.0 30765 0 Grand Valley GVX4478 229 18.8 56.6 31717 0 Grand Valley GVX3378 220 17.8 56.6 29630 0 Asgrow RX634 209 16.8 58.3 29267 0 DEKALB DK585 203 15.8 58.6 32262 1 DEKALB DKC57-38 174 15.5 59.8 32171 0 Average 225 18.4 56.9 31063 0 CV% 14.7 LSD(0.30) 25.0
1Trial conducted on the Western Colorado Research Center; seed 5/3 and
harvested 10/27. No ear drop.
Table 25. 2-yr ave irrigated long season
corn performance at Fruita, 1999-00.
Hybrid Yield Grain Moisture Test Weight bu/ac % lb/bu DEKALB DK585 218 16.6 56.2
Corn Silage Performance Data for Eastern Colorado
and the Western Slope
Colorado farmers annually cut more than 100,000
acres of corn for silage. Larimer, Weld, Morgan, Logan, Kit
Carson, and Montrose counties are the most prominent
silage-producing counties in Colorado. Corn seed for silage
in Colorado represents annual sales of about $3 million.
Colorado State University personnel evaluate commercial
corn silage hybrids at multiple locations to provide reliable
and unbiased hybrid performance information to Colorado
corn growers.
Trial Location 2000 GDD Long Term Average GDD Fruita 2891 2673 Delta (Olathe) 2628 2590 Fort Collins 2431 2335 Rocky Ford 2982 2837Table 26. Corn silage cultural conditions in 2000.
Fort Collins Fruita Olathe Rocky Ford Soil Type Fort Collins
Clay Loam Youngston Loam Sandy Loam Silty Clay Loam Previous Crop Pinto Beans Alfalfa Silage corn Onions Fertilization N lb acre-1 P2O5 lb acre-1 K2O lb acre-1 150 40 0 202 104 0 228 102 0 185 50 0 Herbicide Aim 2,4-D
Bladex 4L Harness Bladex, Dual II Gramoxone Insecticide None Comite II Comite
Dimethoate
Comite II Capture
Table 27. Corn silage performance at Fort Collins
12000.
Hybrid Yield Moisture
Plant Height Density t/ac % in plants/ac Geertson GS-1099 32.1 65.6 96 32898 FR1064 x Lfy 419L 31.2 71.1 116 32471 Garst 8640 30.2 66.9 100 36421 Grand Valley SX1550 29.9 71.0 108 31944 Seedex 7401 29.5 66.2 97 33883 Seedex 7101 29.3 69.0 94 31628 Grand Valley SX1270 29.1 68.3 101 34759 MBS3811 x Lfy 497L 28.7 75.9 110 34024 Grand Valley GVX4478 28.6 71.9 101 32553 Grand Valley SX1256 28.6 67.2 95 33401 Grand Valley SX1356 28.5 71.1 102 34106 AgriPro HY9646 28.3 74.8 106 31483 Seedex 6201 27.6 65.2 88 32638 MBS3811 x Lfy 554L 25.8 77.3 100 32983 Seedex 5701 25.5 63.5 90 30536 Average 28.9 69.7 100 33049 CV% 7.6 LSD(0.30) 1.9
1Trial conducted on the Agricultural Research Development and Education
Center; seeded 4/26 and harvested 9/14.
Table 28. 2-Yr average irrigated
corn silage performance at Fort
Collins, 1999-00.
Hybrid Yield Moisture t/ac % Geertson GS-1099 30.7 67.8 Grand Valley SX1550 29.5 71.9 Grand Valley SX1270 28.9 68.5 AgriPro HY 9646 28.2 75.1 Grand Valley SX1356 27.9 71.6 Grand Valley SX1256 27.7 67.5 Average 28.8 70.4
Table 29. Corn silage performance at Rocky Ford
12000.
Hybrid Yield Moisture Density Plant
Height Silking2
t/ac % plants/ac in date MBS3811 x Lfy 497L 45.3 52.2 31853 109 203 AgriPro HY9646 43.8 54.3 29403 104 203 Wilson E7004 43.1 55.6 29222 97 205 Asgrow RX897 41.3 53.9 30583 97 203 Grand Valley SX1602 40.7 53.9 31309 105 203 Wilson EDX51 40.1 58.4 31309 96 203 Garst 8315 39.8 55.5 30310 95 205 DEKALB DK679 39.4 57.5 31762 107 202 Pioneer brand 31B13 (BT) 39.3 57.6 31581 99 203 Pioneer brand 31G98 38.6 56.4 32398 101 204 Grand Valley GVX4601 38.6 55.6 30220 99 201 Pioneer brand 31R88 37.9 55.6 32398 105 204 Grand Valley GVX4681 37.8 55.3 31672 95 198 DEKALB DK647 (BTY) 37.6 54.7 30583 101 200 Grand Valley GVX2416 36.6 57.8 26862 98 202 FR1064 x Lfy 419L 36.3 54.3 31944 116 202 Wilson E7005 35.7 58.5 28496 94 206 MBS3811 x Lfy 554L 34.9 60.3 28223 112 206 Grand Valley GVX4478 34.1 56.4 30492 93 198 Asgrow RX799 (BT) 32.7 56.5 31127 100 202 Average 38.7 56.0 30587 101 203 CV% 10.0 LSD(0.30) 3.3
1Trial conducted on the Arkansas Valley Research Center; seeded 5/4 and
harvested 9/14.
2Julian date.
Table 30. 2-Yr average corn silage
performance at Rocky Ford,
1999-00.
Hybrid Yield Moisture t/ac % AgriPro HY 9646 40.6 57.7 Wilson E7004 38.9 59.6 Asgrow RX897 38.2 58.9 Garst Seed 8315 37.7 59.9 Pioneer brand 31B13 (BT) 36.9 60.1 DEKALB DK647 (BTY) 34.2 57.1 Asgrow RX799 (BT) 32.4 56.9 Average 37.0 58.6
Table 31. Corn silage performance at Fruita
1in 2000.
Hybrid Yield Moisture Density Plant Height Ear Height t/ac % plants/ac in in Grand Valley SX1602 41.0 61.2 34245 120 55 DEKALB DK641 39.3 53.8 34570 108 50 Wilson E7004 37.7 62.7 31789 109 56 Grand Valley SX1545M 37.3 60.0 35033 121 59 Grand Valley GVX5378 36.8 64.7 31465 116 49 Geertson GS-1099 34.7 57.0 32253 112 50 MBS3811 x Lfy 554 L 34.3 68.8 29102 132 58 Grand Valley GVX0145 34.1 63.0 33736 118 52 FR1064 x Lfy 419 L 33.8 63.8 34014 120 48 Wilson E7005 32.1 66.4 28175 106 41 MBS3811 x Lfy 497 L 31.9 64.4 33736 118 46 Grand Valley SX1550 30.9 63.2 35496 122 55 Wilson EDX51 30.4 65.3 34014 114 54 DEKALB DK679 26.7 65.1 31094 115 55 Average 34.3 62.8 32766 117 52 CV% 18.7 LSD(0.30) 4.8
1Trial conducted on the Western Colorado Research Center; seeded 5/3 and
harvested 9/12.
Table 32. 2-Yr average corn silage
performance at Fruita, 1999-00.
Hybrid Yield Moisture t/ac % DEKALB DK641 34.1 55.5 Wilson E7004 33.8 64.6 Grand Valley SX1550 30.4 63.6 DEKALB DK679 29.4 65.2 Average 31.9 62.2
Table 33. Corn silage performance at Olathe
1in 2000.
Hybrid Yield Moisture Density Plant Height Ear Height t/ac % plants/ac in in DEKALB DK679 29.1 71.2 33875 112 53 Grand Valley SX1600 28.4 70.9 33272 112 52 DEKALB DK641 28.4 68.3 35867 110 46 MBS3811 x Lfy 497 L 28.2 71.9 32484 116 44 FR1064 x Lfy 419 L 28.0 68.6 33782 126 52 Grand Valley GVX4478 27.9 67.7 31465 108 41 Grand Valley SX1356 26.7 69.1 32902 112 46 Grand Valley SX2546 (RR) 26.4 67.2 33596 114 44 Grand Valley SX2426 (RR) 26.2 67.1 32855 107 48 Garst 8314 26.2 72.8 34709 102 46 MBS3811 x Lfy 554 L 25.7 73.2 30399 125 50 Grand Valley GVX4445 25.6 68.3 32160 106 46
Table 34. 2-Yr average corn silage
performance at Olathe, 1999-00.
Hybrid Yield Moisture t/ac % DEKALB DK679 28.6 73.5 DEKALB DK641 28.6 70.5 Grand Valley SX1356 26.6 69.7 Garst Seed 8314 26.2 74.7 Average 27.5 72.1
Seed Company Entrants in the 2000 Colorado Corn Performance Trials
BRAND/HYBRID ENTRANT ADDRESS TELEPHONE
Dekalb/Asgrow Monsanto 3100 Sycamore Road, Dekalb, IL 60115 (800) 833-5252 Fontanelle Fontanelle Hybrids 10981 8th Street, Fontanelle, NE 68044-2505 (402) 721-1410
Garst Garst Seed Co. 2369 330th Street, PO Box 500, Slater, IA 50244 (800) 831-6630
Geertson Geertson Seed Farms 1665 Burroughs Road, Adrian, OR 97901 (541) 339-3768 Golden Harvest Golden Harvest Seeds, Inc. PO Box A, 100 J.C. Robinson Blvd., Waterloo, NE 68069 (402) 779-2531 Grand Valley Grand Valley Hybrids, Inc. 840 23 Road, Grand Junction, CO 81505 (970) 243-3115 Kaystar Kaystar Seed 702 3rd Street SW, PO Box 947, Huron, SD 57350 (605) 352-8791
Lfy Lfy, L.L.C. 1281 Fourth Street, Monterey, CA 93940 (831) 657-9002 LG LG Seeds 1620 Hwy 10, Gibbon, NE 68840 (308) 234-4800 Mycogen Mycogen Seeds 1340 Corporate Center Curve, Eagan, MN 55121-1233 (800) 380-7282 NC+ NC+ Hybrids PO Box 4408, Lincoln, NE 68504 (402) 467-2517 Northrup King Novartis Seeds, Inc. 1060 Wheatland Diver, Buhler, KS 67522 (316) 543-2707 Pioneer Pioneer Hi-Bred Int'l., Inc. 1616 So. Kentucky Street, Ste C-150, Amarillo, TX 79102 (806) 356-0160 Producers Hybrids Producers Hybrids, Inc. PO Box C, Battle Creek, NE 68715 (888) 675-3190 SEEDEX Seedex PO Box 1477, Longmont, CO 80502 (303) 678-7333 Seeds 2000 Seeds 2000 Box 200, Breckenridge, MN 56520 (218) 643-2410 Triumph Triumph Seed Co, Inc. PO Box 1050, Hwy 62 Bypass, Ralls, TX 79357 (806) 253-2584 Wilson Wilson Genetics, L.L.C. PO Box 391, Harlan, IA 51537 (712) 755-3841
Entry Forms for 2001 Trials
Entry forms for 2001 trials may be
obtained from the Department of Soil and Crop
Sciences, Colorado State University, Cynthia
Johnson, C-4 Plant Science Building, Fort Collins,
CO 80523-1170; Telephone (970) 491-1914; Fax
(970) 491-2758; e-mail
cjohnson@agsci.colostate.edu or web site
http://www.colostate.edu/Depts/
SoilCrop/extension/CropVar/index.html.
For Western Slope entry blanks, contact
Calvin Pearson, Western Colorado Research
Center, 1910 L Road, Fruita, CO 81521;
Telephone (970) 858-0461.
Additional copies of this report may be
ordered from the Department of Soil and Crop
Sciences, Colorado State University, Cynthia
Johnson, C-4 Plant Science Building, Fort Collins,
CO 80523-1170; Telephone (970) 491-1914; Fax
(970) 491-2758; or e-mail
www.colostate.edu/Depts/SoilCrop/extension/CropVar/index.html
Winter Wheat Dry Beans
Corn
Crop Variety Performance for Colorado Crops
Sunflower Alfalfa
Spring Wheat Barley, & Oats