https://doi.org/10.47260/jesge/1115 Scientific Press International Limited
Dam Safety: Use of Instrumentation in Dams
Nasrat Adamo1, Nadhir Al-Ansari2, Varoujan Sissakian3, Jan Laue4and Sven Knutsson5
Abstract
Dam safety concerns do not stop at site selection, or the design and construction stages of a dam, but continue throughout its whole life. Seeing to safety issues of any dam is done by following up its behavior through visual observation supplemented and enriched by data collection from all the devices installed on or implanted in a dam to follow its reactions to the forces and conditions in action. Analysis of the accumulated data will show the safety level and the need or, otherwise, of any remedial works. Using measuring devices to quantifying seepage conditions at any dam and correlating this with water levels’ fluctuations is the first main issue that concerns dam safety. Added to this, measurement of pore water and total earth pressure in earthfill dams, temperature measurements in concrete dams, uplift and displacement measurements, and measurements of stresses and strains can all give good pictures of what is happening inside the dam and/or its foundation in both types of dams. In the following work, a summary of typical instrumentations and monitoring used in evaluating causes of common problems is given. Moreover, requirements for good instrumentation program are explained and the methods of data collection, whether manual, or use of stand-alone loggers and real-time monitoring networks are touched upon. The various devices in current use are described in more details. Actual examples of monitoring systems in existing dams are presented to show the value and importance of these systems to the safety of these dams.
Keywords: Dam safety, visual observation, seepage, pore water pressure, total
earth pressure, uplift, temperature measurements, displacement measurements, stand-alone loggers, real-time monitoring networks.
1 Consultant Dam Engineer, Sweden.
2 Lulea University of Technology, Lulea 971 87, Sweden.
3 Lecturer, University of Kurdistan Hewler and Private Consultant Geologist, Erbil. 4 Lulea University of Technology, Lulea 971 87, Sweden.
5 Lulea University of Technology, Lulea 971 87, Sweden.
Article Info: Received: September 7, 2020. Revised: September 17, 2020.
1. Introduction
Instrumentation of dams is the use of devices to measure safety parameters of such dams which together with visual inspections and other measurements made at the site provide powerful tools to evaluate the performance and discover early signs of abnormal behavior. Careful examination of instrumentation data on a continuing basis may reveal a possible critical condition. Conversely, instrumentation may be a mean of assuring that an observed condition is not serious and does not require immediate remedial measures.
At the design stage, many factors and parameters are assumed with respect to materials used, dam performance under the predicted loads, foundation conditions and the behavior of these foundation during operation. In most of the cases the materials are tested in laboratories and designs are based on calculations that the dam and foundation will act within the range of assumptions made fulfilling the required factors of safety.
In actual conditions, there are always large variations in materials properties, construction methods and control procedures; all leading to have conditions deferring from the original assumptions. Similarly, some loading conditions may be beyond those assumed due to gaps in recorded data or due to unprecedented or unexpected conditions. Inadequate knowledge of foundation, resulting from insufficient geological investigations or wrong interpretation and unsuitable treatment ends in undesirable safety problems.
Accumulated experience with dams coupled with increased knowledge of rock and soil mechanics and concrete technology in addition to lessons derived from many dam failures have led to the advent and progress of instrumental monitoring and the technological innovations in this field. Measurements obtained from instruments now may be electronic or made by using a mechanical device, and telemetering made it possible to relay real time measurements to remote control centers. Although simple devices for water level measurements and seepage measurements have been in long use, the great leap was made in the United States in the 1930s; the Bureau of Reclamation began to use controlled measurements to correlate the performance of completed dam structures with design assumptions and construction practices. Construction of new dams from the 1930s until the 1970s and after came with extensive utilization of dam instrumentation and monitoring programs. Such programs have undergone great changes in recent years; because of progress in microcomputer technology. However, although many advances have occurred in data acquisition, processing, instrumentation components and measuring techniques the factors affecting dam performance or the performance indicators have not changed putting more stress on the importance of instrumentation monitoring as one safeguard for dam safety.
2. Scope of Instruments Monitoring
Instruments measurements are complementary to visual inspections which are carried out routinely for checking dam safety issues. The benefits of instrument
monitoring include the following:
i. Instrumented monitoring products are quantitative data which supplement visual observations.
ii. The accuracy and sensitivity of the monitoring is defined as the instrumentation program is designed which is dependent on dams’ hazards classification.
iii. Certain instruments give information on foundation conditions and within the interior of structures which cannot be followed by visual inspections. iv. May provide long term, consistent records of data, while other methods of
observation tend to provide short-term discrete records.
v. Allows the detection of subtle trends in the dams’ performance under different loading conditions that may develop slowly over time.
vi. The collection of instrumentation data can be automated which allows for monitoring on a more frequent (near real time) basis.
vii. Automated monitoring systems can be used to initiate alarms for notifying dam monitoring personnel of sudden changes in the instrument data values due to normal or extreme loading conditions such as earthquakes and flooding.
All installed instruments require; however, constant attention to insure their good operation and prevents malfunctioning and giving false alarms. Typical instruments are used for checking certain areas of concern or performance aspects which generally include the following:
i. Seepage flows.
ii. Seepage water turbidity, its salt content and temperature. iii. Piezometric levels.
iv. Water levels.
v. Deformations or movements.
vi. Pressures.
vii. Loading conditions.
viii. Temperature variations within dams’ body; and
ix. Accelerations experienced by the dam during an earthquake.
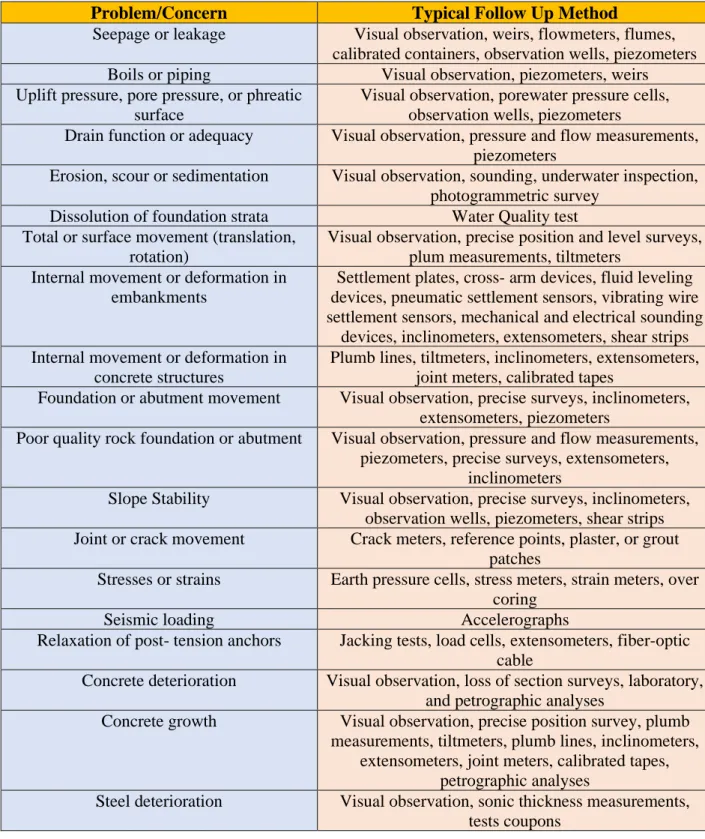
Some types of the instruments used are common for both concrete and earthfill dams; while others are restricted to only one type of them depending on the nature and type of the dam and the phenomenon to be observed and followed. Dam safety concerns to be checked by visual inspections and instrument measurement are given in Table 1 [1].
Table 1: Typical instrumentations and monitoring used in evaluating causes of common problems/concerns.
Problem/Concern Typical Follow Up Method
Seepage or leakage Visual observation, weirs, flowmeters, flumes,
calibrated containers, observation wells, piezometers
Boils or piping Visual observation, piezometers, weirs
Uplift pressure, pore pressure, or phreatic surface
Visual observation, porewater pressure cells, observation wells, piezometers
Drain function or adequacy Visual observation, pressure and flow measurements,
piezometers
Erosion, scour or sedimentation Visual observation, sounding, underwater inspection, photogrammetric survey
Dissolution of foundation strata Water Quality test
Total or surface movement (translation, rotation)
Visual observation, precise position and level surveys, plum measurements, tiltmeters
Internal movement or deformation in embankments
Settlement plates, cross- arm devices, fluid leveling devices, pneumatic settlement sensors, vibrating wire settlement sensors, mechanical and electrical sounding
devices, inclinometers, extensometers, shear strips Internal movement or deformation in
concrete structures
Plumb lines, tiltmeters, inclinometers, extensometers, joint meters, calibrated tapes
Foundation or abutment movement Visual observation, precise surveys, inclinometers, extensometers, piezometers
Poor quality rock foundation or abutment Visual observation, pressure and flow measurements, piezometers, precise surveys, extensometers,
inclinometers
Slope Stability Visual observation, precise surveys, inclinometers,
observation wells, piezometers, shear strips
Joint or crack movement Crack meters, reference points, plaster, or grout
patches
Stresses or strains Earth pressure cells, stress meters, strain meters, over coring
Seismic loading Accelerographs
Relaxation of post- tension anchors Jacking tests, load cells, extensometers, fiber-optic cable
Concrete deterioration Visual observation, loss of section surveys, laboratory, and petrographic analyses
Concrete growth Visual observation, precise position survey, plumb
measurements, tiltmeters, plumb lines, inclinometers, extensometers, joint meters, calibrated tapes,
petrographic analyses
Steel deterioration Visual observation, sonic thickness measurements,
3. Requirements for good instrumentation program
Instrumentation devices are used to supplement visual inspections in evaluating the performance and safety of dams. Any good instrumentation program should fulfill the following requirements if it is to have any meaning and to serve its purpose:
i) Instrumentation adequacy.
Instrumentation to monitor structural and functional performance should be installed in dams where complex or unusual site conditions have been encountered or where there is a high probability that failure could result in loss of life or extensive property damages. The adequacy of any instrumentation program is directly related to the size of the dam and its risk hazard classification. The installed instrumentation should be assessed from time to time by specialists to determine if it is sufficient to help evaluate the performance of the dam. When required, additional instrumentation should be installed to confirm suspicious trends or to explore an indicated potential adverse trend. At the same time instruments should be examined periodically for proper functioning.
ii) Observation of monitoring devices.
The instrumentation data should be collected by trained personnel who can recognize signs of problems and report them immediately to the higher technical level for further action. Observation data should be properly tabulated for record purposes or for immediate action if needed.
iii) Frequency of monitoring
Frequency of observation is normally governed by the following factors:
- Risk hazard classification of the dam under consideration. This is related to the dam height, impoundment size, the intensity of occupancy of the downstream and land use there,
- Seismic risk at the site. - Age or condition of the dam.
- Frequency and amount of water level fluctuation in the reservoir; and - History of problems or abnormal behavior at the dam.
Moreover, the frequency of instrument readings should be established at the time the instrumentation system is designed, which in its turn follows applicable regulatory requirements and other factors. Instructions to such frequency is to be specified in the O & M report of the project. But, any such specifications; however, may be changed by the dam safety inspection authority if unpredicted anomalies arise during operation.
Whenever necessary, more frequent readings, as often as hourly, daily, or weekly should be taken to monitor a suspected rapidly changing adverse condition. The frequency or number of readings may be reduced after the project has been in operation for an extended time and if performance observation data indicates that readings have stabilized.
iv) Data Analysis.
It is essential that instrumentation data be processed, reviewed, and assessed in a timely manner by specialists familiar with the design, construction, and operation of the project. Operation manuals and design information should be referred to in the evaluation of possible adverse trends. The performance observation data should be periodically analyzed to determine whether project structures are reacting as assumed in the design, and to detect behavioral conditions that may indicate the need for corrective action [2, 3].
4. Instruments data collection methods
Instrument data collection nowadays can be done in three well established methods depending on dam’s importance, complexity, and amount of observations needed in addition to available resources. The following is a brief discussion of the three general types of data collection currently in use.
i) Manual Data Collection
Manual collection methods include the use of weighted tapes, scales, calipers, survey rods, weirs, and other measurement devices which may be read manually. The measurements might also be made using electronic sensors with readout devices. These readout devices sometimes allow for digital storage of the readings which can be later downloaded to a computer in the office. In the office, the data may be graphed or tabulated for analysis and presentation. In addition, visual observations made during the data collection must be stored in a manner that allows for future reference and retrieval.
ii) Use of Stand-Alone Data Logging
Sometimes, readings are required to be collected at short time intervals, e.g. every 15 minutes, hourly or daily to meet monitoring objectives. Stand-alone data loggers are able to record data to built-in memory without a connected PC. In many cases a PC may be necessary to provide initial programming, but afterward the data logger operates independently. When recording stops, data recorded by stand-alone data loggers can be uploaded to a computer for analysis. These recordings can be very helpful in developing an understanding of how the dam responds to changing loading conditions such as reservoir level, rainfall, and air temperature. Readings from multiple instruments can be collected simultaneously so that different parameters can be directly compared. This can also be accomplished with manual readings, but depending on the size of the project, number of instruments, location of instruments, and frequency of readings, it is generally too labor intensive if readings are needed at an interval of more than once a day. Data loggers may also be a good alternative to manual readings for remote sites or for areas of difficult access, such as a dam gallery.
There are many different types of stand- alone data loggers manufactured nowadays that are battery- or solar-powered and environmentally hardened for direct field deployment. These units can be configured using a computer or handheld device
and then left in the field for unattended data collection. Also, regular visual observations should continue to be performed even if data is being collected frequently, as visual observations can often identify developing problems before an instrument registers a response.
If irregular readings are noted upon uploading the data, these should be immediately investigated, explained, and/or repeated. Also, periodic manual readings should be taken to verify the digital readings.
iii) Real-time Monitoring Networks
If both frequent unattended data collection and real-time display or notifications are required, then an automated data acquisition system (ADAS) may be the best option. Automated systems can also save labor and reduce the time for data evaluation by providing automated data retrieval from a remote location. The data is typically retrieved from the site periodically and automatically loaded into a database for presentation to the end user. Using programmable ADAS equipment data can be processed into engineering units, evaluated for alarm conditions, and displayed in real-time to operations and dam safety personnel. These displays can be customized to present the monitoring results in the format needed to make decisions. For operation personnel this may mean simple displays that show normal or alarm conditions. The interface for the dam safety personnel usually warrants a more comprehensive presentation for evaluation of short term trends, correlation relationships, alarm thresholds, statistical parameters, and geographic relationships. Although ADAS provides remote monitoring of the project, regular site visits are still required to perform the scheduled visual observations and system maintenance tasks.
There are two general system configurations that are used to automate the collection of performance monitoring data on dams:
a) Host-driven systems,
The host-driven system consists of a central intelligent host (master) device and remote units (slaves) that are pooled by the master unit to collect the instrument readings. Because the intelligence is primarily in the host device, the system performance relies heavily on maintaining stable uninterrupted communications. Examples of host driven systems are supervisory control and data acquisition (SCADA) systems and PC based systems.
b) Node-driven systems
This system is characterized by putting the intelligence at each node in the network. A node would be a location on the dam site that monitors a single instrument or a group of instruments but is physically separated from the other nodes. Each node is capable of stand- alone operation and can be programmed to collect data and make alarm notification decisions on its own.
Communications between the nodes can be accomplished by wide variety of wireless and hardwire methods. The best method will depend on site conditions, communication services available, and the real-time monitoring and notification needs of the project. The node-driven architecture is more commonly used for dam safety monitoring; because the instrumentation tends to be widely distributed around the project site and in locations where power is not readily available. If a node detects an alarm condition, then it can immediately communicate with the other nodes, but under normal conditions, communications are kept to a minimum. A properly designed node-driven system can also provide improved reliability. In the event of the loss of communications or equipment damage in the network, the other nodes will continue to function independently. For critical systems, it is also desirable to have multiple communication paths that can be utilized. The primary advantage of an ADAS is to allow for the near real-time collection and reduction of the instrumentation data so that dam operators and dam safety personnel can rapidly evaluate the conditions at the dam. A properly designed ADAS provides real-time remote notification of a significant change in the performance or conditions at the dam 24 hours a day, 7 days a week.
Field implementation of real time monitoring system and establishment of observatory for such purpose may be done by; the required sensors will be procured and deployed at the site nodes. Sensors having proper compatibility with the data acquisition systems and with adequate sensitivity and resolution will be selected. Also, sensors network with optimum spatial coverage, both on the ground and in the subsurface will be taken into consideration.
In a modern observation network information such as; actual displacements/ movements at different locations, stress, pore-water pressure, water seepage, rainfall and seismic parameters that may affect the stability of the embankment is being targeted. This is being done by combination of surface and sub-surface mounted monitoring sensors. Sub-surface sensors will include biaxial in-place inclinometers to be installed at different depths in the interfacial zones of different materials down the borehole to measure the sub-surface displacements/ movements, in addition to piezometers in the boreholes to measure the variation in pore water pressure. Also, borehole seismometers can be deployed to measure the seismic parameters in case of an earthquake. Depths of these sensors will be decided on the basis of borehole geological logging information.
All these surface and sub-surface sensors will be connected through wire to the specific nodes on the surface placed in close proximity to the sensors/boreholes. These nodes will communicate wirelessly with the gateway (i.e., automatic data acquisition system) placed in the site observatory. The gateway will store the data from different nodes of all the sensors and will upload the data on real time to the cloud for further processing through cloud-based software.
The proposed modern framework and architecture of wireless instrumentation and real-time monitoring scheme for earth dam are shown in Figures 1 and 2 [4].
Figure 1: Proposed simplified framework for wireless instrumentation and real-time monitoring of earthfill dam site.
Figure 2: Architecture of the Proposed wireless instrumentation and real- time monitoring model where S1, S2, S3, are the different sensors integrated
A properly designed and installed instrumentation and automated real time data acquisition system can provide cost effective and reliable information for both long term monitoring and assured safety aspects. Similar instrumentation and monitoring system also can be used for the dam abutments and reservoir rim.
Dam safety instrumentation monitoring challenges, whether for a fairly straightforward problems; such as organizing historical data or a more complex issue like synchronization of multiple automated and manually read data sources, can be surmounted. Advances in automated data collection and development of software for integrating geo-monitoring data offer solutions to these and many other instrumentation challenges.
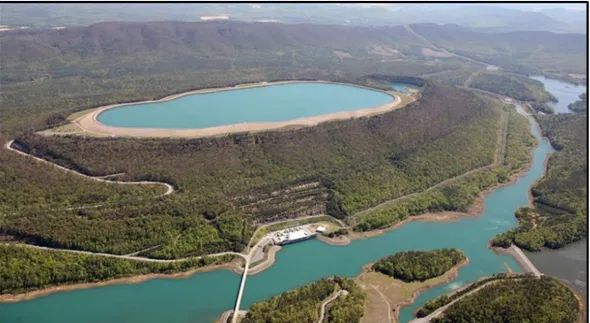
One example of using a combination of automated and manually read instrument that are synchronized into a single data management database platform is the OPC’s Rocky Mountain Hydroelectric Plant surveillance and monitoring plan. Integrated data management software allows OPC to quickly access charts and reports, set alarm notifications, and use templates to easily generate instrumentation reports [5]. The Rocky Mountain Hydroelectric Plant is a pumped-storage power plant located 10 miles northwest of Rome in the U.S., State of Georgia. It is named after Rocky Mountain on top of which the plant’s upper reservoir is located and it has an installed capacity of 1,095 megawatts, Figure 3 [6].
Figure 3: Rocky Mountain Hydroelectric Plant is a pumped-storage power plant.
The advantages and disadvantages of the various data collection methods are summarized and compared in Table 2 [7].
Table 2: Summary of data collection methods, advantages and disadvantages.
Data Collection Method Advantages Disadvantages
Manual Data Collection • Generally simple to
perform and do not require high level of expertise. • Personnel are already on
site for regular visual observations.
• Data quality can be
evaluated as it is collected.
• Labor intensive for data collection and reduction. • Not practical to collect frequent
data.
• Potential for errors in transporting\data from field sheets into management\ presentations tools.
• May be impractical for remote sites where personnel are not frequently on site.
Stand- alone Datalogging • Frequent and event driven data collection.
• Consistent data collection and electronic data handling.
• Equipment is fairly inexpensive and simple to set up.
• Require some expertise to configure data loggers.
• Data quality cannot be evaluated until it is collected from the field.
• Potential for lightning strikes. • Power source needs to be
considered. Real – time Monitoring
Networks
• Frequent and event driven data collection.
• Consistent data collection and electronic data handling.
• Real-time display and notifications (24\7). • Can remotely change the
monitoring frequency and data collection.
configurations as needed. • Allows for rapid
evaluation of monitoring results.
• Automation may encourage complacency if overall
monitoring program is not well defined or understood.
• Requires a higher level of expertise to install and maintain. • Higher cost of installation and
periodic maintenance. • The importance of frequent
routine visual inspections may be overlooked or discontinued somewhat due to the real- time presentation of readings. • Potential for lightning strikes. • Power source need to be
5. Types of measurements, their significance and used
Instruments
Types of instruments needed to follow changing conditions of any dam normally fall into many categories according to type of measurement performed. These categories are; water levels and water pressures measurements, seepage and leakage measurements, movement measurements, stress and strain measurements in addition to temperature and, seismic monitoring and measurements. The type of measurements, devices used, and methods applied are described in the following:
5.1 Water level and water pressure measurements
Reservoir and tail water elevations should be measured to provide a continuous historical record of these variables. Water levels in the reservoir and in downstream waterways have a direct influence on the quantities of seepage and leakage through a dam and its foundations and on uplift pressure on dam base. When the hydraulic head (the difference between upstream and downstream water levels) changes, then it may result in a significant change in seepage and leakage rates, but sudden changes in seepage quantities may indicate; however, a genuine problem in the foundation which needs to be investigated at once. This was proved in Mosul Dam (Iraq) where dissolution of gypsum in the foundation could be related to piezometric readings directly influenced by the upstream and downstream water levels. Such abrupt changes of the hydraulic head on the foundation was taken as indication of the opening of new dissolution seepage paths and formation of new cavities that required immediate injection of grouting materials [8].
Water levels and water pressures are interrelated. Measuring water level in the reservoir on a regular basis and recording this level at the time of each dam safety inspection is needed for several reasons. Recording water elevations in downstream tail water elevations is also important. These elevation data are used to interpret other instrumentation measurements, including the determination of uplift water pressure’s distribution beneath the dam. Uplift pressures and seepage rates are directly dependent upon the difference between reservoir and tail water elevations. Water levels may be measured by simple elevation gauges, such as fixed staff gauges, free standing, or fixed on permanent structures in the reservoir, Figures 4 and 5, [9, 10].
Figure 4: Water level staff gauge at Kovali Dam, and at Sultan reed fields, Kayseri, Turkey [9].
Measurements may be done also with more complex water-level sensing devices. For automated monitoring, a float and recorder, ultrasonic sensor, bubbler, or other similar instruments are used.
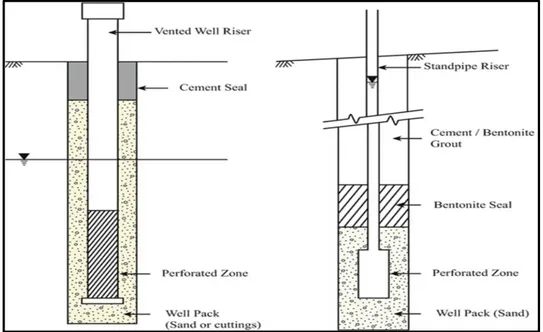
Observation wells and Piezometers can be used to measure water levels in dam’s body and surroundings. They are usually vertical pipes with a slotted section at the bottom or a tube with a porous tip at the bottom. They are typically installed in boreholes with a seal at the surface to prevent surface water from entering the borehole. The depth to the water level is measured by lowering an electronic probe or weighted tape into the pipe, Figure 6a. Observation wells are appropriate only in a uniform, pervious material. In a stratified material, observation wells create a hydraulic connection between strata. As a result, the water level in the well is an ambiguous combination of the water pressure and permeability in all strata penetrated by the borehole. Such observation data may lead to erroneous conclusions regarding actual water pressures within the dam and foundation. One variation to such wells to avoid this complication is to use piezometers of the type shown in Figure 6b where perforated zones can be used in the layers to be tapped and sealing materials are fixed to contain these layers between them [11].
Figure 6a: (Left) Simple Observation well. Figure 6b: (Right) is a Piezometer (Modified after [11]).
Another type is the twin-tube hydraulic piezometers, sometimes referred to as the Casagrande-type piezometers Figure 7. This type is used to detect, measure, and monitor water pressure in permeable soil or rock specifically at the installed depth of the measuring tip. Typically, a bentonite seal is installed immediately above and sometimes below the filter. One pair of tubes is installed where water pressure measurement with a vented filter is required to provide water inlet and outlet for internal flushing to clean the filter and to remove trapped air. The tubes are extended
more or less horizontally in trenches through the fill or foundation to a readout unit. The water level can be read by portable acoustic water level meter or automatically with a pressure transducer inserted in the standpipe or connected to the filter to form a closed-circuit piezometer [12].
The sensing zone (screened length or porous tip) of an observation wells and open standpipe piezometers is susceptible to clogging, which can increase lag time or result in failure of the instrument. This susceptibility can be diminished by a properly designed filter pack that meets filter criteria with the surrounding soil and properly sized perforations that are compatible with the filter pack. Open standpipe piezometers are the standard against which all other piezometers are judged. They are simple, reliable, inexpensive, and easy to monitor. The main shortcoming of open standpipe piezometers is the need for a discharge of water to or from the tube for it to adapt to pore pressure changes. Because of this, there is a noticeable time lag in recording the pores pressure changes if they occur quickly. Other types of Piezometers are the Pneumatic Piezometers, and the vibrating wire type [11].
Pneumatic piezometers consist of a porous filter connected to two tubes which have a flexible diaphragm between. The diaphragm is held closed by the external water pressure. The end of one of the tubes is attached to a dry air supply and a pressure gage. Air pressure is applied until it exceeds the external water pressure acting on the diaphragm, which deflects the diaphragm and allows the air to vent through the other tube. The air supply is shut off, and the external water pressure and internal pressure on the diaphragm equalize allowing the diaphragm to close. The residual internal air pressure is taken as the external water pressure. Alternatively, the water pressure can be taken as the air pressure required to maintain a constant flow through the tubes. Some constant flow types use a third tube connected to a pressure gage to measure pressure at the diaphragm rather than at the inlet to reduce potential errors and eliminate the need for individual calibration curves.
Typical pneumatic piezometer is shown in Figure 8, and a typical vibrating-wire strain gage piezometer is illustrated in Figure 9.
In Figure 9, a prestressed wire is attached to the midpoint of the diaphragm such that diaphragm deflections cause changes in wire tension. Consequently, a change in pore pressure deflects the diaphragm and changes the tension in the wire. The tension is measured by plucking the wire, using an electric coil, and measuring the frequency of its vibration. The wire vibrates in the magnetic field of a permanent magnet causing an alternating voltage to be induced inside the plucking coil. The frequency of the output voltage is identical to the frequency of the wire vibration and is transmitted to a frequency-counting device. A calibration curve or table is then used to calculate the pore pressure from the measured frequency change. Another variation of the electrical pore pressure cell piezometers is the bonded resistance strain gage piezometer, Figure 10. It has an electrical pressure transducer with a diaphragm in direct contact with pore water. Strains induced in the diaphragm by the pore pressure are sensed by strain gages, bonded to the diaphragm. Hence, the transducer output signal can be used as a direct measure of pore pressure.
Figure 8: Typical pneumatic piezometer [12].
Figure 9: Vibrating wire strain gage piezometer [12].
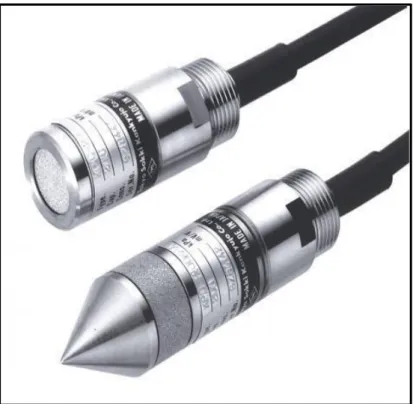
Electrical pore water pressure cells are used also for the same purpose; such as the vibrating-wire strain gage piezometer. Vibrating wire piezometers consist of a porous stone connected to a sealed metal chamber with a diaphragm adjacent to the stone. The diaphragm separates the pore water from the measuring system. Typical electric pore water pressure types of piezometers are shown in in Figure 11.
Figure 11: Typical pore pressure cells for electric type piezometers.
Time lag when pore water pressure changes i.e. the time required for water to flow to or from piezometers to effect equalization is called the hydrostatic time lag. It is dependent primarily on the permeability of the soil, the type and dimensions of the piezometer, and the magnitude of change in pore water pressure. Open standpipe piezometers have a much greater hydrostatic time lag than diaphragm piezometers because a greater movement of pore water is involved. The term "slow response time" is used to describe a long hydrostatic time lag [13].
5.2 Seepage and leakage measurement
Water-retention ability of any dam takes its importance not only from saving valuable stored water, but also from observing any threats to the stability of the dam caused by seepage or leakage through it or through its foundation. Seepage from a reservoir is the interstitial movement of water through a dam, the foundation, or the abutments. It is different from leakage, which is the flow of water through caverns and/or cracks. Seepage and leakage through a dam should not be large enough to erode material from inside the dam body. Such internal erosion can cause undermining or piping in embankment dams, and loss of material strength or density
in concrete and masonry dams.
Seepage and leakage are commonly measured with weirs, Parshall flumes, and calibrated containers. Other types of flow measuring devices such as flow meters may be appropriate in special circumstances. Geophysical surveys can be used to determine flow path and direction [14, 15, 16].
Quantity of seepage and/ or leakage from dam body or its foundation is directly proportional to the head difference on the dam and to the permeability of the material of the dam or the foundation. Variation of head difference is usual in the normal reservoir water fluctuation during operation which causes subsequent changes in seepage or leakage quantities. Any change in seepage and/or leakage volume not related to reservoir level must be evaluated immediately and significant or rapid changes in seepage and leakage related to the reservoir level should also be investigated. An increase in seepage and/or leakage may be an indication of piping. A decrease in seepage and/ or leakage may indicate clogged drains. A decrease in seepage may also indicate that seepage is increasing at a location other than that being measured, which could lead to piping. Cloudy or turbid seepage water can indicate piping. New seeps and/or leaks may also be indications of developing problems.
Another variable that affects the amount of seepage and/or leakage is the development of the steady-state phreatic surface in a newly constructed earthfill dam.
The steady-state phreatic surface development can take years, during which a gradual increase in seepage and/or leakage may occur. For dams on soluble rock foundations such as gypsum, karstified limestone or halite, seepage may increase with the progress of time due to dissolution of the rock. In such cases, steady increase in seepage may indicate developing problems, such problem was experience in Mosul Dam Project and represented severe threat to the stability of the Dam [8].
Water quality measurements can provide data on the source of seepage, or piping and on the dissolution of foundation rock. Common water quality measurements include; the pH value, temperature, conductivity, total dissolved solids, total suspended solids, and the variety of minerals present in seepage water such as sodium, potassium, carbonate, bicarbonate, sulfate, and chloride.
Devices used for seepage and leakage quantity measurements are weirs, Parshall flumes, calibrated containers. These are fairly standard in design and do not need much elaboration here. The reader may be referred to an excellent publication prepared by the United State Bureau of Reclamation in collaboration with the United Department of Agriculture for more details on these devices [17].
Dam safety investigation and periodic monitoring can also be done by variety of geophysical methods to establish source of any anomaly in dam’s behavior such as sudden increase in seepage quantity. Such methods can be performed by a many methods such as electromagnetic profiling, electrical resistivity tomography, self-potential method, use of ground penetration radar, seismic methods, temperature methods and Micro-Gravimetry [18].
5.3 Movement measurements
When evaluating the performance and safety of a dam, it is essential that movements be carefully watched. This is especially true for concrete and masonry dams where even small shifts in position can lead to grave consequences. Measurements of movements in concrete dams are made with several different instruments including plumb lines, inclinometers, extensometers, strain meters, and joint meters.
Instruments for the measurements of concrete dams properties including movements are given in Table 3 [19, 20].
Table 3: Concrete dam instruments and measurements (ASCE Guidelines) [20].
Property measured Measurement location Typical instrument
Alignment Crest, other locations of interest Total station, laser, geodimeter
Rotation Within Concrete Inclinometer
Within foundation Tiltmeter
Differential Movement
Across joint or crack Strain gauge, extensometer,
joint meter, crack meter
Within foundation Extensometer, tiltmeter
Water Pressure Uplift across base Piezometer, observation well
Within concrete Piezometer
At drains Pressure gauge
Stress and Strain Foundation Total pressure cell, load cell,
strain meter, flat jack
Within concrete Total pressure cell, strain meter
Internal Temperature Within concrete Thermocouple, RTD,
thermistor
Seepage Quantity Any location of interest Calibrated container, weir,
flume, flow meter
Seepage Quality Any location of interest Turbidity meter
Anchor Load Retention
Anchor head Load cell, jack and pressure
gauge, Earthquake Response Crest, free field or other
location of interest
Strong motion accelerometer
In embankment dams, the key movements to monitor include foundation and embankment settlement, and vertical and horizontal deformations within the embankment and its foundation. Embankment movement measuring instruments include settlement sensors, foundation baseplates, inclinometers, extensometers, surface points, and various survey instruments.
Movement can be divided into three types;
i) Surface movement: Which is the horizontal or vertical movement of a point on the surface of a structure relative to a fixed point outside the structure and it is usually determined by some type of surveying. Additionally, in concrete dams there is the rotational movement to account for;
ii) Internal movement: Which is the horizontal or vertical movement within the structure and it is usually determined relative to some point on the structure or in the foundation, and;
iii) Crack or joint movement: Which is the horizontal or vertical movement of one part of a structure relative to another part of a structure and it is usually measured across block joints or cracks in concrete structures or cracks in earth structures. iv) Movement can occur in any direction; therefore, measurements are made in
three mutually perpendicular directions which are vertical, transverse horizontal, and longitudinal horizontal directions. When movement in one or more of the three directions is found to be negligible, then measurement in those directions can be dropped.
Movements are direct result of external and/or internal loads. Embankments settle and spread over time as the result of consolidation and secondary settlement of the dam and foundation from self-weight. Embankments also deform due to external loads produced by reservoir water, rapid drawdown, earthquakes, undermining, swelling clays, and piping. Concrete structures deform due to internal loads such as pore water pressure, cooling, and alkali aggregate reaction of concrete, in addition to external loads caused by air and reservoir temperatures, solar radiation, reservoir levels, uplift pressure, wind, earthquakes, undermining, ice, overflowing water and foundation settlement.
Movements in response to such loads are normal and acceptable, provided they are within tolerable ranges and do not cause structural distress. Embankments are less brittle than concrete structures and can undergo larger movements without distress. As result, measurements of surface movements of embankment dams are typically less precise than those for concrete structures.
Sudden or unexpected change of direction, magnitude, or trend of surface movement could indicate developing problems in both types of dams. Therefore, internal movement and external measurements of both concrete and embankment dams and their foundations should be detailed and precise.
Surface movement is done by surveying methods. Survey points are constructed on the structure in such a way as to ensure observation of the three dimensional movements of dam parts. All observations are referred to stable bench marks fixed in the dam surrounding so that they are not subject to movement from freeze-thaw action or traffic.
Internal movement in embankments can be measured by variety of devices which are placed in embankment fill as filling proceeds. Such instruments are used for monitoring the changing distance between two or more points along a common axis without use of a movable probe. They are used for monitoring settlement, horizontal deformation, or strain. The range of such instruments includes:
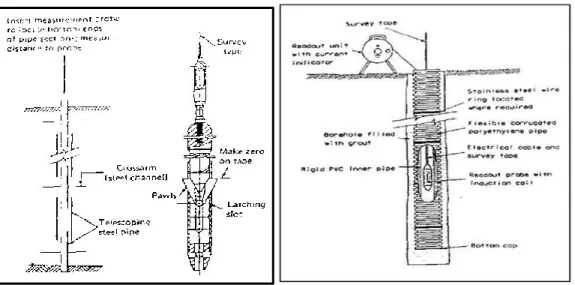
i. Probe extensometers used for monitoring vertical compression of the fill or foundation of embankments and they may be of the cross arm gauge type, mechanical probe, or induction coil gauge in Figure 12 or magnet/reed switch gauge, Figure 13.
ii. Monitoring of settlement, horizontal deformation or strain can be made also by; settlement platforms, Figure 13, buried plates, and gauges with electrical linear displacement transducers, Figure 14.
iii. Other types such as subsurface settlement points are used to measure consolidation settlement in the fill as illustrated in Figure 14.
iv. Fixed borehole extensometers may be used for monitoring the changing distance between two or more points along the axis of a borehole, without use of a movable probe and these are devices installed in boreholes in soil or rock,
Figure 15. v. Inclinometers are also installed which measure deformations parallel and
normal to the axis of a flexible pipe by means of a probe passing along the pipe, see Figure 15 [21].
In concrete dams, many types of instruments and devices are used. For internal movement measurements these include, plumb lines, extensometers, inclinometers, tiltmeters, strain meters, joint meters and plummets. For external movement measurements, surveying is done by collimation measurements, trilateration measurements with the use of many types of instruments and devices such as theodolites, stationary instrument piers and plates, fixed targets, electronic distant measuring techniques (EDM), precise levelling techniques, in addition to surface monitoring points and tiltmeters. Full description of the methods and the devices and their installation is covered in USBR manual on the instrumentation of concrete dams [22].
Figure 12: (Left) Crossarm gauge: (a) Schematic of pipe arrangement, and (b) measurement probe. (Right) Schematic of slope indicator extensometer
probe installed in a borehole.
Figure 13: (Left) Schematic of probe extensometer with magnet/reed switch
transducer, installed in a borehole. (Right) Typical settlement platform.
Figure 12: Crossarm gauge: (a) Schematic of pipe arrangement and (b) measurement prob
Figure 13:Schematic of slope indicator Probe extensometer installed in borehole Figure 13:Schematic of slope indicator Probe extensometer installed in borehole
Figure 14: (Left) Schematic of fixed embankment extensometer with
electrical linear displacement transducer. (Right) Schematic of spiral foot subsurface settlement point.
Figure 15: (Left) Operating principle of fixed borehole extensometer. (Right) Principle of inclinometer operation.
5.4 Stress and strain measurements
Actual stresses within a dam which result from external loads may not correspond always with those calculated in the design, so it is important to find actual stresses in a completed dam to verify design assumptions and to supply data for future design improvements.
Soil stresses within dams; however, cannot be determined directly but only indirectly by measuring the pressures in the structure or the reactions between the structure and supporting elements outside the structure. Such soil pressures can be measured directly by means of pressure cells [23].
Stresses are caused by the static loads acting on the dam which are weight of the dam, and earth and water loadings. Total pressure measuring cells are used to measure the actual stresses at selected locations, such as within the dam body, between a dam and its abutments or foundation, or between certain components of the dam.
Several types of devices are used to measure the static total pressure in a dam. Two main kinds of total stress measuring devices are in use: the embedded earth pressure cells and the contact earth pressure cells. Instruments of the first type are installed within the fill to determine the distribution, magnitude and direction of total stresses within an embankment, while the second type measures total stress against structures such as walls, culverts, spillways or rock abutments.
Commercially available earth pressure cells include the following types: pneumatic, hydraulic, vibrating-wire, bonded resistance strain gage, and unbonded resistance strain gage [24]. They consist of two flexible diaphragms sealed around the periphery, with a fluid in the annular space between the diaphragms. Pressure is determined by measuring the increase in fluid pressure behind the diaphragm with pneumatic or vibrating-wire sensors. Earth pressure cells should have similar stiffness as the surrounding soil to avoid inaccurate measurements of in-situ stress caused by arching. An example of the vibrating wire type is shown in Figure 16 [25].
Carlson-type earth pressure cells can also be used to measure pressure against structures. It consists of a chamber with a diaphragm on the end. Deflection of the diaphragm is measured by a Carlson-type transducer and is converted to stress. For concrete dams, the modulus of elasticity, creep coefficient, and the Poisson's ratio for concrete can be determined from the laboratory testing of concrete field cylinders’ cores. These values are needed to convert strain measurements to stress. Stress in concrete structures can be measured directly with total pressure cells or Carlson-type cells designed to have a stiffness similar to concrete.
A variety of mechanical and electrical strain gauges are used to measure strain in concrete structures. Some of the instruments are designed to be embedded in the dam during construction, and others are surface mounted following construction. Strain gages are often installed in groups so that the three-dimensional state of strain can be evaluated. One common instrument is the Carlson elastic wire instrument Figure 17.
Figure 17: Carlson stress meter (after Golzé 1977). (1) Internal late, (2) External plate, (3) Mercury film, (4) Stress being measured, (5) Compressible
material, (6) Steel bar, (7) Ceramic spool, (8) Glass insulated terminals, (9) Fabric cover, (10) Conductor cable [26].
This is a dual purpose instrument in which the main element is an elastic music wire coil. The instrument takes advantage of the fact that the electrical resistance of steel wire varies directly with the temperature. This instrument can also be used for measuring tensile stresses because the changes in the electric resistance of the wire are also in direct dependence on the tension in the wire.
The external pressure, acting on the plates, creates a corresponding pressure in the mercury, which causes deflection of the diaphragm towards the external side, by which there comes about an activation of the device for measuring strains. This consists of two threads of steel wire, placed on sheaves (pulleys), connected by a steel frame. The deflection of the diaphragm tensions the wire from one of the threads while loosening the other, in equal proportion. This instrument makes use of the fact that an increase in tension increases the frequency of vibration of the wire when plucked. The frequency is measured by use of a magnetic circuit. The measurements can be made by electrical readouts.
5.5 Temperature measurements
No temperature measurements are recommended for embankment dams. Proposed concrete gravity and arch dams should have an array of instruments to measure internal and surface temperatures along a transverse plane through the maximum section. In addition, concrete arch dams should have a string of instruments to measure reservoir temperature along the height of the maximum section Figure 18 [27].
Temperature measurements of a dam, foundation, ambient conditions are used to reduce data from other instruments, increase precision, or to interpret results. For example, movements of concrete dams and changes in leakage in concrete dams are often related to changes in temperature.
Temperature is also measured in concrete dams under construction to evaluate mix design, placement rates, and block and lift sizes; to time grouting of block joints; and to assess thermal loads.
During the operation of concrete dam, warm sunlight on the downstream face can create strain that may result in differential stress between the downstream face and the cooler upstream face that is mostly below water. Conversely, during winter the relatively warm water on the upstream face may cause differential stresses versus the downstream face that may be exposed to very cold air temperature.
Resistance thermometers or thermocouples can measure the temperatures of a dam, its foundation, and other instruments.
Resistant thermometers operate on the principle of changing resistant in a copper wire as the temperature changes. The instrument is read with a Wheatstone bridge type read out box. Figure 19 shows typical resistant thermometers used in USBR dams.
5.6 Seismic loads instrumentation
The main reason for seismic instrumentation of dams is monitoring their behavior when an earthquake occurs. Seismic instrumentation is used to record the responses of a structure, foundation, and abutments to seismic events. One of the specific applications of the acquired measurements is to furnish data to decide if the structure will continue to function as intended, and for the purpose of evaluating its behavior in such an event verifying design assumptions made for such case.
Major vibrations at a dam site could cause liquefaction of the foundation soils or the embankment, resulting in potential stability problems or the cracking of concrete slabs or other structures. The measurement of earthquake motion can help improve the designs of future dams, so that they can better resist earthquake effects, and help assess damage after significant earthquake occurrences. Because of the inability to predict exactly when or where earthquakes will occur, it is desirable to install instruments for most structures in areas of high earthquake incidence.
The general term, seismograph, refers to all types of seismic instruments that write a permanent, continuous record of earth motion. The basic components of a seismograph include a frame anchored to the ground, one or more transducers, timing devices, and a recorder. As the frame moves with the ground, the transducers respond according to the principles of dynamic equilibrium. Signals of horizontal motion in two planes and vertical motion may be sensed either electrically, optically, or mechanically. The motion sensed may be proportional to acceleration, velocity, or ground displacement. The variety of commercially available
instruments include the strong-motion accelerograph, peak recording
accelerograph, seismoscope and others.
The subject of seismic monitoring of dams, types of instruments used and the analysis of the seismic events recordings is very wide subject and it cannot be covered by a single paragraph, so it may be considered outside of the scope here, and may be treated separately in another work [28, 29].
Figure 18: (Left) Typical thermometers installation on a gravity dam [27]. (Right) Thermometer installation in an arch Dam [27].
Figure 19: Details of resistant thermometer [27].
6. Examples of design and performance of instrumentation
systems in existing dams
In order to show the importance of using instruments in monitoring of dam safety, the following examples are described from existing dams.
6.1 Tala dam: an example of concrete dams instrumentation
Tala Hydroelectric Project is a run of the river scheme, located on river Wangchu in South West Bhutan in Eastern Himalayas. It consists of high concrete gravity dam with peaking live storage capacity of 3.2 million cubic meters and an underground power station with total installed capacity of 1,020 MW, and complete with all other ancillary structures.
The dam is 92 m high from the deepest foundation with a crest length of 129.50 m and maximum base width of 114.25 m. It has seven concrete blocks with five sluice spillway, one overflow and non-over flow blocks. The sluice spillway is designed to pass standard project flood of 8,575 cumecs and PMF of about10,600 cumecs. Start of construction was on 1st October 1997 and the first unit was commissioned on 31 July, 2006. The project was executed by the Tala Hydroelectric Project Authority (THPA), a joint venture of the Government of India and the Royal
Government of Bhutan. Upstream and downstream views of the completed dam are shown in Figure 20 [30].
Figure 20: Upstream (Left) and downstream (Right) views of the completed dams [30].
The dam was highly instrumented, and the purposes of this instrumentation and monitoring were in general to maintain and improve safety by providing information to evaluate whether the structure was performing as expected and warn of any changes that could endanger its safety. The provided data were to accomplish the following:
i. Observe temperature development and effects in mass concrete. ii. Evaluate behavior during construction, filling and operation of the
structure.
iii. Verify design and analysis assumptions.
iv. Characterize site conditions before construction.
v. Observe performance of known geological and structural anomalies. vi. Evaluate performance with respect to potential site-specific failure modes. vii. Evaluate the dynamic response of the structure due to seismic loads.
Most of the instruments were embedded in blocks 2 and 5 which represent non-overflow and maximum over-flow sections of the dam, respectively, see Figures 21, 22, 23, 24.
Figure 21: Location of instruments in block 2 [30].
Figure 23: Location of Instruments in block 5 [30].
Figure 24: Nomenclature for Figure 23 [30].
Joint/crack meters were installed at construction joints. Multipoint borehole extensometers were installed at right and left abutments. Four numbers of strong motion accelerometers have been installed at different locations. The details of instruments being monitored during operation stage is shown in Table 4 [31].
Table 4: Types and numbers of installed instruments in Tala Dam [31].
Instruments Proposed Installed Working
1 Temperature meter 51 51 48
2 Vibrating Wire pore pressure meter
37 31 30
3 Vibrating Wire stress meter 21 21 20
4 Vibrating Wire strain meter 21 set
126
21 set 126
20 set 116
5 Uplift pressure pipe 20 18 13
6 Vibrating Wire Point Boreholes Extensometers
9 8 5
7 Vibrating Wire Crack/ Joint
meter
23 19 13
8 Normal Plumb Line(NPL) 2 2 2
9 Inverted Plumb Line(IPL) 1 1 1
10 Strong Motion Accelerometer 4 4 4
11 Vibrating Wire Water level
indicator
2 2 2
Totals 296 283 254
Total Non-Functional 29
The failed number of instruments represented 10% of the total number of installed instruments. Highest number of failures was in the vibrating wire crack/joint meters (6 failed out of 19) representing 47% of all such instruments, followed by the vibrating wire point boreholes extensometers (3 failed out of 8) representing 38 %. These high rate of failures may be due to errors in embedding and placing the instruments or due to damaged cables during construction work.
Total of 747 more instruments were installed to monitor the underground structures which were; the desilting chambers, head race tunnel, machine hall, transformer hall, bus ducts and passages, and the pressure shaft manifolds.
These instruments were vibrating wire load cells on rock bolts, vibrating wire load cells on ribs, vibrating wire Piezometers, vibrating wire instrumented bolts, multi-point borehole extensometer of the magnetic anchor type, multi-multi-point borehole extensometer of the mechanical groutable type, total station targets (sections), strain meter (mechanical), strain meter (electronics), and strain gauges.
The continuation of monitoring and analysis of the existing instruments during the operation has been carried out by an independent unit for “Quality Control” who reports to the “Management” directly. As a “Management” policy the instrumentation data and its analysis from safety point of view are reviewed every month in monthly “Progress Review Meetings”. As per the agreement signed with the National Institute of Rock Mechanics (NIRM), India, the monthly data is
submitted to them for their in-depth study. The experts of NIRM also visit the project site every quarter and submit the interim as well as Annual Reports.
6.2 Masjed- e- Suliman Dam: an example of an earthfill dam instrumentation
Masjed-e-Soleiman is a clay core rockfill dam on the Karun River in southwestern Iran. The Karun River rises in the Zagros Mountains in western Iran and flows southward to the Persian Gulf. Masjed-e-Soleiman Dam was the second dam on the Karun River which was completed in 2002. Another dam namely Shahid Abbaspour Dam had already been constructed in 1976. Other dams were built after 2002, which were Karun III (2005), Karun IV (2011), Upper Gotvand Dam (2011), location of the dam is illustrated in Figure 25 [32]. Iran Water and Power Resources Development Company has invited domestic and foreign companies to finance, build and operate Karun II Dam and Power Plant project back in 2017, and it can be assumed that this project is.
Karun II Dam and power station are still under construction [33]. The cascade of dams is shown in Figure 26 [35].
Figure 26: Karun River cascade development schemes [35].
Masjed-e-Soleiman project is a high head plant with a rated head of 145 m and a total capacity of 2,000 MW. The rockfill dam is sealed by a central clay core. The powerhouse is in an underground cavern 260 m long, 30 m wide and 50 m high. View of Masjed-e-Soleiman Dam is shown in the photograph of Figure 27 [36].
Figure 27: A view of Masjed-e-Soleiman Dam showing the rock fill dam and spillway [36].
The catchment area of Masjed-e-Soleiman reservoir is 27,550 km2. The reservoir has a total storage of 285 million m3 and a live storage of 90 million m3; between
elevations 363 (m a.s.l.) and 380 (m a.sl.). Peak flood inflows for the 1,000 year and 100 year floods are 9,300 m3/s and 6,800 m3/s, respectively. The purpose of the dam
is to provide river regulation and storage for hydropower generation. Clay core rockfill construction was favored because of the relative high seismicity of the area and the availability of suitable clay and rockfill materials nearby.
The dam comprises a rockfill embankment with clay core and upstream and downstream filters. The upstream slope of the dam is at 1V to 2H and incorporates a rockfill cofferdam with upstream clay membrane at its toe. The overall downstream slope is at 1V to 1.8H and incorporates an access roadway for construction. The clay core of the dam has a minimum width at the crest of 10m increasing in width by 0.4 m for every 1m below crest elevation. Each of the filters has a nominal width of 5 m.
Because of the importance of the dam and its size, it was heavily instrumented. The objectives of the instrumentation and monitoring systems were to confirm the design assumptions and predictions of performance at the construction phase, monitor performance of the embankment during the impounding of the reservoir, confirm safe operation through the life of the dam including the provision of early warning of the development of unsafe trends in behavior and to verify the safe aging of the structure. Typical section in the dam is shown in Figure 27a illustrating the instrumentation arrangement, and nomenclature is given in Figure 27b [35].
Figure 27a: Typical instrumentation arrangement at Masjed-e-Soleiman Dam [35].
Figure 27b: Key to instrumentation arrangement at Masjed-e-Soleiman Dam [35].
During construction of the embankment, significant number of the instruments were damaged or became inoperable. The reasons for the malfunctions included incorrect installation, damage by construction plant, use of incorrect equipment and faulty instruments. Table 5 sets out details of the instrumentation installed and their operational condition at impounding.
An analysis was carried out of the records of the foundation and core piezometers and earth pressure cells, but the reasons for their failure could not be established indicated from this analysis. Given that the instruments which had failed most were in the upstream shoulder and in the core, it was considered likely that the reason for loss of readings was due to damage of the connections from the instruments to the monitoring points on the downstream face. The cables and tubing had been laid in sand filled trench across the filter and at the transitions between core and filters and shoulder, moreover the cable had been ‘snaked’ in the trench to allow for drawing out due to differential settlement. It was concluded that the friction on the cabling or tubing as the fill continued was too great to allow any movement. This in turn led to high stresses in the cable or tubing and failure at the interfaces where differential settlement occurred.
Table 5: Operational instrumentation at the end of construction of Masjed-e-Soleiman Dam.
Type Location Installed
No. Operational No. Defective % Vibrating wire piezometers Foundation Core 14 6 57% Foundation D/S fill 5 4 20% Vibrating wire piezometers Dam Core 25 18 28% Pore pressure hydraulic type
Dam D/S fill 10 Unable to monitor
Standpipe piezometers Abutments/galleries 22 22
Casagrande piezometer DS toe 3 3 Groundwater observation holes Abutments 15 15
Earth pressure gauges Core 39 30 23%
DS/ fill 9 8 11%
Hydrostatic settlement gauge
DS/ fill 13 Unable to monitor
Settlement inclinometers Core 4 (519 m) 4 (340 m) 35% DS/fill 4 (288 m) 4 (263 m) 9% Earthquake accelerometers
Core crest 1/1 Installed Later
The reason for the failure of the settlement inclinometers was easier to determine when photographic records were studied and a failed section uncovered. The inclinometer tubes had been joined by use of an outer sleeve as per manufacturer’s instructions, but the installer had failed to leave a gap between the tube sections to allow for telescoping of the tubes under consolidation of the fill. Subsequent settlement caused buckling of the tubes at the joints, which meant that it was not possible to pass the probe down the tube.
It was concluded that whilst the instrumentation at Masjed-e-Soleiman Dam was consistent with current international practice, the number of instrument failures were significantly higher than would be normally expected. In particular, the failure of the vibrating wire piezometers, earth pressure gauges and settlement inclinometers, make thorough analysis of the embankment difficult. This demonstrated the importance of adopting good installation procedures.
Analyzing the instrumentation records analysis just before impounding the reservoir showed that the pore pressures within the core were just within acceptable limits, but were dissipating far slower than had originally been envisaged. Because of the possible risk of arching and hydro-fracture of the clay core, it was concluded that the impounding of the reservoir should only be made under strictly controlled conditions to prevent excess hydrostatic pressures in the upstream shoulder. The impounding was staged to allow dissipation of pore pressures in the core to ensure that at no stage would the hydrostatic pressure in the upstream shoulder exceeds the minimum effective stress in the core.
The instrumentation provided sufficient data to determine the behavior in terms of pore pressure and soil pressure, but there was no effective measurement of settlement/ consolidation of the fill due to the failure of the settlement inclinometers and the inability to use the hydrostatic settlement cells until after construction was complete. This was because the hydrostatic instruments required that the instrument houses would be constructed at or close to the elevation of the instruments [35]. One study was performed and published in September 2014 on the total stress and pore pressure development inside the core of Masjed-E-Soleiman Dam to evaluate the quality of measurements of the remaining functioning instruments using the GEOSTUDIO (2007) Finite Element Modeling (FEM) package. The instrumentation records of the dam were used and compared with the numerical simulation and analysis runs. The study consisted of an evaluation of the effective stress as well as settlement/consolidation analysis up until the end of construction. This study mainly focused on the behavior of the dam within the maximum cross section at chainage 00+260 at elevations 230, 270 (m a.s.l.) and 310 (m a.s.l.) during construction.
In order to verify the result of the analysis, the site measurements of Masjed-e Soleiman Dam, instruments were used and compared with the results of the Geostudio (2007) software. The analyses in terms of effective stress were combined with consolidation analysis. The numerical analysis results showed good agreement with the instruments data [37].

![Figure 4: Water level staff gauge at Kovali Dam, and at Sultan reed fields, Kayseri, Turkey [9]](https://thumb-eu.123doks.com/thumbv2/5dokorg/4426892.106508/13.813.108.715.107.440/figure-water-level-kovali-sultan-fields-kayseri-turkey.webp)
![Figure 7: Typical installation of twin-pipe Casagrande type piezometer [12].](https://thumb-eu.123doks.com/thumbv2/5dokorg/4426892.106508/15.813.240.595.445.879/figure-typical-installation-twin-pipe-casagrande-type-piezometer.webp)
![Figure 8: Typical pneumatic piezometer [12].](https://thumb-eu.123doks.com/thumbv2/5dokorg/4426892.106508/17.813.213.603.106.572/figure-typical-pneumatic-piezometer.webp)
![Figure 10: Bonded resistance strain gauge piezometer [12].](https://thumb-eu.123doks.com/thumbv2/5dokorg/4426892.106508/18.813.201.617.591.948/figure-bonded-resistance-strain-gauge-piezometer.webp)