Technical Bulletin
TB12-02 May, 2012
Ag
ricultural
Experiment Station
College of Agricultural Sciences Department of Soil and Crop Sciences
SUSTAINABLE DRYLAND AGROECOSYSTEMS
MANAGEMENT
i
2012
SUSTAINABLE DRYLAND AGROECOSYSTEMS MANAGEMENT
1N.C. Hansen
2, L.Sherrod
4, G.A. Peterson
2, D.G. Westfall
2, F.B. Peairs
3, D. Poss
8, T. Shaver
5K. Larson
6, D.L. Thompson
5, L.R. Ahuja
7, M.D. Koch
5, and C.B. Walker
5A Cooperative Project
of the
Colorado Agricultural Experiment Station
Department of Soil and Crop Sciences
Department of Bioagricultural Sciences and Pest Management
Colorado State University
Fort Collins, Colorado
and the
USDA - Agriculture Research Service
Natural Resources Research Center
Great Plains Systems Research Unit
Fort Collins, Colorado
1
Funding is provided by the Colorado Agricultural Experiment Station and USDA-ARS.
2
Professor/Associate Professor, Department of Soil and Crop Sciences, Colorado State
University, Fort Collins, CO 80523
3
Professor, Department of Bioagricultural Sciences and Pest Management, Colorado State
University, Fort Collins, CO 80523
4
USDA-ARS Soil Scientist–Agricultural Systems Research Unit, Fort Collins
5
Research Associates, Colorado State University
6
Research Scientist, Plainsman Research Center at Walsh, Colorado
7
USDA-ARS Research Leader - Great Plains Systems Research Unit
8
Former Research Associate, Colorado State University, presently Soil Scientist, USDA-ARS
Central Great Plains Research Station
**Mention of a trademark or proprietary product does not constitute endorsement by the Colorado Agricultural Experiment Station** Colorado State University is an equal opportunity/affirmative action institution and complies with all Federal and Colorado State laws, regulations, and executive orders regarding affirmative action requirements in all programs. T he Office of Equal Opportunity is located in 101 Student Services. In order to assist Colorado State University in meeting its affirmative action responsibilities, ethnic minorities, women, and other protected class members are encouraged to apply and to so identify themselves.
Contents
Subject
Pages
Project History
1-2
Introduction
3
Materials and Methods
4-10
Section A - Dryland Cropping Systems Production – 2006
Results and Discussion
Climate
11
Wheat
11-12
Corn and Sorghum
12-13
Proso millet
13
Forage crops and Barley for Grain
13
Nitrogen Content of Grain and Stover
13
Soil Moisture
13-14
Section B - Dryland Cropping Systems Production – 2007
Results and Discussion
Climate
14
Wheat
14-15
Corn and Sorghum
15-16
Proso millet
16
Summer crops
16
Nitrogen Content of Grain and Stover
16
Residual Soil Nitrate
16
Soil Moisture
16-17
References
17
Data Tables Section A- 2006
18-49
v
Table Title
Page
Table 1. Elevation, long-term average annual precipitation, and evaporation characteristics for each site.
4
Table 2a. Cropping systems for each of the original sites in 2006-2007.
18
Table 2b. Opportunity cropping history from 1985 to 2007 at the three original sites.
19
Table 2c. Cropping systems for the sites initiated in 1997 in the three new sites and in place from
2006-2007.
20
Table 3.Nitrogen fertilizer application by soil and crop for 2006.
21
Table 4a. Monthly precipitation for the original sites for the 2005-2006 growing season.
22
Table 4b. Monthly precipitation for the three new sites for the 2005-2006 growing season.
23
Table 5a. Precipitation by growing season segments for the Sterling site from 1987-2006.
24
Table 5b. Precipitation by growing season segment for the Stratton site from 1987 -2006.
25
Table 5c. Precipitation by growing season segment for the Walsh site from 1987-2006.
26
Table 6a. Precipitation by growing season segment for the Briggsdale site from 1999-2006.
27
Table 6b. Precipitation by growing season segment for the Akron site from 1997-2006.
27
Table 6c. Precipitation by growing season segment for the Lamar site from 1997-2006.
28
Table 7. Crop variety, seeding rate, and planting date for each site in 2005-2006.
29
Table 8. Grain and stover (straw) yields for wheat at Sterling, Stratton, and Walsh in 2006.
30
Table 9. Grain and stover (straw) yields for wheat at Briggsdale, Akron and Lamar in 2006.
31
Table 10. Grain and stover yields for corn and sorghum at Sterling, Stratton, and Walsh in 2006.
32
Table 11. Summer crop yields at Akron, Briggsdale, and Lamar in 2006.
33
Table 12. Grain and stover yields for millet at Sterling, Stratton and Walsh in 2006.
34
Table 13. Total nitrogen content of wheat grain at Sterling, Stratton, and Walsh in 2006.
35
Table 14. Total nitrogen content of wheat straw at Sterling, Stratton, and Walsh in 2006.
36
Table 15. Total nitrogen content of corn or sorghum grain at Sterling, Stratton, and Walsh in 2006.
37
Table 16. Total nitrogen content of corn or sorghum stover at Sterling, Stratton, and Walsh in 2006.
38
Table 17. Total nitrogen content of millet grain at Sterling, Stratton, and Walsh in 2006.
39
Table 18. Total nitrogen content of millet stover at Sterling, Stratton, and Walsh in 2006.
40
Table 19. Available soil water by soil depth of the WHEAT phase in the WCM rotation at Sterling,
Stratton, and Walsh in 2006.
41
Table 20. Available soil water by soil depth of the WHEAT phase in the WCF rotation at Sterling and
Stratton, and the WSF rotation at Walsh in 2006.
42
Table 21. Available soil water by soil depth of the WHEAT 1 phase in the WWCM rotation at Sterling
and Stratton, and the WWSM rotation at Walsh in 2006.
43
Table 22. Available soil water by soil depth of the WHEAT 2 phase in the WWCM rotation at Sterling
and Stratton, and the WWSM rotation at Walsh in 2006.
44
Table 23. Available soil water by soil depth of the CORN phase in the WCM rotation at Sterling,
Stratton, and Walsh in 2006.
45
Table 24. Available soil water by soil depth of the CORN phase in the WCF rotation at Sterling and
Stratton, and the Sorghum phase of the WSF rotation at Walsh in 2006.
46
Table 25. Available soil water by soil depth of the CORN phase in the WWCM rotation at Sterling and
Stratton, and the Sorghum phase of the WWSM rotation at Walsh in 2006.
47
Table 26. Available soil water by soil depth of the MILLET phase in the WCM rotation at Sterling,
Stratton, and Walsh in 2006.
48
Table 27. Nitrate-N content of the soil profile at planting for each crop during the 2005-2006 crop year.
49
Table 28. Nitrogen fertilizer application by soil and crop for 2007.
50
Table 29. Crop variety, seeding rate, and planting date for each site in the 2006-2007 season.
51
Table 30a. Monthly precipitation for the original sites for the 2006-2007 growing seasons.
52
Table 30b. Monthly precipitation for the three new sites for the 2006-2007 growing seasons.
53
Table 30c. Precipitation by growing season segments for Sterling from 1987-2007.
54
Table 30d. Precipitation by growing season segment for Stratton from 198 -2007.
55
Table 30e. Precipitation by growing season segment for Walsh from 1987-2007
56
Table 30f. Precipitation by growing season segment for Briggsdale from 1999-2007.
57
Table 30g. Precipitation by growing season segment for Akron from 1997-2007.
57
Table 30h. Precipitation by growing season segment for Lamar from 1997-2007.
58
Table 31. Grain and straw yields for wheat at Sterling, Stratton, and Walsh in 2007.
59
Table 32. Grain yields by rotation for wheat at Briggsdale, Akron, and Lamar in 2007.
60
Table 33. Grain and stover yields for corn/sorghum at Sterling, Stratton and Walsh in 2007.
61
Table 34. Grain and stover yields for millet at Sterling, Stratton, and Walsh in 2007.
62
Table 35. Akron, Briggsdale, and Lamar summer crop yields in 2007.
63
Table 36a.Total nitrogen content of wheat grain at Sterling, Stratton, and Walsh in the 2007 crop.
64
Table 36b. Total nitrogen content of wheat straw at Sterling, Stratton, and Walsh in the 2007 crop.
65
Table 37a.Total nitrogen content of corn and sorghum grain at Sterling, Stratton, and Walsh in the 2007
crop.
66
Table 37b. Total nitrogen content of corn and sorghum stover at Sterling, Stratton, and Walsh in the 2007
crop.
67
Table 38a. Total nitrogen content of millet grain at Sterling, Stratton, and Walsh in the 2007 crop.
68
Table 38b. Total nitrogen content of millet stover at Sterling, Stratton, and Walsh in the 2007 crop.
69
Table 39. Nitrate-N content of the soil profile at planting for each crop during 2006-2007 crop year.
70
Table 40. Available soil water by soil depth in the WHEAT phase of the WCF rotation at Sterling,
Stratton, and WSF at Walsh in 2007.
71
Table 41. Available soil water by soil depth in the WHEAT 1 phase of the WWCM rotation at Sterling,
Stratton, and WWSM at Walsh in 2007.
72
Table 42.Available soil water by soil depth in the WHEAT 2 phase of the WWCM rotation at Sterling,
Stratton, and WWSM at Walsh in 2007.
73
Table 43.Available soil water by soil depth of the WHEAT phase in the OPP rotation at Sterling and
Stratton, and CORN in the OPP rotation at Walsh in 2007.
74
Table 44. Available soil water by soil depth of the CORN phase in the WCM rotation at Sterling and
Stratton, and Sorghum in the WSM rotation at Walsh in 2007.
75
Table 45. Available soil water by soil depth of the CORN phase in the WCF rotation at Sterling and
Stratton, and the Sorghum in the WCF rotation at Walsh in 2007.
76
Table 46. Available soil water by soil depth of the CORN phase in the WWCM rotation at Sterling and
Stratton, and SORGHUM in the WWSM rotation at Walsh in 2007.
77
Table 47. Available soil water by soil depth of the MILLET phase in the WWCM rotation at Sterling and
Stratton, and the WWSM rotation at Walsh in 2007.
1
PROJECT HISTORY
The Dryland Agroecosystems Project was established in the fall of 1985 with the first
winter wheat and corn crops harvested in 1986.The long-term research objectives are to provide
producers with information that they can use to make management decisions under dryland
cropping conditions and to learn more about soil quality and carbon sequestration parameters as
impacted by intensive no-till dryland cropping systems in the semiarid environment of the west
central Great Plains. Grain yields, stover yields, crop residue amounts, soil water measurements,
and crop nutrient content have been reported annually in previously published technical bulletins.
This bulletin covers the 2006 and 2007 research results. Common introduction and materials and
methods sections are presented for the two years, while the production parameters mentioned
above are presented by year, in two sections identified as Section A (2006) and Section B (2007).
Results from past years have shown that cropping intensification, compared to traditional
stubble mulch tillage wheat fallow, is feasible and profitable in this environment if managed
under no-till or minimum-till systems. The cropping systems evaluated from 1986 to 1998
included intensive rotations like wheat-corn(sorghum)-fallow and
wheat-corn(sorghum)-millet-fallow with traditional wheat-wheat-corn(sorghum)-millet-fallow as the standard of comparison. The intense rotations of
wheat-corn(sorghum)-fallow and wheat-corn(sorghum)-millet- fallow more than doubled grain
water use efficiency relative to wheat-fallow. The increased soil water storage resulting from
adoption of no-till systems made cropping intensification possible. The deletion of summer
fallow, however, does increases the risk of water deficit for the following crop. The traditional
wheat-fallow system requires less management skill and poses less risk relative to the intensive
systems, but over time is less profitable. Government programs also affect management decisions
greatly, particularly where producers have developed a good wheat or corn yield base.
Based on our findings with the intensive systems from 1985 to 1997 (12 cropping
seasons), we altered the systems in 1998 to reduce the amount of fallow in our cropping systems.
We now consider the 3-year (wheat-corn(sorghum)- fallow) system as the standard of comparison.
These changes will be outlined later in this report. Unfortunately, shortly after we made these
changes the region was hit with a drought. Some of the more intensive cropping systems have not
been successful during the drought. Winter wheat planted after wheat or millet with no fallow
period has had a high rate of crop failure and/or low yields due to lack of soil moisture for seed
germination and/or inadequate stored soil moisture.
New Research Sites:
The dryland agroecosystems project established a linkage with the Department of
Bioagricultural Sciences and Pest Management in 1997. We started evaluating the interactions of
cropping systems with both pest and beneficial insects at three new experimental sites. The
additional sites at Briggsdale, Akron, and Lamar also allow us to test our most successful
intensive cropping systems at three new combinations of precipitation and evaporative demand
and enable us to study insect dynamics as influenced by cropping system. We want to determine
if the presence of multiple crops in the system will alter populations of beneficial insects and
provide new avenues of biological pest management of Russian Wheat Aphid in wheat as well as
insect pests in other crops. These results will be presented in a separate report.
Adoption of Intensive Cropping Systems:
increasing rate from 1990 until 2002, the first year of the recent drought. The drought that
started in fall 2001 had a devastating effect on dryland crop yields in 2002. Corn is one of the
principal crops grown in the more intensive systems; thus we can use its acreage as an index of
adoption rate by producers. Colorado Agricultural Statistic reported that there were only 55,000
acres of dryland corn harvested in 2002 (See table below) in Colorado. However, many
thousands of additional acres were planted and not harvested.
Dryland Corn Acreage in Eight Northeastern Colorado Counties and state total from 1971 to 2005.
Year Eight NE Counties* Total for State
Acres 1971-1988 21,200 23,700 1989 27,000 28,000 1990 26,000 26,000 1991 32,500 33,000 1992 48,500 50,000 1993 79,000 90,000 1994 92,500 100,000 1995 95,500 100,000 1996 104,000 110,000 1997 138,500 150,000 1998 191,000 240,000 1999 220,000 290,000 2000 198,000 340,000 2001 233,000 305,000 2002 50,000 55,000 2003 150,700 205,000 2004 183,700 325,000 2005 140,900 235,000 2006 164,500 235,000
annual dryland corn acreage statistics. So for 2006 and 2007 the state acreage of intensified
dryland cropping systems was approximately 900,000 acres. The average economic impact of
these systems is an increased return to land, labor, capital, and management of $14.85/acre
(Kann et al., 2002), under an “average” rainfall environment.
INTRODUCTION
Colorado agriculture is highly dependent on precipitation from both snow and rainfall. In
the dryland environment each unit of precipitation is critical to production. At Akron each
additional inch (25 mm) of water above the initial yield threshold translates into 4.5 bu/A of
dryland winter wheat (12 kg/ha/mm), consequently profit is highly related to water conservation
(Greb et al., 1974). These data point to the need for maximum precipitation use efficiency in this
semi-arid cropping environment and the importance of this project to producers.
The dryland cropping systems research project was established in 1985 to identify
systems that maximize efficient water use under dryland conditions in Eastern Colorado. A
more comprehensive justification for its initiation can be found in Peterson, et al. (1988). A
summary of our general understanding of the climate-soil-cropping systems interactions can be
found in a recent publication by Peterson and Westfall (2004).
The general objective of the project is to identify no-till dryland crop and soil
management systems that will maximize water use efficiency of the total annual precipitation
and economic return.
Specific objectives are to:
1. Determine if cropping sequences with fewer and/or shorter summer fallow periods are
feasible.
2. Quantify the relationships among climate (precipitation and evaporative demand), soil
type, and cropping sequences that involve fewer and/or shorter fallow periods.
3. Quantify the effects of long-term use of no-till management systems on soil structural
stability, micro-organisms and faunal populations, and the organic C, N, and P
content of the soil, all in conjunction with various crop sequences.
4. Identify cropping or management systems that will minimize soil erosion by crop
residue maintenance.
5. Develop a data base across climatic zones that will allow economic assessment of
entire management systems.
Peterson, et al. (1988) document details of the project in regard to the "start-up" period
and data from the 1986-87 crop year. Previous year’s results have been reported in CSU
Agricultural Experiment Station Technical Bulletins that are available at the following web site:
http://www.colostate.edu/Depts/aes/pubs_list.html
. Other publications related to this project
have been published by various graduate students, faculty, and postdoctoral students and are
listed in Appendix C.
MATERIALS AND METHODS
From 1986 -1997 we studied interactions of climate, soils and cropping systems at three
sites, located near Sterling, Stratton, and Walsh, in Eastern Colorado, that represent a gradient in
potential evapotranspiration (PET) (Fig. 1). Elevation, precipitation and evaporative demand are
shown in Table 1. All sites have long-term precipitation averages of approximately 14-17 inches
(400-450 mm), but increase in PET from north to south. Growing season open pan evaporation is
used as an index of PET.
Table 1.Elevation, long-term average annual precipitation, and evaporation characteristics
for each site.
Site
Elevation
Annual
Precipitation
1Growing Season Open Pan Evaporation2
De ficit (Pre cip. - Evap.) --Ft. (m) -- ---In. (mm) --- ---In. (mm) --- In. (mm) Briggsdale 4850 (1478) 13.7 (350) 61 (1550) - 48 (- 1220) Ste rling 4400 (1341) 17.4 (440) 63 (1600) - 45 (- 1140) Akron 4540 (1384) 16.0 (405) 63 (1600) - 47 (- 1185) Stratton 4380 (1335) 16.3 (415) 68 (1725) - 52 (- 1290) Lamar 3640 (1110) 14.7 (375) 76 (1925) - 62 (- 1555) W alsh 3720 (1134) 15.5 (395) 78 (1975) - 61 (- 1555) 1
Annual precipitation = 1961-1990 mean;
2Growing season = March - October
Each of the original three sites (Sterling, Stratton, and Walsh) was selected to represent a
catenary sequence of soils common to the geographic area. Textural profiles for each soil at each
location are shown in Figures 2a, 2b, and 2c. There are dramatic differences in soils across slope
position at a given site and from site to site. We will contrast the summit soils at the three sites to
illustrate how different the soils are. Each profile was
described by NRCS personnel in the
summer of 1991. Note first how the summit soils at the three sites differ in texture and
horizonation. The surface horizons of these three soils (Ap) present a range of textures from loam
at Sterling, to silt loam at Stratton, to sandy loam at Walsh. Obviously the water holding
capacities and infiltration rates differ. An examination of the horizons below the surface reveals
even more striking differences.
The summit soil profile at Sterling (Figure 2a) changes from a clay content of 21% at the
surface(Ap) to 31% in the 3-8" depth (Bt1) to a clay content of 38% in the layer between the
8-12" depth (Bt2). At the 8-12" depth the clay content drops abruptly to 27%. The water infiltration
in this soil is greatly reduced by this fine textured layer (Bt2). At about the 36" depth (2Bk3) there
is an abrupt change from 21% clay to 32% clay in addition to a marked increase in lime content.
The mixture of 32% clay and 45% sand with lime creates a partially cemented zone that is slowly
permeable to water, but relatively impermeable to roots. Profile plant available water holding
capacity is 9" in the upper 36 inches of the profile. This had limited crop production on this soil.
Sterling Summit Soil Profile
Horizon Depth; Inches
Ap Bt1 Bt2 Bt3 Bk1 Bk2 2Bk3 2Bk4 Clay = 21%; Sand= 45% Clay = 31%; Sand =33% Clay = 27%; Sand = 27% Clay = 22%; Sand =30% 0 12 24 36 48 60 72 Clay = 21%; Sand =43% Clay = 32%; Sand = 45% Clay = 23%; Sand =37% Clay = 38%; Sand=24% Partially cemented with lime
Sterling Sidelope Soil Profile
Horizon Depth; Inches
Ap1 Ap2 Bt Btk Bk1 2Bk2 2Bk3 2Bk4 Clay = 21% ; Sand= 54% Clay = 26% ; Sand =44% Clay = 28% ; Sand = 27% Clay = 22% ; Sand =36% 0 12 24 36 48 60 Clay = 9%; Sand =67% Clay = 3%; Sand = 79% Clay = 2%; Sand =86% Clay = 31% ; Sand=32%
Sterling Toeslope Soil Profile
Horizon Depth; Inches
Ap1 Ap2 Bt1 Bt2 Bk1 Bk2 2Bk3 2Bk4 Clay = 18%; Sand= 42% Clay = 20%; Sand =47% Clay = 25%; Sand = 40% Clay = 27%; Sand =30% 0 12 24 36 Clay = 20%; Sand =38% Clay = 24%; Sand=46%
Figure 2b.Soil profile textural characteristics for soils at the Stratton site.
Stratton Sideslope Soil Profile
Horizon Depth; InchesAp1 Ap2 Bt1 Bt2 Bk1 Bk2 2Bk3 3C1 Clay = 32%; Sand =29% Clay = 35%; Sand =21% Clay = 26%; Sand = 33% Clay = 16%; Sand =62% 0 12 24 36 48 60 72 Clay = 18%; Sand = 43% Clay = 20%; Sand = 72% Clay = 32%; Sand =29% Clay =28%; San d = 35% Clay = 20%; Sand = 41%
Stratton Toeslope Soil Profile
Horizon Depth; InchesAp AB1 AB2 AB3 Btb1 Btb2 Btb3 Clay = 23%; Sand =34% Clay = 18%; Sand = 42% Clay = 36%; Sand =24% 0 12 24 36 48 60 72 Clay = 28%; Sand = 28% Clay = 25%; Sand =23% Clay =22%; San d = 33% Clay = 26%; Sand = 25%
Stratton Summit Soil Profile
Horizon Depth; InchesAp Bt Btk Bk1 Bk2 Bk3 Clay = 34%; Sand =25% Clay = 36%; Sand =20% Clay = 25%; Sand = 29% Clay = 18%; Sand =35% 0 12 24 36 48 60 72 Clay = 21%; Sand = 27% Clay = 14%; Sand = 34%
Walsh Summit Soil Profile
Horizon Depth; Inches
Ap Bk1 Bk2 Bk3 Bk4 Btkb Clay = 14%; Sand =65% Clay = 18%; Sand =66% Clay = 17%; Sand = 68% Clay = 21%; Sand =56% 0 12 24 36 48 60 72 Clay =19%; Sand = 61% Clay = 40%; Sand = 6%
Walsh Sideslope Soil Profile
Horizon Depth; Inches
Ap BAk Btk Btkb1 Btkb2 Bkb1 Bkb2 Clay = 10%; Sand =72% Clay = 26%; Sand =30% Clay = 38%; Sand = 13% Clay = 36%; Sand =7% 0 12 24 36 48 60 72 Clay =37%; Sand = 10% Clay = 33%; Sand = 12% Clay = 20%; Sand = 57%
Walsh Toeslope Soil Profile
Horizon Depth; Inches
Ap AB Btb1 Btb2 Btbk Bkb1 Bkb2 Bkb3 Clay = 24%; Sand =38% Clay = 30%; Sand =30% Clay = 29%; Sand = 30% Clay = 32%; Sand =23% 0 12 24 36 Clay =31%; Sand = 28% Clay = 26%; Sand = 32%
Cropping Systems/Management
The cropping systems that were in place in 2006 and 2007at the original three
experimental sites (Sterling, Stratton and Walsh) are delineated in Table 2a. One of the cropping
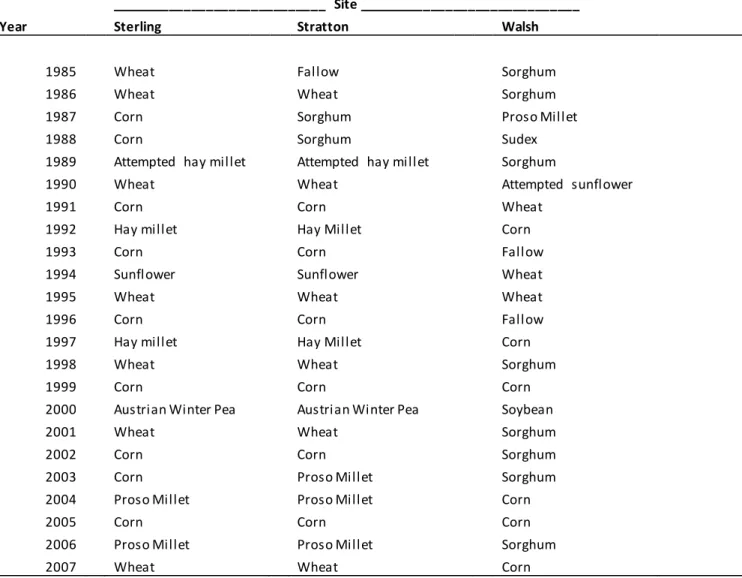
systems is “opportunity cropping”, which has the goal of producing a crop every year without
summer fallow. The crops grown in this system from the initiation date to 2005 are shown in
Table 2b. The cropping systems initiated in 1997 at the three new sites (Briggsdale, Akron, and
Lamar) are shown in Table 2c. The cultivars planted, planting rates, dates and harvest
information for each site are reported in Table 7 for 2006 and Table 29 for 2007.
Nitrogen fertilizer is applied annually in accordance with the NO
3-N content of the soil
profile (0-6 ft), soil organic matter content (0-6 in) before planting, and expected yield on each
soil position at each site. Therefore, N rate changes by year, crop grown, and soil position, if
needed. The N rates at Sterling, Stratton and Walsh for 2006 are given in Table 3 and for 2007
in Table 28. Nitrogen fertilizer for wheat, corn, and sunflower was dribbled on the soil surface
over the row at planting time at Sterling and Stratton. Zinc (1 lb/A) was applied to the corn with
the P fertilizer. Nitrogen on wheat at Walsh was topdressed in the spring, and N was sidedressed
on corn and sorghum. The N source was 32-0-0 solution of urea-ammonium nitrate. The same
procedures were used for fertilization at Briggsdale. However, at Lamar commercial applicators
or large plot equipment is used to apply the fertilizer at this location.
Phosphorus management is one of the experimental variables at Sterling, Stratton and
Walsh. Consequently, P (10-34-0) was applied at planting near the seed. Phosphorus is applied
on one-half of each corn and soybean plot over all soils, but applied to the entire wheat plot
when a particular rotation is in wheat. The rate of P is determined by the lowest soil test on the
catena, which is usually found on the sideslope position. This rate has been 20 lbs P
2O
5/A (9.5
kg/ha of P) at each site each year thus far. We changed the P fertilization treatment for wheat in
fall 1992, so that the half plot that had never received P fertilizer in previous years receives P in
the wheat phase of the rotation. This was required because low P availability was resulting in
poor wheat stand establishment and low yields. Other crops in the rotation only receive P on the
half plot designated as NP. Zinc (0.9 lbs/A) is banded near the seed at corn planting at Sterling,
Stratton, and Briggsdale to correct a soil Zn deficiency.
Yields, Nitrogen, and Available Soil Moisture
Grain yields were determined using a small plot research combine. The center section of
each treatment was harvested on each slope position. At maturity, meter row samples of each
crop were collected and processed to determine stover (straw) to grain ratio. The stover (straw)
and grain were processed and analyzed for total N using a combustion N analyzer.
Soil moisture measurements were taken at planting and harvest of each crop for each
treatment and slope positions
using the neutron-scatter technique. This timing also represents the
beginning and end of non-crop fallow periods. Galvanized metal conduit was used for neutron
probe
access tubes and were installed, two per soil position, in each treatment at the Sterling,
Stratton and Walsh sites. The access tubes were installed at the initiation of this study in 1987
and have not been moved since original installation. Available soil water and change over the
growing season was calculated based upon the available soil water holding capacity for each
treatment, depth and slope position.
SECTION A
2006
Results & Discussion
Climatic Data
Precipitation is the most limiting variable in dryland agriculture in Eastern Colorado.
The precipitation received during the last six months of a given year greatly influences crop yield
potential for the following crop year, especially spring planted crops. For the last half of 2005
Sterling only received 4.1 in of precipitation, which is about one-half the normal. At the Stratton
site the 2005 precipitation was normal at 8.6 in. The Walsh site was similar to Sterling in that it
received only 4.3 in, which is about one-half of the normal level (Table 4a).
Precipitation in the first six months of 2006 was well below the long-term normal
amounts at all three sites. Sterling only received 20% of the normal, while Stratton and Walsh
received about 70%
and 50% of the normal, respectively. Based on these precipitation
observations, yield potential for both fall planted and spring planted crops would be expected to
be reduced at all sites.
Precipitation in the last six months of 2006 exceeded the normal amounts at Sterling and
Walsh by 10 and 25%, respectively (Table 4a). Late season rainfall if stored in the soil provides
a good starting point for spring crops the following year. The Stratton site was about 30% below
the normal for this time period (Table 4a).
Precipitation patterns for the three newer sites are reported in Table 4b. Note that the
precipitation for the last half of 2005 was near normal for the Akron and Lamar sites, but
Briggsdale was at about 60% of the long-term normal amount. Precipitation in the first six
months of 2006 at Briggsdale was in even greater deficit, only 15% of the norm. Akron
remained near the normal for this period, but Lamar received only about 60% of the norm. The
last half of 2006 precipitation was about average at Akron but was exceptional at Lamar, where
it was double the normal amount for this period. Briggsdale remained dry relative to normal for
this period, receiving only 80% of the normal amount.
An overall view of the 18 month period precipitation that affected 2006 yield potentials
revealed that the Sterling, Stratton, and Walsh sites were only at about 60, 75, and 75% of the
normal for the period (Table 4a). At the northernmost of the newer sites, Briggsdale,
precipitation was 50% below the normal (Table 4b). At Akron and Lamar the amounts received
exceed the normal, especially at Lamar.
Precipitation received during the vegetative production stage (Sept-Mar) and the
reproductive stage for corn and wheat from 1987-2006 are shown in Tables 5a-c for Sterling,
Stratton, and Walsh. Similar data for the Briggsdale, Akron, and Lamar sites is shown in Tables
6a-c. We will refer to these data more extensively in the crop yield discussion section of the
bulletin.
during the reproductive period at Stratton decreased the yields relative to other years. Wheat
yields following fallow in the WCF and WSF systems were the highest at all sites, as would be
expected, because of the greater opportunity to store soil water.
Note that wheat yields on the summit and side slope soil positions at Sterling and Stratton
tended to be higher on the NP side. The NP side of the plot has received P for the life of the
experiment (Table 8). We apply P fertilizer at a rate of 20 lbs P
2O
5/A (9.5 kg/ha of P) at wheat
planting each year on both the N and NP sides of each plot. Originally P was only applied to the
side labeled NP. We changed the P fertilization treatment for wheat in fall 1992, so that the half
plot that had never received P fertilizer in previous years began receiving P
fertilizer at each
wheat planting event after that year. This change was necessary because low P availability was
resulting in poor wheat stand establishment and low yields. Other crops in the rotation only
receive P on the half plot designated as NP. This adjustment also permits us to measure the
residual P fertilizer effect on the yield of other crops.
Wheat yields at the three newer sites varied from relatively good at Lamar to below
average at Akron
and Briggsdale (Table 9). The yields are linked to the precipitation patterns
reported in Table 4b. The Akron site had near normal precipitation in the last half of 2005, and
thus good soil moisture for stand establishment. This site also had adequate spring precipitation
in 2006, but less than 45% of the normal June rainfall. Since June is the grain fill period, it is
likely that this deficit resulted in the lower than expected grain yields.
Wheat yields at the Briggsdale site were low because of below average precipitation from
pre-planting through grain fill. For example
,
in June this site only received 10% of the normal
rainfall. Even though wheat followed a summer fallow period in all rotations, the stored water
was inadequate to sustain normal yields.
Wheat yields at Lamar were near the average for this site. Normal precipitation levels in
late 2005 provided good soil moisture for stand establishment and the stored soil water was
apparently adequate to provide for the plants despite lower than average spring precipitation.
Rotation effects on wheat grain yield were not apparent, except that the most intense
rotations at Akron and Briggsdale yielded about half of the yield in the other rotations. The
reason is not obvious.
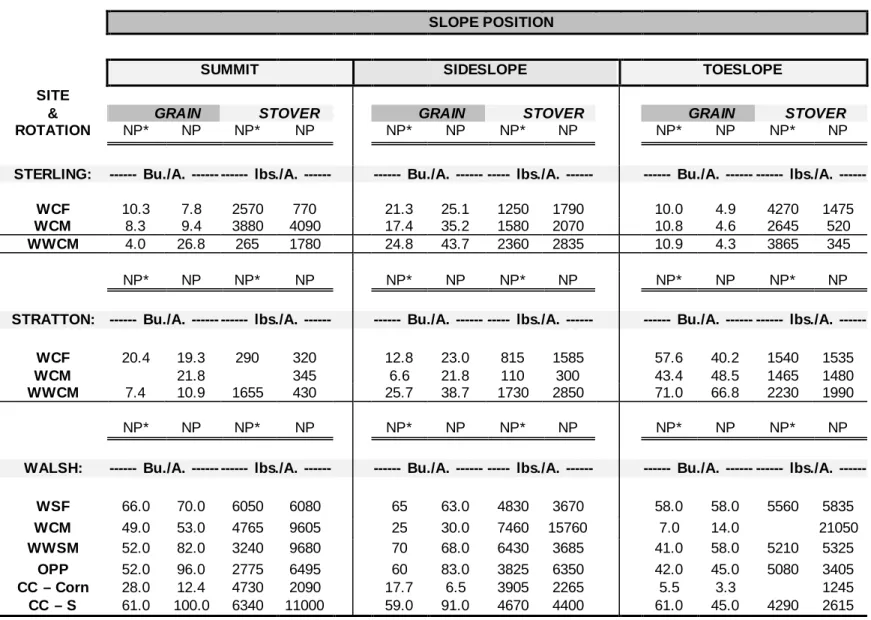
Corn/Sorghum Production
Corn yields at Sterling and Stratton were far below average in 2006, but sorghum yields
at Walsh were average to above average, especially on the summit and sideslope soil positions
(Table10).
Corn yields in Eastern CO are highly correlated to July and August precipitation
amounts (Nielsen et al. 1996), and according to the data in Table 4a it would seem that Sterling
corn yields should have been higher. However
,
June precipitation at the Sterling site was
essentially zero, and thus the corn plants were too drought damaged to recover. Corn yields at
Stratton also were well below the expected yield based on July and August precipitation (Table
4a). At this site June precipitation was slightly above average, and thus it is not obvious why the
yields were so low. The excellent grain sorghum yields at the Walsh site were attributable to the
35% above normal July and August precipitation (Table 4a). Plant population issues may have
contributed to the lower than expected sorghum yields at the toeslope position.
Corn yield responses to P fertilization occurred on the sideslope soil positions at both
Sterling and Stratton, but not at the summit position where soil P levels also are low. Soil test P
levels on the toeslope positions are in the high category and no response is expected in any year.
The lack of corn yield response on the summit positions probably indicates that the carryover
from the wheat P fertilization was adequate for the corn. Grain sorghum at Walsh responded to
P fertilization on summit and sideslope soil positions as would be expected from the low soil test
P levels. It also indicates that carryover from the P fertilization of the wheat did not meet the
plant demands. Grain sorghum on the toeslope seemed to respond to some degree, which is
surprising when soil test P levels on those soils are considered.
Corn yield and sorghum yields were not affected by rotation, which is as expected
because in all cases these crops follow a wheat crop and thus have the same soil moisture regime.
The exception was the continuous corn at the Walsh site, which had low yield on all soil
positions. Corn following corn leaves a very low soil water regime for the any spring crop that
might follow it in the rotation.
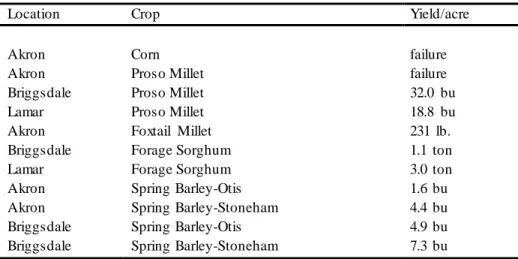
Akron was the only one of the three newer sites where corn was grown in 2006 and it was
a total failure (Table11). This was an unexpected because total July and August precipitation was
three in. above the long-term average amount.
Proso Millet
The proso millet at Sterling was sprayed out due to major weed problems and yields at
Stratton and Walsh were low (Table 12). The low yields are most likely due to lack of weed
control because summer precipitation was adequate at both sites (Table 4a). Proso millet at
Briggsdale and Lamar yielded 32 and 19 bu/A, respectively, which is respectable for those
climatic conditions (Table 11)..
Forage Crops and Barley for Grain
Forage sorghum was produced at the Briggsdale and Lamar sites, and yields were 1.1 and
3.0 T/A, respectively (Table 11). Spring barley was produced at the Akron and Briggsdale sites
in place of winter wheat. All barley grain yields were less than 8 bu/A at both sites, which was
regarded as a crop failure (Table 11). The dry conditions did not permit good stand
establishment.
Nitrogen Content of Grain and Stover (straw)
The N content of all grain and stover (straw) in all crops
is measured annually at the
Sterling, Stratton and Walsh sites (Tables 13-18). Wheat grain N content (Table13) ranged from
a low of 2.3 to a high of 3.2%, which is equivalent to grain protein contents of 13.1 to 18.2%.
Low wheat grain yields resulted in these higher than expected grain N (protein) levels. The low
grain yields also resulted in relatively high wheat straw N contents (Table 14).
Corn and sorghum grain N contents (Table 15) ranged from a low of 1.6 to a high of
2.3%, which is equivalent to grain protein contents of 10.1 to 14.5%. As with the wheat crop the
low corn grain yields at Sterling and Stratton contributed to the higher than normal grain N
crop in one foot depth increments at the Sterling, Stratton, and Walsh sites to a depth of six feet
or to bedrock in the case of the shallower soils. Soil moisture data for 2006 are presented in
Tables 19-26. The total amount water used by a given crop can be estimated by adding the
change in soil water content between planting and harvesting to the amount of precipitation
received during the growing season. Since we have no measure of how much of the precipitation
infiltrates, the crop water use with this method is an estimate.
SECTION B
2007 Results & Discussion
Climatic Data
The precipitation received during the last six months of a given year greatly influences
crop yield potential for the following crop year, especially spring planted crops. For the last half
of 2006 the Sterling site received slightly more rainfall than normal, but it was concentrated in
the summer months and rainfall from October through December was well below normal. At
the Stratton site the 2006 precipitation was only 63% of the normal and the late fall amounts
were essentially zero. At the Walsh site the last half of 2006 received 30% more than normal
(Table 30a).
Precipitation in the first six months of 2007 was below the long-term normal amounts at
all three sites. Sterling and Stratton received 75 and 85% of the normal, respectively, but the
Walsh only received 25% of the normal.
Precipitation in the last six months of 2007, which is the most influential on yield
potential of spring planted crops, exceeded the normal amounts at Sterling by 30%. However, at
the Stratton and Walsh sites the last half of 2007 precipitation amounts were 60 and 17% of
normal, respectively (Table 30a).
Precipitation patterns for the three newer sites are reported in Table 30b. Precipitation in
the last half of 2006 exceeded the normal amounts the Akron and Lamar sites, but Briggsdale
received only about 75% of the long-term normal amount. Precipitation in the first six months of
2007 was below normal at all three sites; 70, 90, and 60% of the normal amounts for Briggsdale,
Akron, and Lamar, respectively. Precipitation in the last half of 2007 was
about average at
Akron, but was about 78% of normal at Briggsdale and only 55% at Lamar.
In general the 18 month period precipitation that affected 2007 yield potentials was near
normal at the Sterling and Akron sites, above normal at Lamar, and well below normal at the
Briggsdale, Stratton, and Walsh sites.
Precipitation received during the vegetative production stage (Sept-Mar) and the
reproductive stage for corn and wheat from 1987-2007 are shown in Tables 30c-e for Sterling,
Stratton, and Walsh. Similar data for the Briggsdale, Akron, and Lamar sites is shown in Tables
30f-h. We will refer to these data more extensively in the crop yield discussion section of the
bulletin.
Wheat production
Wheat production at Sterling and Stratton in 2007 was greater than in 2006 (Table 31),
which was attributable to improved moisture conditions at wheat planting (Table 30a) and
excellent precipitation during the reproductive period (Tables 30c and 30d). Yields after fallow
in the WCF rotation at these sites were near the long-term averages except for the toeslope
position at Stratton, which usually yields above 70 bu/A. Wheat yields at Walsh were about 15
precipitation during the reproductive stage was below normal (Table 30e).
Rotation had a noticeable effect on wheat yields at the Sterling site (Table 31). Wheat
grain yields in rotations without fallow were noticeably less than WCF. The
exception was the
yield of wheat following wheat in the WW2CM rotation, which yielded almost as much as wheat
after fallow (Table 31). The probable reason for this occurrence was that the first year wheat
(W1) yield in 2006 was low, and thus it was almost like a fallow treatment. At the Stratton site
rotation had less effect on wheat yield, and in fact with adequate P fertilizer there was little yield
reduction. At the Walsh site yields were about the same no matter the rotation.
Wheat yields on the side slope soil positions at Sterling and Stratton tended to be higher
on the NP side (Table 31). There were no measureable yield differences at the Walsh site due to
P fertilizer treatment. As a reminder, the NP side of the plot has received P for the life of the
experiment (Table 8). We apply P fertilizer at a rate of 20 lbs P
2O
5/A (9.5 kg/ha of P) at wheat
planting each year on both the N and NP sides of each plot. Originally P was only applied to the
side labeled NP. We changed the P fertilization treatment for wheat in fall 1992, so that the half
plot that had never received P fertilizer in previous years began receiving P fertilizer whenever
wheat is planted in that plot. This change was necessary because low P availability was resulting
in poor wheat stand establishment and low yields. Other crops in the rotation only receive P on
the half plot designated as NP. This adjustment also permits us to measure the residual P
fertilizer effect on the yield of other crops.
Wheat yields at the Briggsdale, Akron, and Lamar sites also were higher, relative to 2006
(Table 32). Yields at Briggsdale averaged over 35 bu/A, which for this very water limited site,
was excellent. Surface soil water contents at field capacity at planting and above average May
rainfall probably were responsible for the good yields (Table 30b). Yields at Akron, were not as
good as can be expected at this site, and the reason for this is unknown because the rainfall
during the reproductive stage was near normal. The Lamar site wheat yields were excellent,
especially with the Hatcher variety, which averaged 48 bu/A. The high yield was attributable to
field capacity water content in the surface soil at planting and the above average May
precipitation (Table 30b).
Rotation effects were observable at the Akron site where the longer summer fallow
period of the WF rotation produced the highest yield (Table 30b). At the Briggsdale and Lamar
sites the rotation effects were more subtle. In fact at Briggsdale the rotations with less summer
fallow time had the highest yields. Reasons for the anomalies related to rotation at Briggsdale
and Lamar are not obvious.
Corn/Sorghum
Corn and sorghum yields at the Sterling, Stratton, and Walsh sites were near the
long-term means for these sites (Table 33). Precipitation during the corn reproductive period at
Sorghum yields at Walsh (Table 33) were lower than normally expected for this site, but
given the very low June, July, and August rainfall levels (Table 30a), the yields were respectable.
Neither soil position nor rotation appeared to affect sorghum yields. However continuous
cropping treatments did yield less than sorghum in set rotations like WSF.
The only one of the three newer sites that had corn or grain sorghum in 2007 was Akron
and the corn crop was a total failure in 2007 (Table 35).
Proso Millet
Proso millet yields at the Sterling site were in the expected range, but yields at Stratton
were much lower than expected (Table 34). At Walsh the millet crop was considered a complete
failure. Both the Stratton and Walsh sites were water stressed in the summer of 2007, but given
the yield levels of corn and sorghum, the low millet yields were not anticipated.
Proso millet was also grown at the three newer sites. The crop failed at Akron, yielded
about 6 bu/A at Briggsdale, and about 20 bu/A at Lamar (Table 35). The reason for the crop
failure at Akron and low yield at Briggsdale was not due to lack of precipitation at those sites
because the Lamar site received even less summer rainfall and yet yielded relatively well. With
the data available we have no explanation for the low yields at these sites.
Summer Crops
In addition to wheat, corn and millet the crop rotations at the Akron, Briggsdale, and
Lamar sites included triticale for forage, foxtail millet for forage, forage sorghum, and spring
barley. The yields for each of these crops are reported in table 35. Note that in all cases the
crops grown for forage yielded relatively well. Spring barley, grown as a substitute for wheat,
produced 35 to 40 bu/A at the Akron site, but yielded less than 5 bu/A at Briggsdale.
Nitrogen Content of Grain and Stover (straw)
The N content of all grain and stover (straw) in all crops is measured annually at the
Sterling, Stratton and Walsh sites (Tables 36a-38b). Wheat grain N content (Table 36a) ranged
from a low of 1.7 to a high of 3.0%, which is equivalent to grain protein contents of 9.7 and
17.1%. The lower grain N contents were associated with the higher wheat grain yields. For
example the lowest N contents occurred at the Walsh site (Table 36a), which had the highest
wheat grain yields (Table31). Wheat straw N contents reported in Table 36b were inversely
related to grain N content as would be expected. Lower grain yields resulted in higher grain N
contents and lower straw N contents.
Corn and sorghum grain N contents (Table 15) ranged from a low of 1.5 to a high of
2.2% (Table 37a), which is equivalent to grain protein contents of 9.45 to 13.9%. Stover N
contents ranged from 0.95 to 2.27% (Table 37b).
Millet grain N contents are only reported for the Sterling site, where they averaged about
2.3%, which is equivalent to 14.5% protein (Table 38a). Millet stover N contents averaged about
1.75% (Table 38b).
Residual Soil Nitrate
Residual soil nitrate levels before planting wheat and corn and sorghum at Sterling,
Stratton, and Walsh are reported in Table
39. The residual soil N levels for the wheat crop
ranged from 30 to 200 kg N/ha in the soil profile across all sites and slope positions. Residual
levels prior to corn and sorghum planting ranged from 25 to 140 kg N/ha in the soil profile
across all sites and slope positions. Residual levels prior to proso millet planting ranged from 15
to 205 kg N/ha in the soil profile across all sites and slope positions. Residual N levels did not
appear to be related to soil position or crop grown previously.
Soil Moisture
Available soil moisture contents are measured annually at planting and harvest of each
crop in one foot depth increments at the Sterling, Stratton, and Walsh sites to a depth of six feet
or to bedrock in the case of the shallower soils. Soil moisture data for 2007 are presented in
Tables 40-47. The total amount water used by a given crop can be calculated by adding the
change in soil water content between planting and harvesting to the amount of precipitation
received during the growing season.
REFERENCES
Greb, B.W., D.E. Smika, N.P. Woodruff, and C.J. Whitfield. 1974. Summer fallow in the Central
Great Plains. In: Summer Fallow in the Western United States. ARS-USDA. Conservation
Research Report No. 17.
Kaan, D.A., D.M. O’Brien, P.A. Burgener, G.A. Peterson, and D.G, Westfall, D.G. 2002. An
economic evaluation of alternative crop rotations compared to wheat-fallow in Northeastern
Colorado. Tech. Bull. TB02-1. Agric. Exp. Stn., Colo. State Univ., Fort Collins, CO.
Nielsen, D., G.A. Peterson, R. Anderson, V. Ferreira, W. Shawcroft, and K. Remington. 1996.
Estimating corn yields from precipitation records. Conservation Tillage Fact Sheet 2-96.
USDA/ARS and USDA/NRCS. Akron, CO.
Peterson, G.A. and D.G. Westfall. 2004. Managing precipitation use in sustainable dryland
agroecosystems. Ann. Appl. Biol. 144:127-138.
Table 2a. Cropping systems for each of the original sites in 2005-2006 and 2006-2007 cropping year. Site Rotations Sterling 1) Wheat-Corn-Fallow (WCF) 2) Wheat-Corn-Millet (WCM) 3) Wheat1-Wheat2-Corn-Millet (WWCM) 4) Opportunity Cropping* 5) Perennial Grass Stratton 1) Wheat-Corn-Fallow (WCF) 2) Wheat-Corn-Millet (WCM) 3) Wheat1-Wheat2-Corn-Millet (WWCM) 4) Opportunity Cropping* 5) Perennial Grass Walsh 1) Wheat-Corn-Fallow (WSF) 2) Wheat-Corn-Millet (WCB) 3) Wheat1-Wheat2-Corn-Mung Bean (WWCB) 4) Opportunity Cropping* 5) Perennial Grass 6) Continuous Row Crop (Alternate corn & sorghum) *Opportunity cropping is designed to be continuous cropping without fallow, but not monoculture. See Table 2b for specific crops present each year.
Table 2b. Opportunity cropping history from 1985 to 2007 at the original dryland sites. _____________________________ Site ______________________________
Year Sterling Stratton Walsh
1985 Wheat Fallow Sorghum 1986 Wheat Wheat Sorghum 1987 Corn
Sorghum Proso Millet 1988 Corn
Sorghum Sudex
1989 Attempted hay millet Attempted hay millet Sorghum 1990 Wheat
Wheat Attempted sunflower 1991 Corn
Corn Wheat
1992 Hay millet Hay Millet Corn
1993 Corn
Corn Fallow
1994 Sunflower Sunflower Wheat
1995 Wheat
Wheat Wheat
1996 Corn
Corn Fallow
1997 Hay millet Hay Millet Corn
1998 Wheat
Wheat Sorghum
1999 Corn
Corn Corn
2000 Austrian Winter Pea Austrian Winter Pea Soybean 2001 Wheat
Wheat Sorghum
2002 Corn
Corn Sorghum
2003 Corn
Proso Millet Sorghum
2004 Proso Millet Proso Millet Corn
2005 Corn
Corn Corn
2006 Proso Millet Proso Millet Sorghum
Table 2c. Cropping systems in 2005-2006 for the Briggsdale, Akron, and Lamar Sites. Site Rotations Briggsdale 1) Wheat-Fallow (WF) 2) Wheat-Hay Millet-Fallow (WMF) 3) Wheat-Corn-Fallow (WCF) 4) Barley-Triticale-Millet (BTM) 5) Opportunity (Fallowed in 2006) Akron 1) Wheat-Fallow (WF)
2) Wheat-Millet (Proso)-Flex (W-M-Flex) 3) Triticale/Pea-Foxtail Millet - Flex (T/P-M-Flex) 4) Wheat-Barley-Corn-Flex (WBCF)
Lamar 1) Wheat-Fallow (WF)
2( Wheat-Sorghum (Forage)-Fallow (WSF) 3) Wheat-Millet-Fallow (WMF)
Table 3. Nitrogen fertilizer application by soil and crop for 2006.
ROTATION
SITE SOIL CROP W'WCM WW'CM WCM WCF OPP
Sterling Summit Wheat 60 lb. 60 lb. 60 lb. 60 lb. - Sideslope " 60 lb. 60 lb. 60 lb. 60 lb. - Toeslope " 60 lb. 60 lb. 60 lb. 60 lb. - Summit Corn 75 lb. 75 lb. 75 lb. 75 lb. - Sideslope " 75 lb. 75 lb. 75 lb. 75 lb. - Toeslope " 75 lb. 75 lb. 75 lb. 75 lb. - Summit Millet 40 lb. 40 lb. 40 lb. - 40 lb. Sideslope " 40 lb. 40 lb. 40 lb. - 40 lb. Toeslope " 40 lb. 40 lb. 40 lb. - 40 lb. W'WCM WW'CM WCM WCF OPP
Stratton Summit Wheat 60 lb. 60 lb. 60 lb. 60 lb. - Sideslope " 60 lb. 60 lb. 60 lb. 60 lb. - Toeslope " 60 lb. 60 lb. 60 lb. 60 lb. - Summit Corn 75 lb. 75 lb. 75 lb. 75 lb. - Sideslope " 75 lb. 75 lb. 75 lb. 75 lb. - Toeslope " 75 lb. 75 lb. 75 lb. 75 lb. - Summit Millet 40 lb. 40 lb. 40 lb. - 40 lb. Sideslope " 40 lb. 40 lb. 40 lb. - 40 lb. Toeslope " 40 lb. 40 lb. 40 lb. - 40 lb. CONT. WWSM WSM WSF WCM CROP
Walsh Summit Wheat 6 lb. 6 lb. 6 lb. 6 lb. - Sideslope " 6 lb. 6 lb. 6 lb. 6 lb. - Toeslope " 6 lb. 6 lb. 6 lb. 6 lb. - Summit Sorghum 6 lb. 6 lb. 6 lb. - 6 lb. Sideslope " 6 lb. 6 lb. 6 lb. - 6 lb. Toeslope " 6 lb. 6 lb. 6 lb. - 6 lb. Summit Corn - - - 6 lb. - Sideslope " - - - 6 lb. - Toeslope " - - - 6 lb. -
Table 4a. Monthly precipitation for the original sites for the 2005 - 2006 growing season.
MONTH LOCATION
STERLING STRATTON WALSH
Inches Inches Inches Inches Inches Inches
2005 2005 Normals1 2005 Normals1 2005 Normals1
JULY 0.50 3.23 1.20 2.80 1.20 2.62 AUGUST 1.50 1.90 3.50 2.60 1.30 1.96 SEPTEMBER 0.20 1.04 0.00 1.45 0.20 1.74 OCTOBER 1.30 0.76 3.60 0.85 1.50 0.89 NOVEMBER 0.60 0.50 0.30 0.62 0.10 0.53 DECEMBER 0.00 0.40 0.00 0.28 0.00 0.31 SUBTOTAL 4.10 7.83 8.60 8.60 4.30 8.05
Inches Inches Inches Inches Inches Inches
2006 2006 Normals1 2006 Normals1 2006 Normals1
JANUARY 0.32 0.33 0.22 0.28 0.25 0.27 FEBRUARY 0.03 0.33 0.01 0.30 0.00 0.28 MARCH 0.26 1.07 0.14 0.76 0.50 0.81 APRIL 0.32 1.60 0.56 1.23 0.67 1.15 MAY 0.93 3.27 1.42 2.70 1.22 2.69 JUNE 0.04 3.00 2.85 2.45 1.06 2.29 SUBTOTAL 1.90 9.60 5.20 7.72 3.70 7.49
Inches Inches Inches Inches Inches Inches
2006 2006 Normals1 2006 Normals1 2006 Normals1
JULY 1.95 3.23 1.93 2.80 2.30 2.62 AUGUST 3.33 1.90 1.56 2.60 3.94 1.96 SEPTEMBER 2.03 1.04 0.83 1.45 1.42 1.74 OCTOBER 1.01 0.76 1.14 0.85 1.79 0.89 NOVEMBER 0.01 0.50 0.01 0.62 0.00 0.53 DECEMBER 0.09 0.40 0.07 0.28 0.98 0.31 SUBTOTAL 8.42 7.83 5.54 8.60 10.43 8.05 YEAR TOTAL 10.32 17.43 10.74 16.32 14.13 15.54 18 MONTH TOTAL 14.42 25.26 19.34 24.92 18.43 23.59
Table 4b. Monthly precipitation for the three new sites for the 2005 - 2006 growing season.
MONTH LOCATION
BRIGGSDALE AKRON LAMAR
Inches Inches Inches Inches Inches Inches
2005 2005 Normals1 2005 Normals1 2005 Normals1
JULY 0.30 2.51 1.68 2.67 0.50 2.23 AUGUST 0.86 1.81 3.14 2.11 3.85 1.85 SEPTEMBER 0.32 1.28 0.13 1.24 0.35 1.32 OCTOBER 2.01 0.66 2.86 0.90 1.85 0.71 NOVEMBER 0.32 0.45 0.57 0.55 0.12 0.56 DECEMBER 0.00 0.27 0.09 0.40 0.04 0.40 SUBTOTAL 3.81 6.98 8.50 7.87 6.71 7.07
Inches Inches Inches Inches Inches Inches
2006 2006 Normals1 2006 Normals1 2006 Normals1
JANUARY 0.00 0.30 0.11 0.33 0.11 0.42 FEBRUARY 0.00 0.19 0.00 0.35 0.00 0.41 MARCH 0.44 0.78 0.35 0.84 0.35 0.90 APRIL 0.12 1.28 1.17 1.64 1.17 1.15 MAY 0.36 1.94 1.74 2.96 1.74 2.50 JUNE 0.16 2.07 1.01 2.47 1.01 2.18 SUBTOTAL 1.08 6.56 7.78 8.59 4.38 7.56
Inches Inches Inches Inches Inches Inches
2006 2006 Normals1 2006 Normals1 2006 Normals1
JULY 2.16 2.51 3.37 2.64 3.35 2.23 AUGUST 0.86 1.81 4.39 2.12 6.45 1.85 SEPTEMBER 1.97 1.28 1.19 1.24 2.18 1.32 OCTOBER 0.00 0.66 0.65 0.93 4.23 0.71 NOVEMBER 0.00 0.45 0.00 0.53 0.00 0.56 DECEMBER 0.59 0.27 0.09 0.40 0.47 0.40 SUBTOTAL 5.58 6.98 9.69 7.86 16.68 7.07 YEAR TOTAL 6.66 13.54 17.47 16.45 21.06 14.63 18 MONTH TOTAL 10.47 20.52 25.97 24.32 27.77 21.70
Table 5a. Precipitation by growing season segments for STERLING SITE from 1987-2006.
Wheat Wheat Corn Corn
Vegetative Reproductive Pre-plant Growing Season Sept.-March April-June July-April May - Oct.
Year Inches Inches Inches Inches
1987-88 5.2 9.9 11.1 15.8 1988-89 3.1 6.5 10.5 14.3 1989-90 5.1 4.7 11.8 13.0 1990-91 3.8 7.2 12.3 11.7 1991-92 4.5 4.8 9.1 14.8 1992-93 4.5 6.2 15.5 10.6 1993-94 6.4 3.0 10.2 6.1 1994-95 7.3 14.4 9.6 17.2 1995-96 4.2 9.2 7.5 18.0 1996-97 4.7 7.0 10.6 21.4 1997-98 5.5 4.9 16.7 13.8 1998-99 5.8 7.7 13.5 12.8 1999-00 5.7 3.0 12.6 8.6 2000-01 6.8 8.2 11.5 13.8 2001-02 4.2 1.9 8.2 8.1 2002-03 5.2 7.6 12.9 8.4 2003-04 1.3 5.3 6.4 10.1 2004-05 3.5 6.6 10.5 8.5 2005-06 2.7 1.3 5.0 9.3
Table 5b. Precipitation by growing season segment for STRATTON SITE from 1987-2006.
Wheat Wheat Corn Corn
Vegetative Reproductive Preplant Growing Season Sept.-March April-June July-April May - Oct.
Year Inches Inches Inches Inches
1987-88 4.3 7.2 8.8 12.6 1988-89 3.0 9.4 5.3 15.5 1989-90 5.3 6.1 11.0 13.4 1990-91 4.4 4.1 10.7 14.7 1991-92 3.3 6.1 14.2 13.6 1992-93 3.3 3.8 11.8 14.7 1993-94 4.3 7.8 16.7 13.5 1994-95 7.0 10.0 14.8 13.7 1995-96 3.5 6.0 8.1 14.5 1996-97 2.9 6.2 12.2 23.2 1997-98 8.0 5.9 22.6 13.9 1998-99 4.4 8.5 15.6 12.3 1999-00 6.2 3.9 14.2 8.8 2000-01 4.7 4.3 9.8 10.6 2001-02 3.8 2.2 9.5 6.9 2002-03 4.1 8.7 8.6 10.9 2003-04 5.1 3.8 9.8 6.3 2004-05 3.5 6.7 7.1 13.9 2005-06 4.3 4.8 9.5 9.7 Long Term Average 4.5 6.1 11.6 12.8
Table 5c. Precipitation by growing season segment for the WALSH site from 1987-2006.
Wheat Wheat Corn Corn
Vegetative Reproductive Preplant Growing Season Sept.-March April-June July-April May - Oct.
Year Inches Inches Inches Inches
1987-88 4.3 7.6 7.4 11.1 1988-89 4.1 11.5 8.1 20.2 1989-90 5.7 7.4 14.1 12.5 1990-91 5.0 7.7 11.7 12.2 1991-92 2.7 5.8 7.1 13.2 1992-93 6.1 9.2 13.8 14.5 1993-94 3.2 5.3 8.7 16.3 1994-95 4.6 7.2 16.6 7.2 1995-96 1.7 3.5 1.9 17.1 1996-97 5.8 5.3 17.2 11.3 1997-98 6.9 2.3 12.3 13.3 1998-99 8.2 7.4 19.4 14.5 1999-00 7.9 3.2 15.8 10.0 2000-01 9.0 7.9 13.4 9.6 2001-02 1.7 2.2 2.9 11.8 2002-03 6.7 11.4 15.8 12.5 2003-04 3.2 10.1 8.2 13.5 2004-05 3.0 4.7 8.5 8.3 2005-06 2.6 3.0 5.7 11.7 Long Term Average 4.9 6.5 11.0 12.7
Table 6a. Precipitation by growing season segment for Briggsdale from 1997-2006.
Wheat Wheat Corn Corn
Vegetative Reproductive Preplant Growing Season Sept.-March April-June July-April May - Oct. Year Inches Inches Inches Inches
1997-98 3.9 3.9 11.6 11.9 1998-99 4.6 8.4 15.3 12.4 1999-00 4.7 3.7 11.4 4.9 2000-01 2.9 8.0 5.6 10.4 2001-02 3.2 2.2 5.9 6.7 2002-03 3.8 4.9 8.1 7.1 2003-04 1.2 4.3 6.5 6.7 2004-05 3.1 5.6 5.6 8.7 2005-06 3.1 0.6 4.4 5.5
Long Term Average 3.4 4.6 8.3 8.3
Table 6b. Precipitation by growing season segment for the Akron Site from 1997-2006.
Wheat Wheat Corn Corn
Vegetative Reproductive Preplant Growing Season Sept.-March April-June July-April May - Oct. Year Inches Inches Inches Inches
1997-98 5.6 2.1 11.1 6.5 1998-99 2.8 7.9 11.4 17.1 1999-00 6.0 2.7 16.3 9.9 2000-01 6.4 6.3 12.1 12.7 2001-02 3.5 2.7 8.8 8.3 2002-03 5.9 10.9 11.9 11.3 2003-04 1.9 6.1 6.3 13.3 2004-05 4.5 7.2 10.7 15.9 2005-06 4.1 3.9 10.1 12.4
Table 6c. Precipitation by growing season segment for the Lamar Site from 1997-2006.
Wheat Wheat Corn Corn
Vegetative Reproductive Preplant Growing Season Sept.-March April-June July-April May - Oct. Year Inches Inches Inches Inches
1997-98 10.5 2.6 19.4 15.9 1998-99 7.5 9.2 22.5 11.0 1999-00 4.5 2.4 9.9 4.4 2000-01 3.6 7.0 5.7 10.2 2001-02 1.6 1.6 5.1 4.8 2002-03 4.5 6.0 6.8 8.5 2003-04 2.1 8.2 7.7 12.9 2004-05 7.7 6.7 14.8 11.8 2005-06 2.8 3.9 8.3 10.8
Table 7. Crop Variety, seeding rate, and planting date for each site in 2005-2006
season.
Site Crop Variety Seeding Rate
Planting Date Harvest Date
Akron Wheat Prairie Red 76 lb./acre 10/02/06 06/29/06 Corn
Pioneer 38P03 16K seeds/acre
05/18/06 10/31/06 Barley Otis/Stoneham 58 lb./acre 04/03/06 07/24/06 Foxtail
Millet
Golden German 15 lb./acre 06/05/06 08/22/06 Proso Millet Huntsman 15 lb./acre 06/19/06 08/22/06 Briggsdale Wheat Hatcher 60 lb./acre 09/26/05 07/13/06 Triticale Wintri 75 lb./acre 09/26/05 06/19/06 Barley Otis/Stoneham 50 lb./acre 03/26/06 07/13/06 Proso Millet Huntsman 18 lb./acre 07/13/06 09/26/06 F. Sorghum Grazex/ Golden
German
12
lb./6lb./acre
07/15/06 09/26/06 Lamar Wheat Stanton/Jagalene 45 lb./acre 09/15/05 06/21/06 F. Sorghum Sucrosorgo 405 7 lb./acre 06/20/06 11/17/06 Proso Millet Huntsman 15 lb./acre 06/07/06 09/12/06 Sterling Wheat Hatcher 60 lb./acre 09/15/05 07/10/06
Corn DKC 38-33RR 18K
seeds/acre
05/09/06 10/24/06 Proso Millet Huntsman 18 lb./acre 06/27/06 Failure Stratton Wheat Hatcher 60 lb./acre 09/20/05 07/06/06
Corn DKC 38-33RR 18K
seeds/acre
05/08/06 10/04/06 Proso Millet Huntsman 18 lb./acre 07/03/06 Failure
Walsh Wheat Above 50 lb./acre 10/14/05 06/27/06
Corn Mycogen 2E762 17K seeds/acre 05/22/06 10/23/06 Grain Sorghum Mycogen 627 40K seeds/acre 05/22/06 11/09/06 Proso Millet Huntsman 17 lb./acre 06/21/06 09/19/06
Table 8. Grain and stover yields for WHEATat Sterling, Stratton and Walsh in 2006.
SLOPE POSITION
SUMMIT SIDESLOPE TOESLOPE
SITE
& GRAIN STOVER GRAIN STOVER GRAIN STOVER
ROTATION NP* NP NP* NP NP* NP NP* NP NP* NP NP* NP
STERLING: --- Bu./A. --- ---- lbs./A. --- --- Bu./A. ---- --- lbs./A. --- --- Bu./A. ---- ---- lbs./A. ---
WCF 5.3 7.8 950 1470 14.9 11.4 2743 2069 21.8 22.5 6275 4535
WCM 1.3 6.8 390 1475 12.8 5.0 2385 2700 4.2 1.8 690 790
(W)WCM 3.7 3.8 2725 4850 7.5 8.2 1550 1510 3.3 2.1 5540 680
W(W)CM 4.2 13.4 1340 3280 9.7 11.1 2260 2385 6.0 5.7 1540 1850
NP* NP NP* NP NP* NP NP* NP NP* NP NP* NP
STRATTON: --- Bu./A. --- --- lbs./A. --- --- Bu./A. --- ---- lbs./A. --- --- Bu./A. --- --- lbs./A. ---
WCF 18.9 24.1 2490 3155 13.7 32.0 1765 6175 39.3 33.0 8560 7265
WCM 11.2 10.7 1630 1610 2.5 32.6 140 4430 28.0 16.4 5010 3015
(W)WCM 15.2 7.2 2410 1355 8.2 5.4 2470 1615 34.6 27.5 8250 6435
W(W)CM 10.3 5.7 1855 1025 28.8 24.0 7580 6175 18.3 21.9 9525 6970
NP* NP NP* NP NP* NP NP* NP NP* NP NP* NP
WALSH: --- Bu./A. --- --- lbs./A. --- --- Bu./A. --- ---- lbs./A. --- --- Bu./A. --- --- lbs./A. ---
WSF 8.3 5.8 2335 1100 7.7 7.3 1685 1700 5.2 7.7 1520 1915
WCB 1.7 0.2 1630 130 0.9 0.1 575 25 1.3 0.1 1960 50
(W)WSB 0.5 0.2 400 110 0.3 0.2 120 80 0.4 0.3 240 750
W(W)SB 1.6 0.9 600 485 0.7 0.7 250 420 0.5 0.3 390 170 1. Wheat grain yield expressed at 12% moisture.