ALFALFA PRODUCTION USING SALINE DRAINAGE WATER Dr. James E. Ayars1
Dr. Richard W. Soppe2 Dr. Peter Shouse3
ABSTRACT
A three year study investigated the use of saline (< 6 dS/m) drainage water for irrigation of salt tolerant alfalfa in the presence of a shallow saline groundwater. The three irrigation treatments included; irrigating with non-saline water, irrigating twice with moderately saline water between cuttings, and irrigating once between cuttings with moderately saline water. Yield data
demonstrated that there was approximately a 30% reduction in total yield as a result of using the saline water for irrigation compared to irrigating with the non-saline water. The overall alfalfa quality was improved using saline water. However, there was an accumulation of boron and chloride in the plant tissue with time during each growing season when irrigating with saline water. The boron and chloride values returned to previous levels at the start of the next growing season. There was accumulation of salt in the soil profile and in a shallow groundwater as a result of using saline drainage water for irrigation. A gradual decrease in depth to the shallow groundwater was observed as result of the lack of drainage capability.
INTRODUCTION
Drainage water disposal is limited due to environmental concerns related to high salt content and the presence of trace elements like selenium and boron in drainage water. Reducing the volume of drainage water and salt mass for disposal is a necessary part of a long term solution that will allow irrigated agriculture to maintain its current productivity levels. Reduction of drainage water volume can be obtained through source control (reduction of irrigation application) and/or through the reuse of drainage water (SJVDP, 1990). Applied irrigation water can be reduced when shallow in-situ groundwater is considered a useable water source for the crop (Ayars et al., 2006). Using in-situ groundwater is highly preferable over drainage water reuse since it is more energy efficient for the plants to extract water directly from the source than using pumps to irrigate. The potential of salinization of the root zone exists when saline groundwater moves upward into the soil profile, although earlier research suggests that winter precipitation and pre-plant irrigation are adequate to prevent salt buildup in the root zone (Ayars, 2003). Another option to reduce drainage water volume is to reuse drainage water directly as irrigation water or blend it with fresh water, depending on the quality and composition of the drainage water (Ayars et al., 1993). When salts are added to a field, but do not accumulate in the root zone, it is likely that the shallow groundwater quality is deteriorating. This might not immediately result in higher salinity in the drainage water, however, due to the buffering effect of the groundwater reservoir.
1 Agricultural Engineer, USDA-ARS, 9611 S. Riverbend Ave, Parlier, CA, 93648. jayars@fresno.ars.usda.gov 2 Engineer, WaterWatch, Generaal Foulkesweg 28, 6703 BS Wageningen, The Netherlands,
r.sopppe@waterwatch.nl.
3 Soil Physicist, USDA-ARS, George E. Brown, Jr. Salinity Laboratory, USDA-ARS, 450 W. Big Springs Rd., Riverside, CA 92507-4617. pshouse@ussl.ars.usda.gov
The concept of shallow groundwater management using subsurface drains has been developed and tested in humid areas, but more research is needed in arid areas under irrigated conditions (Fouss et al., 1990). It has been successful in areas with nearly level ground surface and drainage systems which have closely spaced laterals with shallower depth of placement (< 1.5 m). These are significantly different conditions than normally found in arid irrigated areas.
This paper reports the results of a three-year study that evaluated the potential for using saline drainage water for irrigation of alfalfa in the presence of a controlled drainage system.
MATERIALS AND METHODS
A field was selected in the Broadview Water District (BWD) that had access to both good quality and drainage water. The site was owned and managed by the BWD. The field size was
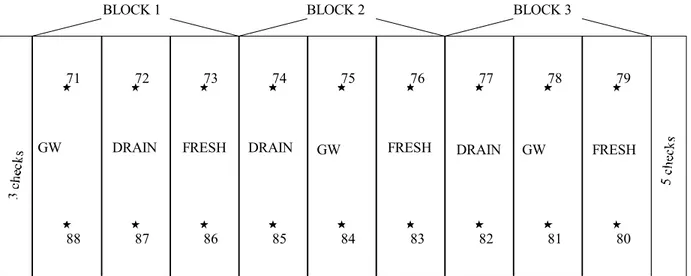
approximately 25 ha and was divided into 9 plots (Fig. 1) each approximately 2.4 ha (90m by 270 m) in size. The 3 irrigation water quality treatments imposed on the site included “FRESH” water, “DRAIN” water, and “GW” groundwater. The site was subdivided into three major blocks, which were further subdivided into three blocks with the irrigation treatments assigned randomly within each of the major blocks. The plots in each block were divided with berms and further subdivided with shallower berms to aid in irrigation.
The “FRESH” treatment used good quality irrigation water and had 2 irrigations of
approximately 100 mm each between cuttings. The “DRAIN” treatment used drain water with an EC of approximately 6 dS/m and had 2 irrigations of approximately 100 mm each between cuttings. The last treatment “groundwater” (GW) used drainage water for irrigation and has one irrigation of approximately 100 mm between cuttings. The GW treatment was designed to test whether the alfalfa could use any shallow groundwater in-situ. The original design was to not irrigate the "GW" treatment after establishment and have the alfalfa use only groundwater. This was not feasible because of the high salinity of the ground water eliminated any possibility of in-situ use by the crop.
The characteristics of the soil in the field and the time between cuttings limit the ability to apply more than two irrigations between cuttings. The soil is clay and cracks heavily which slows the advance time and also restricts the total infiltrated depth of water. Each irrigation took
approximately 10 days to complete and total of 20 day was needed to complete two irrigations between cuttings. Some time was needed after irrigation for the soil to dry to permit access of machinery to cut the crop.
71 72 73 74 75 76 77 78 79 80 81 82 83 84 85 86 87 88 DRAIN FRESH
GW DRAIN GW FRESH DRAIN GW FRESH
BLOCK 2 BLOCK 3
BLOCK 1
Figure 1. Plot layout for irrigation water quality treatments.
The locations of the groundwater wells used for measuring water table response and collecting ground water samples is shown in Fig. 1 along with the irrigation treatment designation. The sites were labeled from 71 to 88 with two wells in each of the treatment replications. The wells were 2 m deep and were constructed from 50 mm diameter PVC pipe that is perforated over the lower 0.5 m. The water table position in the wells was read either manually and/or with a continuously recording pressure transducer. Some wells were monitored continuously from December 2002 to the end of the project in 2005. All of the wells were sampled periodically for water quality analysis during the duration of the project.
Field Operations:
A safflower crop was grown in 2001 without irrigation to dry down the field in preparation for leveling prior to planting. After harvest of the safflower, the field was disked and laser leveled and prepared for planting of salt tolerant alfalfa in 2002.
Alfalfa (var. SW9720) was planted on February 22, 2002 and was sprinkler irrigated on March 15, 2002 with good quality water to aid in germination. This variety was purported to be more salt tolerant than other varieties being used in the San Joaquin Valley and was selected for this trial. The pertinent values used in the Maas Hoffman equation have not been developed for this variety but it is thought to have a higher threshold value and a steeper yield decline slope. The field was flood irrigated with good quality water beginning on April 18, 2002 and all subsequent irrigations used good quality (low salinity) water until the last irrigation of the season. There were no differential treatments of water quality or numbers of irrigations during the period January to September 2002. The intent was to develop a uniform stand prior to initiating the irrigation water quality treatments. The last irrigation of the season applied drainage water to the ground water (GW) and drainage (DRAIN) treatments.
Irrigation water quality treatments were initiated in the second year of the alfalfa stand (2003). Other field operations were those needed to harvest the crop which included cutting the alfalfa,
raking the dried hay into windrows, baling, and then picking up the bales. There were a total of 5 cuttings during the growing season that were spaced roughly 4 to 6 weeks apart. The hay was cut in March, April, June, July, and September. No field operations were conducted from September 2003 to March 2004. Irrigation was applied following the last harvest in 2003 to maintain the alfalfa over the winter dormant period.
The first harvest of the 2004 cropping year was in April and there were a total of 4 harvests during the growing season. All harvest operations were the responsibility of an independent contractor employed by the BWD. Other than harvest there were no other cultural operations done on the plots during the 2004 growing season. The same irrigation protocols were used in 2004 as in 2003.
Soil, Plant, and Water Sampling:
Soil samples were collected by personnel from the George E. Brown Jr. Salinity Laboratory (GEBJSL) between February 28 and March 1, 2001 and were taken to the GEBJSL for analysis of electrical conductivity (EC), and boron (B) and chloride (Cl) concentrations. The site was sampled in the Spring and Fall of each year of the study. The distribution of soil salinity was characterized using the mobile soil mapping equipment developed by the personnel at the George E. Brown Jr. Salinity Laboratory in the Spring of 2003 and 2004. The EM-38 was
operated in both horizontal and vertical modes to characterize the apparent salinity distribution in the surface layers and deeper into the profile. The data were tracked with a global position
system (GPS) that enabled the data to be plotted on a map that corresponds to other maps being used in the research.
Plant sampling was done prior to harvest at 3 locations in each plot. One location was a random selection in the center third of the field while the other 2 locations were located near the
observation wells on each end of the plot and represented the north and south thirds of the field. A total of one square meter of alfalfa was sampled at each location. The samples were dried and ground prior before sending to the laboratory for analysis. A sub-sample of the ground hay was sent to the George Brown Salinity Laboratory for analysis of chemical constituents.
The samples were also sent to a commercial laboratory for analysis using a 30 hour in-vitro analysis recommended by Peter Robinson, Dairy Nutritionist with the University of California at Davis, CA. The data were used to determine the effect of the irrigation treatments and the location of the sample on the quality of the forage. The parameters used in the analysis were: crude protein (CP), acid detergent fiber (ADF), neutral detergent fiber (NDF), digestible NDF as a percentage NDF (dNDF), non-fibrous carbohydrates (NFC), net energy lactation (Nel), fat
(EE), ash, in-vitro digestible dry matter (IVDDM).
The groundwater observation wells in test site were sampled periodically starting in the summer of 2002. At the beginning of 2003 the sampling was done approximately monthly until October 2004. The water was analyzed for electrical conductivity (EC), boron (B), and nitrate (NO3)
RESULTS Water
The CIMIS data for rainfall and the estimated alfalfa water use (Etc), from the Westland Water
District water management guide for the central part of the district were used for comparison with the applied water in the project. The data are summarized in table 1 for the growing season of each year. The total applied water is also given in table 1. The applied irrigation water is further subdivided in table 2 to show the amounts of saline and non-saline water applied each year.
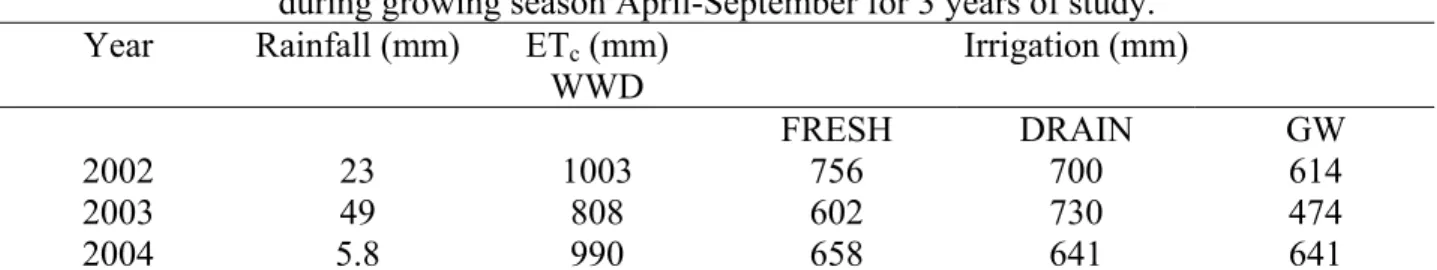
Table 1. Summary of estimated Etc for well watered irrigated alfalfa and irrigation applications
during growing season April-September for 3 years of study. Year Rainfall (mm) ETc (mm) WWD Irrigation (mm) FRESH DRAIN GW 2002 23 1003 756 700 614 2003 49 808 602 730 474 2004 5.8 990 658 641 641 Table 2. Summary of total applied irrigation water in each treatment for three years of study.
Year FRESH DRAIN GW
NS (mm) NS (mm) S (mm) NS (mm) S (mm)
2002 805 546 202 546 117
2003 602 109 621 109 365
2004 658 315 326 315 326
Total 2216 970 1390 970 903
NS - non-saline, low salinity (0.5dS/m) S - saline, ( 3 - 6 dS/m)
The total irrigation was approximately 60 to 70% of the crop water requirement for a well watered alfalfa crop estimated using the Westlands guide. This was a result of the irrigation system design and management and the soil type as previously discussed. Saline water made up nearly 50% of the total water requirement. To determine the impact of this amount of saline water on soil salinity, the average volume weighted salinity was calculated for each treatment for each year of the experiment using measured salinities and applied water along with rainfall. This calculation included the total amount of rainfall during the year, since there is the potential for leaching as a result of rainfall. The results of this calculation are summarized in table 3.
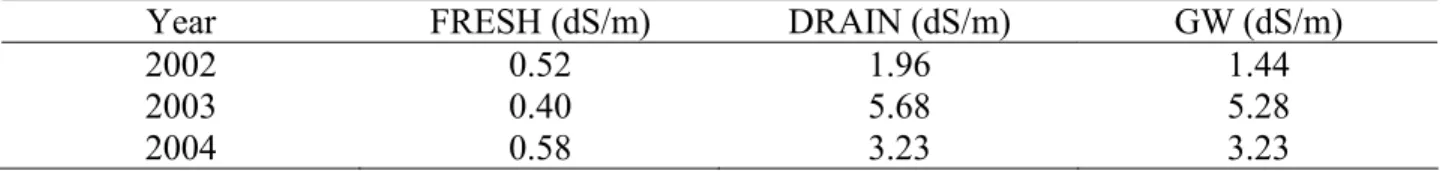
Table 3. Volume weighted average electrical conductivity of irrigation water for irrigation treatments.
Year FRESH (dS/m) DRAIN (dS/m) GW (dS/m)
2002 0.52 1.96 1.44 2003 0.40 5.68 5.28 2004 0.58 3.23 3.23 These values were used along with the applied water in each year to determine the salt load
being applied to treatment. Groundwater Response
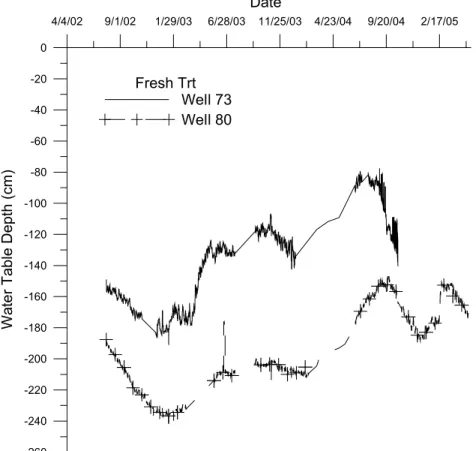
In Fig. 2 two wells in the FRESH water treatment were used to demonstrate the response of the shallow groundwater to irrigation and to managing the ground water by turning off the drain system sump pump. Well 73 is located on the west side of the field adjacent to the district water supply canal and well 80 is located on the east side of the field. The drainage system laterals discharge on the west side of the field. The water table depth data for other wells in the FRESH treatment plots were located between these two wells. The data demonstrate a gradual decrease in the depth to the water table with time over the irrigation season and an increase over the winter. This pattern is repeated each year of the project and in all treatments. The deepest water table depth was found on the east side of the field. The initial depth was not greater than 2 m which does not limit crop use from shallow groundwater with a fluctuating water table,
particularly with a deep-rooted crop like alfalfa. The average depth to the water table decreased over the duration of the project since the drainage sump was not operated after 2003.
Salt Balance
The sustainability of a reuse system will depend on the salt management within the soil profile and the accumulation in the ground water. The “salt balance” is a concept that is used to quantify the salt management within an agricultural area and the definition is that as much salt should leave the area as comes into it. This will ensure no accumulation of salt and should sustain the production system. This approach to salt management is no longer possible in the BWD on the westside of the San Joaquin Valley because of limitations on drainage water disposal. Instead, the approach will be to manage salt in the crop root zone to limit the accumulation to levels that are not injurious to crop production. Salt in the root zone will have to be moved out of the root zone and lower into to the soil profile or into the ground water. This suggests that there will be finite life span for a field and that there will be a progression of cropping as the soil becomes progressively more saline.
The applied irrigation water data were combined with the weighted average salinity data to calculate the salt load applied to each of the irrigation treatments. These data are summarized in Table 4. A total of 7 Mg/ha were applied to the plots in the FRESH treatment while a total of 53 Mg/ha was applied to the DRAIN treatment and 33 Mg/ha to the GW plots. The additional irrigation in the DRAIN plots accounted for the increased salt load.
Figure 2. Water table response in groundwater wells in "FRESH" irrigation treatment. Table 4. Summary of salt load applied from 2002 to 2004.
FRESH DRAIN GW
Year (Mg/ha) NS (Mg/ha) NS (Mg/ha) S (Mg/ha) NS (Mg/ha) S
2002 2.7 1.5 78 1.5 4.5 2003 1.9 0.3 35.0 0.3 19.0 2004 2.4 0.6 9.9 0.6 9.5 Total 7.0 2.4 52.7 2.4 33.0
The groundwater EC data were averaged by sample date and have been plotted in Fig 3. for the GW, DRAIN, and FRESH treatments. These data demonstrate a distinct pattern of increasing concentration during the irrigation season followed by a decrease over the winter months with an increase in the next irrigation season The highest salinity is in the DRAIN treatment that was irrigated twice between harvests with saline drainage water. The intermediate value is under the FRESH treatment which was irrigated twice between harvests with low salinity water. The lowest average salinity is under the GW treatment that was irrigated once between harvests with saline water. There is considerable variability in the data so there is probably no statistical difference between the two curves.
4/4/02 9/1/02 1/29/03 6/28/03 11/25/03 4/23/04 9/20/04 2/17/05 Date -260 -240 -220 -200 -180 -160 -140 -120 -100 -80 -60 -40 -20 0 Wa te r Ta ble Dep th (c m) Fresh Trt Well 73 Well 80
Figure 3. Average electrical conductivity of shallow groundwater under FRESH, DRAIN, and GW irrigation treatments.
The boron data in the shallow groundwater were averaged over the same time period and in the same manner as the EC data. These data are given in Fig. 4 and there is the same pattern of increasing and decreasing concentrations as demonstrated in the EC data.
EM-38 Analysis
The data from surveys with the EM-38 are mapped in figure 5a and 5b for 2003 and 6a and 6b for 2004. The scales were maintained from year to year but there are some differences in the color coding associated with the scales for subsequent years. It is important to realize that the data are averaged over depth and are good for indicating patterns of accumulation but don’t provide data for specific depths.
The data show there was a progressive accumulation of salt when saline water was applied compared to fresh water. There is also a difference between the DRAIN and GW treatment. In this case the DRAIN treatment received two irrigations between harvests and the groundwater treatment only received one. This resulted in the drainage treatment becoming more saline than the groundwater treatment. The soil lowest salinity was found in the FRESH treatment as would be expected since only minor amounts of salt had been added during irrigation compared to the other two treatments. The vertical measurements were more saline than the horizontal treatments for a given treatment demonstrating the increased soil salinity with depth. The data show a progressive increase in the soil salinity over the 3 years of the study as a result of the application of irrigation water with limited opportunities for leaching.
9/1/02 1/29/03 6/28/03 11/25/03 4/23/04 9/20/04 2/17/05 Date 0 5 10 15 20 25 30 35 40 Ave El e ct rical conductivity (d S/m) Irrigation Treatments GW Drain Fresh
Figure 4. Average boron concentration in the shallow groundwater under the GW, FRESH and DRAIN irrigation treatments.
Plant Analysis
The total bale counts for each irrigation treatment by year are summarized in Table 5. Only the two years when the irrigation treatments were imposed are given. There was approximately a 30% drop in yield in the plots receiving saline water compared to the FRESH treatment. In each year the largest component of the yield was in the first cutting following dormancy with the yield getting progressively smaller with each cutting (data not shown). Bales weighed approximately 68 kg.
Table 5. Bale summary for Broadview plots for 2003 and 2004.
Year FRESH DRAIN GW
Bales Mg/ha/mm Bales Mg/ha/mm Bales Mg/ha/mm
2003 880 .038 716 .026 707 .038 2004 625 .027 331 .015 427 .019 Total 1505 1047 1134 9/1/02 1/29/03 6/28/03 11/25/03 4/23/04 9/20/04 2/17/05 Date 0 5 10 15 20 25 30 35 40 45 50 A ve rag e B (m g/ L ) Irrigation Treatments GW Drain Fresh
Figure 5a. Apparent soil electrical conductivity measured with EM-38 in horizontal mode in the spring 2003 on field 33 of the Broadview Water District
Figure 5b. Apparent soil electrical conductivity measured with EM-38 in the vertical mode in the spring 2003 on field 33 of the Broadview Water District.
40 80 120 160 200 240 280 320 360 400 440
2003 Vertical Em
GW Drain Fresh Drain GW Fresh Drain GW Fresh
ms/m 40 80 120 160 200 240 280 320 360 400 440
GW Drain Fresh Drain GW Fresh Drain GW Fresh
Figure 6a. Apparent soil electrical conductivity measured with EM-38 in horizontal mode in the spring 2004 on field 33 of the Broadview Water District.
Figure 6b. Apparent soil electrical conductivity measured with EM-38 in the vertical mode in the spring 2004 on field 33 of the Broadview Water District.
In 2003 there were statistical differences by treatment in the quality parameters NDF, NFC, and EE as well as in the yield (data not shown). The highest yield values were found in the FRESH treatment. In the second cut of 2003 differences were noted by location in the field between the north, center, and south. There were differences in yield both by treatment and location. Fresh
40 80 120 160 200 240 280 320 360 400 440
2004 Vertical Em
GW Drain Fresh Drain GW Fresh Drain GW
Fresh ms/m 40 80 120 160 200 240 280 320 360 400 440
2004 Horizontal Em
Drain Fresh Drain GW Fresh Drain GW Fresh
GW
had the highest yield and the south location was highest. By cut 3 differences were found in all forage quality parameters as a function of water quality treatment. Yields were significantly different by location in the field for all treatments. In cut 4 there were statistical variations by treatment and well as the CP. The irrigation was applied from the south side of the field and as a result there is more water infiltrated on the south side than on the north side (tail end) of the field In 2004 there were no differences in yield in cut 1. In the forage quality parameters there were differences in the ADF and the NFC by treatment and differences in EE by location. In cut 2 statistical differences developed in the ADF, NDF, dNDF, NFC, IVDDM by treatment. In cut 3 the CP was different by location and treatment. There were significant yield differences by treatment. These data demonstrated that there were significant effects on yield and quality relative to the quality of applied water and total applied water.
The water productivity is also given in table 5. Using an average bale weight of 68 kg, the yields were converted to an average on a hectare basis and divided by the applied water and rainfall sum as given in table 1. It is interesting that the productivity in the GW treatment in 2003 was similar to the FRESH treatment that year. The productivity was reduced in subsequent years with the use of saline water for irrigation.
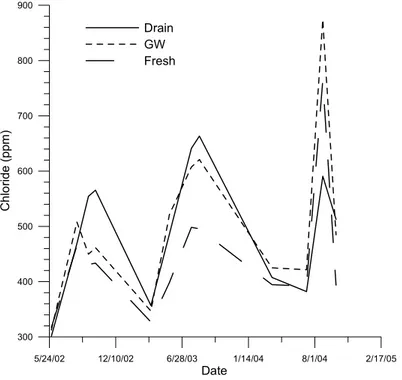
Since the plants are being grown in saline soils and irrigated with poor quality water there is a need to consider the accumulation of various ions in the plant material. The Cl and B
concentrations were averaged for each treatment and plotted in Fig 7 and 8, respectively. The data show in 2003 and 2004 that the concentration in plant was related to the total applied
drainage water. The concentration increased from FRESH to GW to DRAIN. This is not the case in 2004
DISCUSSION
The utility of a reuse system relies on the ability of the manger to dispose of saline water in a manner that maintains production and minimizes environmental impact and is hopefully cost effective. Over the course of this study there was approximately 1390 mm of saline water applied to the drainage treatment and 903 mm applied to the GW treatment. There was no drainage from the site and there was a gradual decrease in the depth to the shallow ground water. The estimated crop water use in 2003 was 602 mm for Fresh, 730 mm for Drain, and 474 mm for the GW treatment. In 2004 the crop water use was 658 for the FRESH and 641 for the DRAIN and GW. The differences in applied water probably account for the change in water table depth.
Crops respond to the average irrigation water salinity over the season. The weighted averages for the individual treatments are summarized in Table 3. In 2003 the EC exceeded the
Maas-Hoffman threshold salinity for alfalfa and some yield loss would be expected in the DRAIN and GW treatments. The yield decreased through the growing season as the salinity values increased. The yield data taken for sampling for forage analysis also demonstrated the need to manage the distribution across the field. The yield loss was highest on the tail end of the field which received the smallest amount of water. The yield response from season to season demonstrated the need to use low salinity water over the winter for some reclamation of the soil. This would not be needed
in a situation with lower salinity water being a part of the reuse system. The water productivity decreased in 2004 as a result of using saline water for irrigation.
Figure 7. Average chloride concentration in alfalfa for each irrigation treatment.
Figure 8. Average boron concentration in alfalfa for each irrigation treatment.
5/24/02 12/10/02 6/28/03 1/14/04 8/1/04 2/17/05 Date 300 400 500 600 700 800 900 Chlo ride (pp m ) Drain GW Fresh 5/24/02 9/1/02 12/10/02 3/20/03 6/28/03 10/6/03 1/14/04 4/23/04 8/1/04 11/9/04 Date 60 80 100 120 140 160 180 200 220 240 260 280 Boron ( ppm ) Drain GW Fresh
The quality of the forage is also a critical consideration of the system. The data for the
parameters that describe the forage quality show that the alfalfa quality was improved as a result of irrigation with saline water. The stress induced by the salinity reduced the forage mass but increased the NEL. Use the values for CP and NDF and ADF the alfalfa generally was graded as premium or better which would result in good price for the alfalfa. The B and Cl concentrations increased with time during the season but reduced to previous levels at the beginning of the next season so these parameters should not be a problem.
There was a gradual increase in the average soil salinity with time as a result of the lack of drainage water disposal capability. For this site to be viable some offsite drainage water disposal will be required. There were distinct differences in the salinity response in the two treatments being irrigated with saline water. The DRAIN treatment was accumulating salt faster than the GW treatment and the EC of the ground water reflected the additional salt loading as did the soil salinity.
CONCLUSIONS
The salt tolerant alfalfa used in this study has potential for a reuse system but will be most effective with lower salinity water.
Drainage from the site is needed to maintain soil salinity at acceptable levels.
A reuse system will require a well managed irrigation system. Surface systems can be used but will require either larger flows or shorter run lengths to minimize distribution non-uniformity. Yields can be maintained by increasing the irrigation frequency compared to the system being used and periodic use of lower salinity water to maintain the average soil salinity. The soil salinity should be lowest when alfalfa breaks dormancy in the spring.
EM-38 can be used to manage the salinity levels and characterize the accumulation of salt. REFERENCES
Ayars, J.E. 2003. Field crop production in areas with saline soils and shallow saline groundwater in the San Joaquin Valley of California. Journal of Crop Production 7:353-386.
Ayars, J.E., E.W. Christen, R.W.O. Soppe, and W.S. Meyer. 2006. Resource potential of shallow groundwater for crop water use-A review Irrigation science 24: 147 -160.
Ayars, J.E., R.B. Hutmacher, R.A. Schoneman, S.S. Vail, and T. Pflaum. 1993. Long Term Use of Saline Water For Irrigation. Irrigation Science 14:27-34.
Ayars, J.E. and R.W. Soppe, 2001. A three-year active land management program to reduce drain water and improve wildlife habitat. Final report. USDA-ARS-Water Management Research Laboratory, Fresno, CA.
Fouss, J.L., R.W. Skaggs, J.E. Ayars and H.W. Belcher, 1990. Water table control and shallow groundwater utilization. In: Management of Farm Irrigation Systems. Eds. G.J. Hoffman, T.A. Howell and K.H. Solomon. American Society of Agricultural Engineers, St. Joseph, Michigan, 783-824.
San Joaquin Valley Drainage Program, 1990. A management plan for agricultural subsurface drainage and related problems on the westside of the San Joaquin Valley. Eds. U.S. Department of the Interior, California Resources Agency. California Department of Water Resources, Sacramento, Ca. 183 pg.