Technical Report
TR10-3 March, 2010
Ag
ricultural
Experiment Station
College of
Agricultural Sciences Department of BioagriculturalSciences and Pest Management
2009 Colorado Field Crop
Insect Management Research
2009 Colorado Field Crop
Insect Management Research
and Demonstration Trials
1Frank B. Peairs2 Jeff Rudolph2 Terri L. Randolph2
Mention of a trademark or proprietary product does not constitute endorsement by the Colorado Agricultural
1
Experiment Station.
Department of Bioagricultural Sciences and Pest Management, Colorado State University
2
Colorado State University is an equal opportunity/affirmative action institution and complies with all Federal and Colorado State laws, regulations, and executive orders regarding affirmative action requirements in all programs. The Office of Equal Opportunity is located in 101 Student Services. In order to assist Colorado State University in meeting its affirmative action responsibilities, ethnic minorities, women, and other protected class members are encouraged to apply and to so identify themselves.
TABLE OF CONTENTS
CONTROL OF RUSSIAN WHEAT APHID BIOTYPE RWA2 AND BROWN WHEAT MITE IN WINTER WHEAT WITH
HAND-APPLIED INSECTICIDES, ARDEC, FORT COLLINS, CO, 2009. . . 2
CONTROL OF RUSSIAN WHEAT APHID BIOTYPE RWA2 IN SPRING BARLEY WITH HAND-APPLIED INSECTICIDES, ARDEC, FORT COLLINS, CO, 2009.. . . 4
CONTROL OF BROWN WHEAT MITE AND RUSSIAN WHEAT APHID IN FIVE VARIETIES OF WINTER WHEAT, LAMAR, CO 2009. . . 6
EFFECT OF IRRIGATION, FERTILIZATION AND INSECTICIDE TREATMENT ON BROWN WHEAT MITE IN SPRINKLER-IRRIGATED WINTER WHEAT. HOLLY, CO, 2009.. . . 10
CONTROL OF BROWN WHEAT MITE IN IRRIGATED WINTER WHEAT, HILLROSE, CO, 2009.. . . 13
CONTROL OF ALFALFA INSECTS IN ALFALFA WITH HAND-APPLIED INSECTICIDES, ARDEC, FORT COLLINS, CO, 2009. . . 15
CONTROL OF WESTERN CORN ROOTWORM IN FIELD CORN WITH PLANTING-TIME SOIL INSECTICIDES, SEED TREATMENTS, AND PLANT-INCORPORATED PROTECTANTS, ARDEC, FORT COLLINS, CO, 2009. . . 19
CONTROL OF SPIDER MITES IN CORN WITH HAND-APPLIED INSECTICIDES AND MITICIDES, ARDEC, FORT COLLINS, CO, 2009. . . 22
2009 PEST SURVEY RESULTS.. . . 24
INSECTICIDE PERFORMANCE SUMMARIES. . . 27
ACKNOWLEDGMENTS.. . . 31
CONTROL OF RUSSIAN WHEAT APHID BIOTYPE RWA2 AND BROWN WHEAT MITE IN WINTER WHEAT WITH HAND-APPLIED INSECTICIDES, ARDEC, FORT COLLINS, CO, 2009
Jeff Rudolph, Terri Randolph, Frank Peairs, Tyler Keck, Marie Stiles, and Dylan Walker, Department of Bioagricultural Sciences and Pest Management
CONTROL OF RUSSIAN WHEAT APHID BIOTYPE RWA2 AND BROWN WHEAT MITE IN WINTER WHEAT WITH HAND-APPLIED INSECTICIDES, ARDEC, FORT COLLINS, CO, 2009: Treatments were applied on 7 May 2009 with a
2
'rickshaw-type' CO powered sprayer calibrated to apply 20 gal/acre at 3 mph and 32 psi through three 8002 (LF2) nozzles mounted on a 4.0 ft boom. Conditions were partly cloudy and calm with temperatures of 60EF during the time of treatment. Plots were 6 rows (5.0 ft) by 28.0 ft and were arranged in six replicates of a randomized, complete block design. Crop stage at application was early jointing (Zadoks 30). The crop had been infested with greenhouse-reared Biotype RWA2 aphids on 24 February 2009.
Treatments were evaluated for Russian wheat aphid control by collecting 20 symptomatic tillers along the middle four rows of each plot 7, 14 and 21 days after treatment (DAT). Tiller samples were placed in Berlese funnels for 24 hours to extract aphids into alcohol for counting. Symptomatic tiller samples taken the day before treatment averaged 3.8 Russian wheat aphids per tiller.
A naturally occurring brown wheat mite infestation was evaluated by taking five two-second samples with a Vortis suction sampler and placing the collected material in Berlese funnels for 48 h to extract mites into alcohol for counting. The brown wheat mite precounts taken the day before treatment averaged 279.2 mites per sample.
Aphid counts transformed by the square root + ½ method (7 and 21 DAT) or the log + 1 method (14 DAT and total aphid days) were used for analysis of variance and mean separation by Tukey’s HSD test (á=0.05). Mite counts were
transformed by the log + 1 method prior to similar analysis. Original means are presented in Tables 1 and 2. Total aphid or mite days for each treatment were calculated according the method of Ruppel (Journal of Economic Entomology 76: 375-7, 1983) and analyzed in the same manner, with original means presented in Table 1. Reductions in insect days were calculated by Abbott's (1925) formula: (percent reduction = ((untreated-treated)/untreated) X 100).
Aphid pressure was more severe than in the 2008 and similar to the 2007 experiments, with about 32 aphids/tiller in the untreated control 21 DAT (Table 1) compared to 27 and 20 in 2007 and 2008, respectively. The mite infestation was severe and unusual for this location. Crop condition was fair and in recovery from severe drought and the mite
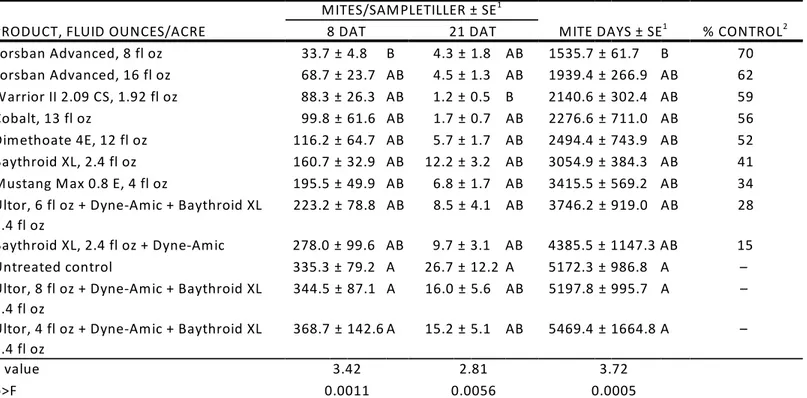
infestation. All treatments had fewer aphid days than the untreated control. The high rate of Lorsban Advanced and the Cobalt, 13 fl. oz., were the only treatments to reduce total aphid days over three weeks by 90% or more, the level of performance observed by the more effective treatments in past experiments. Only the Lorsban Advanced, 8 fl. oz., had fewer mite days than the untreated control. No phytotoxicity was observed with any treatment.
Field History
Pest: Russian wheat aphid, Diuraphis noxia (Kurdjumov)
Brown wheat mite, Petrobia latens (Müller)
Cultivar: 'Hatcher'
Planting Date: 11 Sept 2008
Irrigation: Post planting, linear move sprinkler with drop nozzles Crop History: Fallow in 2008
Herbicide: 0.5 oz Harmony Extra and 16 oz MCPA per acre on 26 May 2009
Table 1. Control of Russian wheat aphid with hand-applied insecticides, ARDEC, Fort Collins, CO. 2009. APHIDS/TILLER ± SE1
PRODUCT, FLUID OUNCES/ACRE
7 DAT 14 DAT 21 DAT APHID DAYS/TILLER ± SE1
% CONTROL2
Lorsban Advanced, 16 fl oz 0.5 ± 0.1 E 0.3 ± 0.1 F 1.7 ± 1.0 CD 37.7 ± 3.8 F 92
Cobalt, 13 fl oz 0.5 ± 0.2 E 1.4 ± 0.5 DEF 0.7 ± 0.5 D 42.4 ± 2.7 EF 91
Lorsban Advanced, 8 fl oz 0.8 ± 0.3 DE 2.2 ± 1.1 CDEF 1.2 ± 0.5 D 52.0 ± 7.3 EF 89
Ultor, 6 fl oz + Dyne-Amic + Baythroid XL 2.4 fl oz
2.2 ± 0.6 CDE 1.5 ± 0.6 DEF 2.9 ± 1.1 BCD 62.7 ± 8.9 DEF 87
Ultor, 8 fl oz + Dyne-Amic + Baythroid XL 2.4 fl oz
3.3 ± 0.4 BCD 0.9 ± 0.2 EF 2.2 ± 0.5 CD 63.3 ± 4.5 DEF 87
Dimethoate 4E, 12 fl oz 1.7 ± 0.3 CDE 3.4 ± 0.7 BCDE 4.0 ± 1.5 BCD 76.3 ± 8.6 CDE 85
Warrior II 2.09 CS, 1.92 fl oz 3.3 ± 1.4 BCD 2.6 ± 0.6 BCDE 3.3 ± 1.0 BCD 78.9 ± 11.3 CDE 84
Ultor, 4 fl oz + Dyne-Amic + Baythroid XL 2.4 fl oz 4.8 ± 0.6 BC 3.1 ± 0.8 BCDE 4.1 ± 1.1 BCD 96.3 ± 9.7 BCD 80 Baythroid XL, 2.4 fl oz 6.3 ± 1.0 B 6.2 ± 1.5 BC 6.7 ± 2.0 BCD 137.7 ± 19.1 BC 72 Mustang Max 0.8 E, 4 fl oz 7.0 ± 1.3 B 5.1 ± 1.6 BCD 8.8 ± 3.1 BC 141.6 ± 22.3 BC 71 Baythroid XL, 2.4 fl oz + Dyne-Amic 6.6 ± 1.7 B 8.5 ± 2.2 AB 11.9 ± 3.9 B 173.8 ± 39.1 B 65 Untreated control 26.7 ± 2.5 A 24.1 ± 4.2 A 31.6 ± 6.0 A 493.3 ± 50.8 A — F value 37.93 14.13 13.73 32.02 – p>F <0.0001 <0.0001 <0.0001 <0.0001 –
SE, standard error of the m ean. M eans in the sam e colum n followed by the sam e letters(s) are not statistically different, Tukey’s HSD (%=0.05).
1
% reduction in total aphid days per tiller, calculated by the Ruppel m ethod.
2
Table 2. Control of brown wheat mite with hand-applied insecticides, ARDEC, Fort Collins, CO. 2009.
MITES/SAMPLETILLER ± SE1
PRODUCT, FLUID OUNCES/ACRE 8 DAT 21 DAT MITE DAYS ± SE1 % CONTROL2
Lorsban Advanced, 8 fl oz 33.7 ± 4.8 B 4.3 ± 1.8 AB 1535.7 ± 61.7 B 70 Lorsban Advanced, 16 fl oz 68.7 ± 23.7 AB 4.5 ± 1.3 AB 1939.4 ± 266.9 AB 62 Warrior II 2.09 CS, 1.92 fl oz 88.3 ± 26.3 AB 1.2 ± 0.5 B 2140.6 ± 302.4 AB 59 Cobalt, 13 fl oz 99.8 ± 61.6 AB 1.7 ± 0.7 AB 2276.6 ± 711.0 AB 56 Dimethoate 4E, 12 fl oz 116.2 ± 64.7 AB 5.7 ± 1.7 AB 2494.4 ± 743.9 AB 52 Baythroid XL, 2.4 fl oz 160.7 ± 32.9 AB 12.2 ± 3.2 AB 3054.9 ± 384.3 AB 41 Mustang Max 0.8 E, 4 fl oz 195.5 ± 49.9 AB 6.8 ± 1.7 AB 3415.5 ± 569.2 AB 34
Ultor, 6 fl oz + Dyne-Amic + Baythroid XL 2.4 fl oz
223.2 ± 78.8 AB 8.5 ± 4.1 AB 3746.2 ± 919.0 AB 28
Baythroid XL, 2.4 fl oz + Dyne-Amic 278.0 ± 99.6 AB 9.7 ± 3.1 AB 4385.5 ± 1147.3 AB 15
Untreated control 335.3 ± 79.2 A 26.7 ± 12.2 A 5172.3 ± 986.8 A –
Ultor, 8 fl oz + Dyne-Amic + Baythroid XL 2.4 fl oz
344.5 ± 87.1 A 16.0 ± 5.6 AB 5197.8 ± 995.7 A –
Ultor, 4 fl oz + Dyne-Amic + Baythroid XL 2.4 fl oz
368.7 ± 142.6 A 15.2 ± 5.1 AB 5469.4 ± 1664.8 A –
F value 3.42 2.81 3.72
p>F 0.0011 0.0056 0.0005
SE, standard error of the m ean. M eans in the sam e colum n followed by the sam e letters(s) are not statistically different, Tukey’s HSD (%=0.05). % reduction in total m ite days, calculated by the Ruppel m ethod.
CONTROL OF RUSSIAN WHEAT APHID BIOTYPE RWA2 IN SPRING BARLEY WITH HAND-APPLIED INSECTICIDES, ARDEC, FORT COLLINS, CO, 2009
Jeff Rudolph, Terri Randolph, Frank Peairs, Tyler Keck, Marie Stiles, and Dylan Walker, Department of Bioagricultural Sciences and Pest Management
CONTROL OF RUSSIAN WHEAT APHID BIOTYPE RWA2 IN SPRING BARLEY WITH HAND-APPLIED INSECTICIDES, ARDEC,
2
FORT COLLINS, CO, 2009: Treatments were applied on 28 May 2009 with a ‘rickshaw-type' CO powered sprayer
calibrated to apply 20 gal/acre at 3 mph 32 psi through three 8004 (LF4) nozzles mounted on a 5.0 ft boom. Conditions were partly cloudy with N-NW wind at 3 mph and air temperature of 65EF (start) to 70EF (finish) at the time of
treatment. Plots were 6 rows (5.0 ft) by (30 ft) and were arranged in six replicates of a randomized, complete block design. Crop stage at application was early boot (Zadoks 39). The crop had been infested with greenhouse-reared aphids on 29 April 2009.
Treatments were evaluated by collecting 20 symptomatic tillers along the middle four rows of each plot 7, 14, and 21 days after treatment (DAT). Tiller samples were placed in Berlese funnels for 24 hours to extract aphids into alcohol for counting. Symptomatic tiller samples taken the day before treatment averaged 9.4 Russian wheat aphids per tiller. Aphid counts were subjected to analysis of variance and mean separation by Tukey's HSD test (%=0.05). Aphid counts at 7, 14, and 21 DAT were transformed by the log + 0.01 method prior to analysis. Original means are presented in Table 3. Total insect days for each treatment were calculated according to the method of Ruppel (Journal of Economic
Entomology 76: 375-7, 1983) and analyzed in the same manner, with original means presented in the table. Reductions in insect days were calculated by Abbott's (1925) formula: (percent reduction= ((untreated-treated)/untreated) x 100). Aphid pressure was less severe than in artificially-infested winter wheat experiments conducted this season, with about 7 aphids/tiller in the untreated control 21 DAT compared to 20 and 32 in the other trials. This was about a 50%
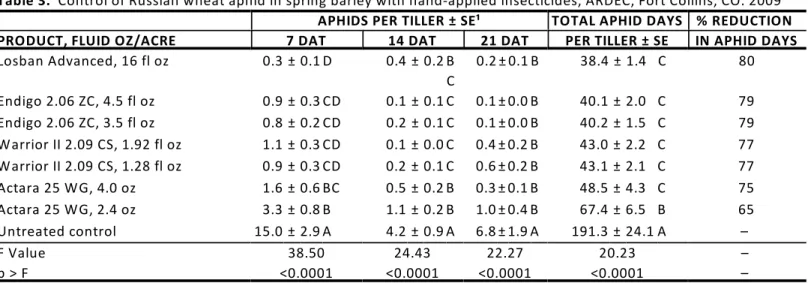
reduction from 7 DAT and was likely due to the substantial precipitation experienced post treatment. All treatments had fewer aphids per tiller 21 DAT and fewer total aphid days than the untreated control. No treatment provided 90% reduction in aphid days, which is considered good control of Russian wheat aphid in winter wheat.
Field History
Pest: Russian wheat aphid, Diuraphis noxia (Kurdjumov)
Cultivar: ‘Otis’
Planting Date: 17 March 2009
Irrigation: Post planting, linear move sprinkler with drop nozzles Crop History: Sweet corn in 2008
Herbicide: 16 oz MCPA per acre on 26 May 2009 Insecticide: None prior to experiment
Fertilization: None
Soil Type: Sandy clay loam
Table 3. Control of Russian wheat aphid in spring barley with hand-applied insecticides, ARDEC, Fort Collins, CO. 2009 APHIDS PER TILLER ± SE¹ TOTAL APHID DAYS % REDUCTION PRODUCT, FLUID OZ/ACRE 7 DAT 14 DAT 21 DAT PER TILLER ± SE IN APHID DAYS
Losban Advanced, 16 fl oz 0.3 ± 0.1 D 0.4 ± 0.2 B C 0.2 ± 0.1 B 38.4 ± 1.4 C 80 Endigo 2.06 ZC, 4.5 fl oz 0.9 ± 0.3 CD 0.1 ± 0.1 C 0.1 ± 0.0 B 40.1 ± 2.0 C 79 Endigo 2.06 ZC, 3.5 fl oz 0.8 ± 0.2 CD 0.2 ± 0.1 C 0.1 ± 0.0 B 40.2 ± 1.5 C 79 Warrior II 2.09 CS, 1.92 fl oz 1.1 ± 0.3 CD 0.1 ± 0.0 C 0.4 ± 0.2 B 43.0 ± 2.2 C 77 Warrior II 2.09 CS, 1.28 fl oz 0.9 ± 0.3 CD 0.2 ± 0.1 C 0.6 ± 0.2 B 43.1 ± 2.1 C 77 Actara 25 WG, 4.0 oz 1.6 ± 0.6 BC 0.5 ± 0.2 B 0.3 ± 0.1 B 48.5 ± 4.3 C 75 Actara 25 WG, 2.4 oz 3.3 ± 0.8 B 1.1 ± 0.2 B 1.0 ± 0.4 B 67.4 ± 6.5 B 65 Untreated control 15.0 ± 2.9 A 4.2 ± 0.9 A 6.8 ± 1.9 A 191.3 ± 24.1 A – F Value 38.50 24.43 22.27 20.23 – p > F <0.0001 <0.0001 <0.0001 <0.0001 –
¹SE, standard error of the m ean. M eans in the sam e colum n followed by the sam e letter(s) are not statistically different, Tukey's HSD (á=0.05) . ²% reduction in total aphid days per tiller, calculated by the Ruppel m ethod.
CONTROL OF BROWN WHEAT MITE AND RUSSIAN WHEAT APHID IN FIVE VARIETIES OF WINTER WHEAT, LAMAR, CO 2009
Thia Walker, Terri Randolph, Frank Peairs, Tyler Keck, and Dylan Walker
Department of Bioagricultural Sciences and Pest Management, Colorado State University
CONTROL OF BROWN WHEAT MITE AND RUSSIAN WHEAT APHID IN FIVE VARIETIES OF WINTER WHEAT, LAMAR, CO 2009: ‘Ripper’, ‘Hatcher’, ‘Hawken’, ‘Keota’, and ‘Bill Brown’ winter wheat varieties were planted on 30 August 2008, as
part of a Collaborative On-Farm Trial (COFT) with Stulp Farms. Single strip plots, ca. 42 ft. by 2640 ft, were planted on a 10” row spacing at a seeding rate of 45 lbs/acre. Dimethoate 4E, 0.25 lb (AI)/acre + Induce (nonionic wetter/spreader) 0.25% v/v, was applied on 7 March 2009 to seven 42 ft by 90 ft. plots per strip, using a John Deere 4720 sprayer equipped with TeeJet FX 20 nozzles mounted on a 90-foot boom at calibrated to apply five gal/acre at 30 psi.
Temperature was 45EF with wind speeds of 9-10 mph. Plant growth stage was Zadoks growth stage (GS) 25 (regrowth). Plots were retreated in the same manner on 20 March 2009, however, the dimethoate rate was increased to 0.375 lb (AI)/acre due to the presence of Russian wheat aphid. Temperature was 55EF with wind speeds of 3-5 mph. Plant growth stage was Zadoks GS 30 (pseudo stem elongation).
Brown wheat mite densities were evaluated at 0, 5, 12, 18 and 26 days after treatment (DAT) using a Vortis insect suction sampler. Five 5-second samples were taken at random within each plot. Composite plot samples were placed on paper plates in Berlese funnels for 72 hours to extract mites into alcohol for counting. Mite counts and mite days (calculated by the method of Ruppel, J. Econ. Entomol. 76: 375-377) were transformed by the square root + 0.5 method prior to analysis of variance and mean separation by Tukey’s HSD method (% = 0.05). Reductions in mite days were calculated by Abbott’s (1925) formula: (percent reduction = ((untreated-treated)/untreated) x 100) using the average total mite days of the untreated control. Original mite means are presented in the tables. Russian wheat aphid infestation was evaluated on 21 May 2009 by collecting 25 tillers at random from each plot, determing the percentage infested tillers, and placing the tillers in Berlese funnels for 24 hours to extract the aphids into alcohol for counting. Aphid counts were transformed by the log + 1 method prior to analysis of variance and means separation by Tukey’s HSD method (% = 0.05). Original means are presented in the tables.
Brown wheat mite densities were similar for all varieties prior to the Zadoks GS 25 treatment (Table 4). Varietal differences in brown wheat mite abundance were not observed except at 12 DAT, when fewer mites were collected in Hatcher plots than in Bill Brown plots. Dimethoate treatment reduced brown wheat mite abundance at 12, 18, and 26 DAT and total mite days. Overall reduction in total mite days was 94%.
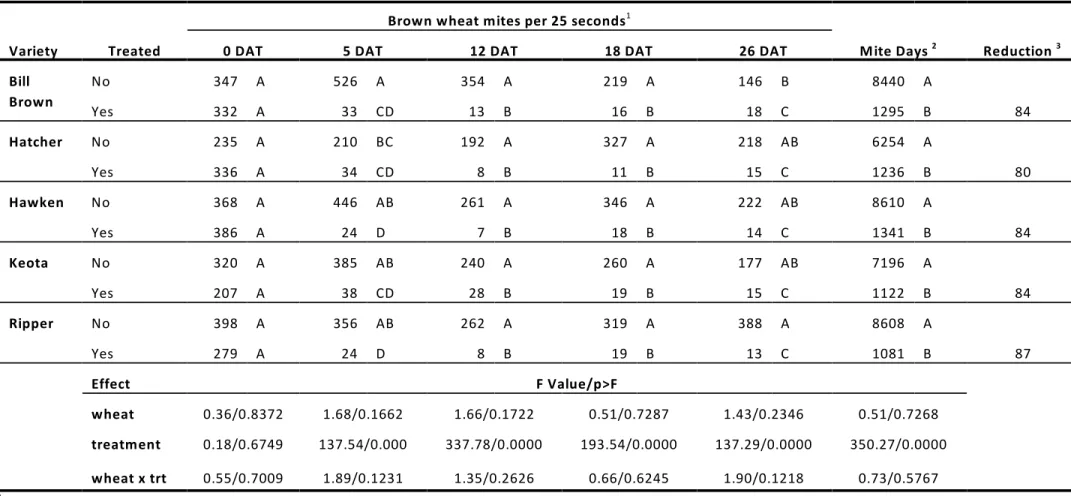
Brown wheat mite abundance was similar for all varieties prior to the Zadoks GS 30 treatment (Table 5). Varietal differences in brown wheat mite densities were not observed except at 12 DAT, when more mites were collected in Hatcher plots than in Bill Brown plots. Dimethoate treatment reduced brown wheat mite abundance at 5, 12, 18, and 26 DAT and total mite days. Overall reduction in total mite days was 84%. A 12-inch snow event occurred 6-7 DAT, and reduction of mites in the untreated plots from 5 DAT to 12 DAT was 32%. However, abundance increased from 12 DAT to 18 DAT. Yields were not obtained due to a 11 June hailstorm, so it is unknown if the greater reduction in mite days from the Zadoks 25 treatment would have been reflected in yield.
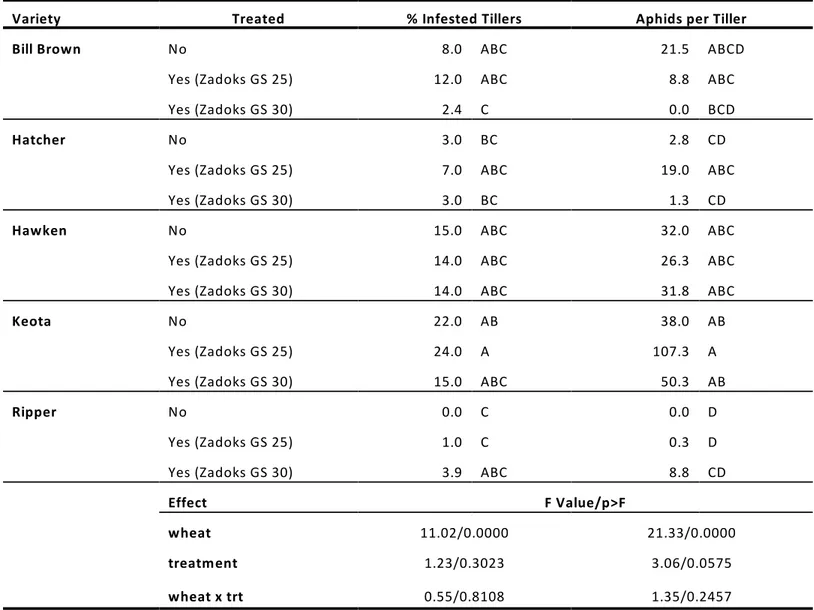
Fewer Russian wheat aphids were found in the Russian wheat aphid biotype RWA1-resistant varieties, Bill Brown, Hatcher, and Ripper, than in the susceptible varieties, Keota and Hawken (Table 6). Insecticide treatment effects were not observed, perhaps due to timing, which was earlier than is considered optimal for this aphid.
Field History
Field History (continued)
Irrigation: Dryland
Crop History: Wheat Fallow rotation, Fallow in 2008
Herbicide: 0.10 oz/acre Ally XP with fertilizer on 26 February 2009 Insecticide: None prior to experiment
Fertilization: 30 lb 10-40-0-10-1 (N-P-K-S-Zn) at planting, 10 gal/acre 28-0-0-5 on 26 February 2009
Soil Type: Wiley silt loam
Location: South of Lamar, Colorado. West side of Hwy 287; S31, T23S, R46W
Table 4. Brown wheat mites in five winter wheat varieties treated with dimethoate 0.25 .b (AI)/acre at Zadoks GS 25, Lamar, CO. 2009 Brown wheat mites per 25 seconds1
Variety Treated 0 DAT 5 DAT 12 DAT 18 DAT 26 DAT Mite Days 2 Reduction 3 Bill Brown No 67 A 113 AB 347 A 526 A 354 A 8201 A Yes 64 A 15 B 7 B 20 C 6 C 462 BC 94 Hatcher No 75 A 155 A 235 A 210 B 192 B 4887 A Yes 21 A 5 B 5 B 11 C 6 C 213 BC 95 Hawken No 31 A 99 A 368 A 446 AB 261 AB 7232 A Yes 54 A 9 AB 7 B 24 C 6 C 419 B 94 Keota No 45 A 162 A 320 A 385 AB 240 AB 6820 A Yes 57 A 10 B 16 B 17 C 10 C 469 BC 93 Ripper No 105 A 235 A 398 A 356 AB 262 AB 7803 A Yes 69 A 7 B 12 B 17 C 8 C 446 BC 94 Effect F Value/p>F wheat 1.10/0.3644 0.28/0.8872 0.64/0.6342 2.22/0.0779 1.67/0.1687 6.22/0.0003 treatment 0.15/0.6970 57.21/0.0000 131.12/0.0000 171.62/0.0000 423.23/0.0000 1227.8/0.0000 wheat x trt 0.96/0.4386 0.45/0.7746 0.30/0.8766 1.55/0.1990 1.47/0.2228 0.54/0.7097
Treatm ent m eans in the sam e colum n followed by the sam e letter are not statistically different, Tukey;s HSD (4=0.05).
1
Total m ite days calculated by the Ruppel m ethod (J. Econ. Entom ol. 76: 375-377).
2
% reduction in total m ite days calculated by Abbott’s m ethod, percent reduction = ((untreated-treated)/untreated) x 100.
Table 5. Brown wheat mites in five winter wheat varieties treated with dimethoate 0.375 lb (AI)/acre at Zadoks GS 30, Lamar, CO. 2009 Brown wheat mites per 25 seconds1
Variety Treated 0 DAT 5 DAT 12 DAT 18 DAT 26 DAT Mite Days 2 Reduction 3 Bill Brown No 347 A 526 A 354 A 219 A 146 B 8440 A Yes 332 A 33 CD 13 B 16 B 18 C 1295 B 84 Hatcher No 235 A 210 BC 192 A 327 A 218 AB 6254 A Yes 336 A 34 CD 8 B 11 B 15 C 1236 B 80 Hawken No 368 A 446 AB 261 A 346 A 222 AB 8610 A Yes 386 A 24 D 7 B 18 B 14 C 1341 B 84 Keota No 320 A 385 AB 240 A 260 A 177 AB 7196 A Yes 207 A 38 CD 28 B 19 B 15 C 1122 B 84 Ripper No 398 A 356 AB 262 A 319 A 388 A 8608 A Yes 279 A 24 D 8 B 19 B 13 C 1081 B 87 Effect F Value/p>F wheat 0.36/0.8372 1.68/0.1662 1.66/0.1722 0.51/0.7287 1.43/0.2346 0.51/0.7268 treatment 0.18/0.6749 137.54/0.000 337.78/0.0000 193.54/0.0000 137.29/0.0000 350.27/0.0000 wheat x trt 0.55/0.7009 1.89/0.1231 1.35/0.2626 0.66/0.6245 1.90/0.1218 0.73/0.5767
Treatm ent m eans in the sam e colum n followed by the sam e letter are not statistically different, Tukey;s HSD (4=0.05).
1
Total m ite days calculated by the Ruppel m ethod (J. Econ. Entom ol. 76: 375-377).
2
% reduction in total m ite days calculated by Abbott’s m ethod, percent reduction = ((untreated-treated)/untreated) x 100.
Table 6. Russian wheat aphids in five winter wheat varieties treated with dimethoate 0.25 lb (AI)/acre at Zadoks GS 25 or
dimethoate 0.375 lb (AI)/acre at Zadoks GS 30, Lamar, CO. 2009
Variety Treated % Infested Tillers Aphids per Tiller
Bill Brown No 8.0 ABC 21.5 ABCD
Yes (Zadoks GS 25) 12.0 ABC 8.8 ABC
Yes (Zadoks GS 30) 2.4 C 0.0 BCD
Hatcher No 3.0 BC 2.8 CD
Yes (Zadoks GS 25) 7.0 ABC 19.0 ABC
Yes (Zadoks GS 30) 3.0 BC 1.3 CD
Hawken No 15.0 ABC 32.0 ABC
Yes (Zadoks GS 25) 14.0 ABC 26.3 ABC
Yes (Zadoks GS 30) 14.0 ABC 31.8 ABC
Keota No 22.0 AB 38.0 AB
Yes (Zadoks GS 25) 24.0 A 107.3 A
Yes (Zadoks GS 30) 15.0 ABC 50.3 AB
Ripper No 0.0 C 0.0 D
Yes (Zadoks GS 25) 1.0 C 0.3 D
Yes (Zadoks GS 30) 3.9 ABC 8.8 CD
Effect F Value/p>F
wheat 11.02/0.0000 21.33/0.0000
treatment 1.23/0.3023 3.06/0.0575
wheat x trt 0.55/0.8108 1.35/0.2457
Treatm ent m eans in the sam e colum n followed by the sam e letter are not statistically different, Tukey;s HSD (4=0.05).
1
Total m ite days calculated by the Ruppel m ethod (J. Econ. Entom ol. 76: 375-377).
2
% reduction in total m ite days calculated by Abbott’s m ethod, percent reduction = ((untreated-treated)/untreated) x 100
EFFECT OF IRRIGATION, FERTILIZATION AND INSECTICIDE TREATMENT ON BROWN WHEAT MITE IN SPRINKLER-IRRIGATED WINTER WHEAT. HOLLY, CO, 2009.
Cynthia Walker, Frank Peairs, Tyler Keck, and Dylan Walker Department of Bioagricultural Sciences and Pest Management, Colorado State University.
EFFECT OF IRRIGATION, FERTILIZATION AND INSECTICIDE TREATMENT ON BROWN WHEAT MITE IN SPRINKLER-IRRIGATED WINTER WHEAT. HOLLY, CO, 2009: A 110 acre field of ‘Hatcher’ winter wheat was fertilized with 20 gallons
of 28-0-0 on 27 February 2009. The crop was then irrigated with 2acre inches of water, starting on 27 February and ending on 6 March 2009. Water was appied via i-Wob emitters, and the application amount was verified using five rain gauges placed along a transect starting from the pivot. On 24 March 2009, the east half of the field was treated with dimethoate, 0.375 lb. (AI)/acre + LI700 0.25% v/v, and the west half was treated with chlorpyrifos, 0.5 lb. (AI)/acre + LI700 0.25% v/v. Treatment was applied with a Weatherly 620 A aircraft equipped with 24 CP nozzles mounted on a 40 ft boom calibrated to apply 2 gal/acre at 110 mph over a 54 ft swath.
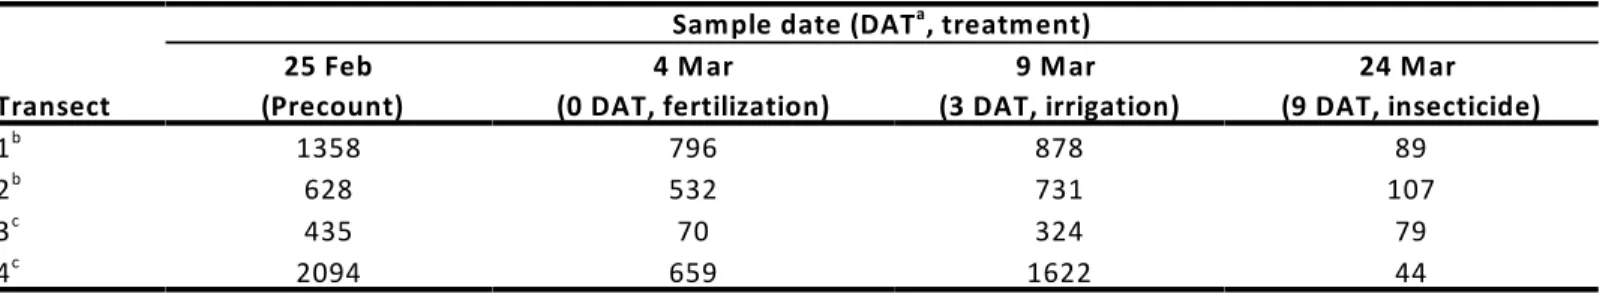
Treatments were sampled at five points along each of four transects from the pivot, which ran north, east, west and northwest from that point. Treatments were sampled on 4 March 2009, which was partway through the irrigation, resulting in two transects having been fertilized and two transects having been fertilized and irrigated. A second sample was taken on 9 March 2009 after the irrigation had been completed. Insecticide treatments were evaluated with samples taken on 24 March and 1 April 2009. Brown wheat mite abundance was determined using a Vortis insect suction sampler. Each of the five points along each transect was sampled by taking five two-second subsamples around each sample point. The composite samples were placed on paper plates and held in Berlese funnels for 72 hours to extract the mites into alcohol for counting. Total brown wheat mites were counted on the 25 February and 4 March sample dates, while larvae (first stage after hatch) were counted separately on the 9 March, 24 March and 1 April dates. This was done to determine the effect of treatment on the egg stage. Russian wheat aphid, Diuraphis noxia (Kurdjumov) and Banks grass mite, Oligonychus pratensis (Banks), were also collected by the Vortis and were extracted and counted in the same manner. Additionally, on 1 April 50 tillers were collected at each sample point. Russian wheat aphids were extracted and counted from this sample, as well. Insect and mite counts were compared using paired t-tests. Finally, two composite samples of tillers showing virus symptoms were collected. One was sent to the Colorado State University Plant Disease Diagnostic Lab, and the other was sent to sent to the Schutter Diagnostic Disease Lab at Montana State University to be tested for Barley Yellow Streak Mosaic Virus (BaYSMV) , a disease transmitted by brown wheat mite. Fertilization reduced brown wheat mite abundance, as did irrigation (Table 7). Mite mortality may have been related to the fertilizer causing mites to stick to the leaves. The effects of fertilization and irrigation were short-lived, and not of the magnitude caused by insecticide treatment. The reduction in brown wheat mite density was similar for the two insecticides (t=1.47, df=9, P=0.1757). Fewer adult mites were observed after insecticide treatments, with reductions greater than 99%. Larval counts seemed less affected by treatment, with reductions ranging from 63 - 96%, suggesting that, as expected, these insecticides have little ovicidal activity (Table 8).
Banks grass mite was present at low densities (Table 9). Fertilization and irrigated reduced mite abundance in three of four transects. The two insecticides were similar in their effect on this mite (t=0.60, df=9, P=0.5636).
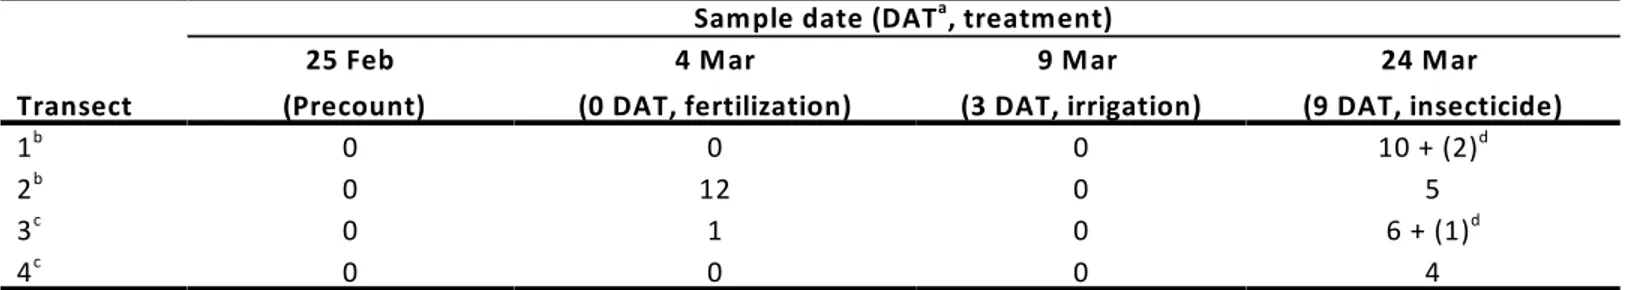
Russian wheat aphid also was present in densities too low to determine treatment effects (Table 10). No aphids were found in a 50 tillers sample collected from each of the two insecticide treated areas on 1 April 2009. Tissue samples collected at this time tested positive for Wheat Streak Mosaic Virus (WSMV) and negative for Cereal Yellow Dwarf Virus (formerly Barley Yellow Dwarf Virus-rpv), Barley Yellow Dwarf-pav, Barley Yellow Streak Mosaic Virus, High Plains Virus, and Triticum Mosaic Virus at Colorado State University and negative for Barley Yellow Streak Mosaic Virus at Montana State University. Crop yield was 61 bu/acre, based on a yield map provided by the grower-cooperator.
Field History
Pest: Brown wheat mite, Petrobia latens (Müller)
Russian wheat aphid, Diuraphis noxia (Kurdjumov) Banks grass mite, Olygonychus pratensis (Banks)
Cultivar: 'Hatcher'
Planting Date: 15 Sept 2008
Irrigation: Two inches applied 25 Feb - 6 March 2009, center pivot sprinkler with i-Wob nozzles Crop History: Wheat in 2008
Herbicide: 1 pt MCPA per acre
Insecticide: None prior to experiment
Fertilization: 20 gallons 28-0-0/acre applied 25 Feb 2009
Soil Type: Tivoli sand
Location: S of Holly, CO. S34,T23S, R42W, Prowers County
Table 7. Brown wheat mite abundance (total mites per transect) after fertilization, irrigation and insecticide treatment,
Holly, CO, 2009.
Sample date (DAT , treatment)a Transect 25 Feb (Precount) 4 Mar (0 DAT, fertilization) 9 Mar (3 DAT, irrigation) 24 Mar (9 DAT, insecticide) 1b 1358 796 878 89 2b 628 532 731 107 3c 435 70 324 79 4c 2094 659 1622 44
DAT, days after treatm ent
a
Not irrigated on the 4 M arch sam ple, treated with dim ethoate, 0.375 lb (AI)/acre.
b
Irrigated on the 4 M arch sam ple, treated with chlorpyrifos, 0.5 lb (AI)/acre.
c
Table 8. Brown wheat mite abundance (total larvae and other stages per transect) after fertilization, irrigation and
insecticide treatment, Holly, CO, 2009.
Sample date (DAT , treatment)a Transect 9 Mar (3 DAT fertilization) 24 Mar (9 DAT, insecticide) 9 Mar (3 DAT, fertilization) 24 Mar (9 DAT, insecticide) Stages Other Than Larvae Larvae
1b 342 1.2 536 88
2b 240 1.2 491 106
3c 111 0.8 213 79
4c 550 0.6 1072 44
DAT, days after treatm ent
a
Treated with dim ethoate, 0.375 lb (AI)/acre.
b
Treated with chlorpyrifos, 0.5 lb (AI)/acre.
Table 9. Banks grass mite abundance (total mites per transect) after fertilization, irrigation and insecticide treatment,
Holly, CO, 2009.
Sample date (DAT , treatment)a Transect 25 Feb (Precount) 4 Mar (0 DAT, fertilization) 9 Mar (3 DAT, irrigation) 24 Mar (9 DAT, insecticide) 1b 22 70 36 10 2b 74 23 23 5 3c 30 3 5 6 4c 83 18 21 4
DAT, days after treatm ent
a
Not irrigated on the 4 M arch sam ple, treated with dim ethoate, 0.375 lb (AI)/acre.
b
Irrigated on the 4 M arch sam ple, treated with chlorpyrifos, 0.5 lb (AI)/acre.
c
Table 10. Russian wheat aphid abundance (total aphids per transect) after fertilization, irrigation and insecticide
treatment, Holly, CO, 2009.
Sample date (DAT , treatment)a
Transect 25 Feb (Precount) 4 Mar (0 DAT, fertilization) 9 Mar (3 DAT, irrigation) 24 Mar (9 DAT, insecticide) 1b 0 0 0 10 + (2)d 2b 0 12 0 5 3c 0 1 0 6 + (1)d 4c 0 0 0 4
DAT, days after treatm ent
a
Not irrigated on the 4 M arch sam ple, treated with dim ethoate, 0.375 lb (AI)/acre.
b
Irrigated on the 4 M arch sam ple, treated with chlorpyrifos, 0.5 lb (AI)/acre.
c
Num ber of winged aphids in sam ple.
CONTROL OF BROWN WHEAT MITE IN IRRIGATED WINTER WHEAT, HILLROSE, CO, 2009.
Terri Randolph , Bruce Bosley , Frank Peairs , , Tyler Keck , and Dylan Walker .1 2 1 1 1
Department of Bioagricultural Sciences and Pest Management, Colorado State University
1
Lower South Platte Regional Agronomist, Colorado State University Extension
2
CONTROL OF BROWN WHEAT MITE IN IRRIGATED WINTER WHEAT, HILLROSE, CO, 2009. A field of winter wheat
heavily infested with brown wheat mite was treated with 0.25 lb (AI)/acre dimethoate 4E on 20 March 2009. Treatment was applied with a (sprayer details -boom width, # nozzles, psi, volume). Conditions at the time of treatment were warm and calm. An approximately 3 acre strip along the NW edge of the field was used as an untreated control. The crop was drought stressed and in Feekes GS 4.0 - 4.5.
Brown wheat mite abundance was evaluated by taking five 5-second samples with a Vortis Insect Suction Sampler at each sample site. Samples were placed on paper plates and placed in Berlese funnels for 3 days to extract the mites and recently hatched larvae into 70% alcohol for subsequent counting. Newly hatched larvae were counted separately. Three pretreatment samples were taken on 19 March 2009 at random sites throughout the field. On 3 April 2009, 14 days after treatment (DAT), the field was sampled along a transect, with eight samples in the untreated part of the field and eight samples in the treated area. Samples sites were spaced at approximately 30-foot intervals along the transect. The field was resampled in the same manner 35 DAT. On 9 July 2009 yields were measured from adjacent strips of 0.445 and 0.658 acres of the untreated and treated areas, respectively, using a weigh wagon.
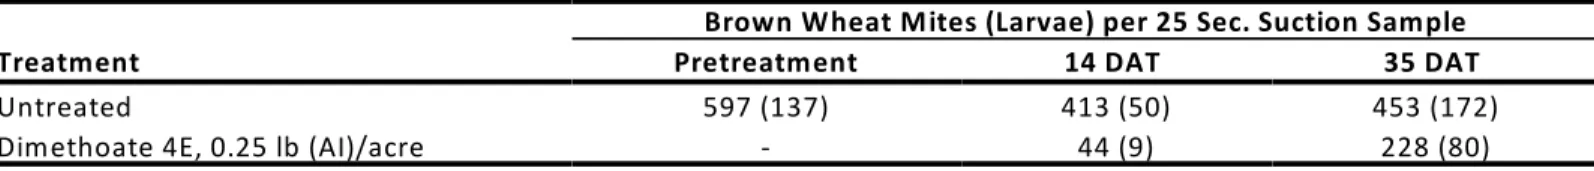
Mite abundance was reduced approximately 88% by treatment 11 DAT (Table 11). Reduction 32 DAT was 51%. Mite increase from 14 to 35 DAT was much greater in the treated area (581%) than in the untreated area (35%). Yield was 14 bushels (19%) lower in the untreated area than in the treated area (Table 12). Test weights were not affected by
treatment. However, this field had become infested with Russian wheat aphid and the entire field was treated with chlorpyrifos 0.5 lb (AI)/acre on ?? May 2009.
Field History
Pest: Brown wheat mite, Petrobia latens (Müller)
Cultivar: Not available
Planting Date: 2008
Irrigation: Not available
Crop History: Not available
Herbicide: Not available
Insecticide: None prior to experiment Fertilization: Not available
Soil Type: Not available
Table 11. Brown wheat mites plus larval mites per 25 seconds of suction sampling , Hillrose, Morgan County, CO, 2009. Brown Wheat Mites (Larvae) per 25 Sec. Suction Sample
Treatment Pretreatment 14 DAT 35 DAT
Untreated 597 (137) 413 (50) 453 (172)
Dimethoate 4E, 0.25 lb (AI)/acre - 44 (9) 228 (80)
Table 12. Effect of brown wheat mite treatment on yield and test weight, Hillrose, Morgan County, CO, 2009.
Treatment Bushels/acre Test Weight
Untreated 58.9 60.5
CONTROL OF ALFALFA INSECTS IN ALFALFA WITH HAND-APPLIED INSECTICIDES, ARDEC, FORT COLLINS, CO, 2009
Jeff Rudolph, Terri Randolph, Frank Peairs, Tyler Keck, Marie Stiles, Dylan Walker, and Chrissy Ward, Department of Bioagricultural Sciences and Pest Management
CONTROL OF ALFALFA INSECTS IN ALFALFA WITH HAND-APPLIED INSECTICIDES, ARDEC, FORT COLLINS, CO, 2009:
2
Early treatments were applied on 22 April 2009 with a ‘rickshaw-type’ CO powered sprayer calibrated to apply 20 gal/acre at 3 mph and 30 psi through six XR8002VS nozzles mounted on a 10.0 ft boom. Early treatments were made approximately when army cutworm treatments are applied in the region. This was done to determine the effect of army cutworm treatment in alfalfa on subsequent alfalfa weevil larval densities. All other treatments were applied in the same manner on 28 May 2009. Conditions were partly cloudy and calm, with temperatures of 65EF at the time of early treatments. Conditions were partly cloudy with N-NW winds at 3 - 8 mph and temperatures of 65 - 70EF at the time of the later treatments. Plots were 10.0 ft by 25.0 ft and arranged in six replicates of a randomized, complete block design. Untreated control and Warrior II, 0.03 lb (AI)/acre, plots were replicated 12 times for a more accurate comparison of treatment effects on yield (insect counts from six reps of each treatment were included in the analyses described below). The crop was 4 inches in height at the time of early treatments. The crop was in the prebud stage at the time of the later treatments.
Treatments were evaluated by taking ten 180 sweeps per plot with a standard 15 inch diameter insect net 7, 14 and 21N days after the later treatments (DAT). Alfalfa weevil larvae, alfalfa weevil adults and pea aphids were counted. A pretreatment sample was taken one day prior to the later treatments by taking 100, 180 sweeps across theN
experimental area. This sample averaged 8.1 and 17.6 alfalfa weevil larvae and pea aphids per sweep, respectively. Insect counts transformed by the square root + 0.5 method were used for analysis of variance and mean separation by Tukey’s HSD procedure (á=0.05). Original means are presented in the tables. Yields were measured on 19 June 2009 by harvesting 125 sq. ft. per plot with a Carter forage harvester. Yields were converted to lbs of dry hay per acre, using a subsample to determine moisture content. Yields of treated plots were compared to the untreated control using a paired t-test.
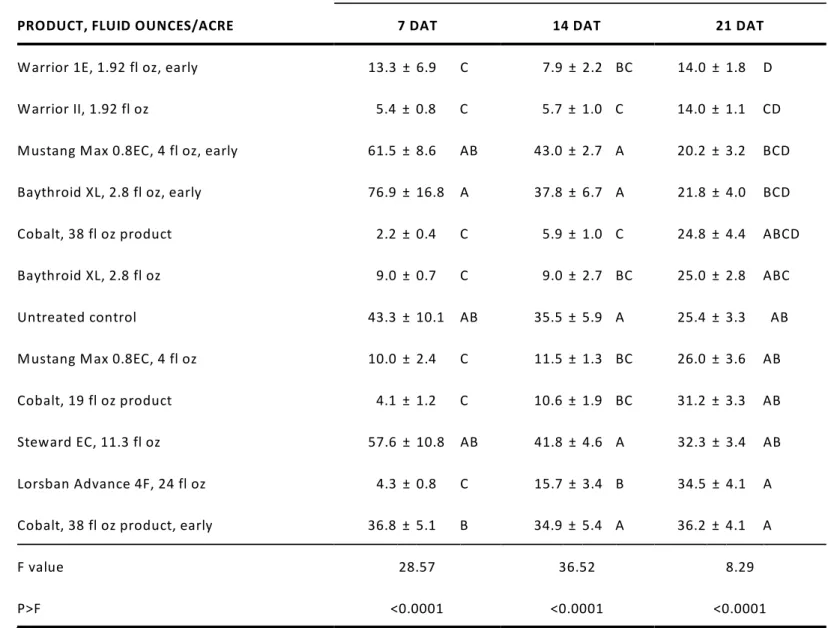
Pea aphid and alfalfa weevil larval densities were similar to those observed in 2008. All treatments had fewer alfalfa weevil larvae than the untreated control at 7 and 14 DAT (Table 13). Larval counts were close to zero in the untreated control at 21 DAT, so no treatment differences were observed. All treatments had fewer alfalfa weevil adults than the untreated control at 21 DAT (Table 14). Only the Warrior treatments had fewer pea aphids that the untreated control on all three sample dates. No phytotoxicity was observed with any treatment. The plots treated with Warrior II, 1.92 fl. oz./acre, yielded 4.6% more than the untreated control. The difference was not significant (df=1,22; F=1.67;
p>F=0.2094). Yield reduction measured since 1995 has averaged 6.9%, with a range of 0.0% to 20.9%.
Field History
Pests: Alfalfa weevil, Hypera postica (Gyllenhal)
Pea aphid, Acyrthosiphon pisum (Harris)
Cultivar: Unknown
Plant Stand: Thin, dry conditions
Irrigation: Linear move sprinkler with drop nozzles
Crop History: Alfalfa since 2002
Herbicide: None
Insecticide: None prior to experiment
Fertilization: None
Soil Type: Sandy clay loam
Table 13. Control of alfalfa weevil larvae, ARDEC, Fort Collins, CO, 2009.
ALFALFA WEEVIL LARVAE PER 180E SWEEP ± SEM1
PRODUCT, FLUID OUNCES/ACRE 7 DAT 14 DAT 21 DAT
Cobalt, 38 fl oz product 0.3 ± 0.1 E 0.0 ± 0.0 C 0.3 ± 0.0 A
Steward EC, 11.3 fl oz 0.9 ± 0.1 BCDE 0.2 ± 0.0 BC 0.4 ± 0.0 A
Warrior II, 1.92 fl oz 0.4 ± 0.1 DE 0.3 ± 0.0 BC 0.5 ± 0.1 A
Mustang Max 0.8EC, 4 fl oz 0.3 ± 0.1 DE 0.4 ± 0.0 BC 0.6 ± 0.1 A
Warrior 1E, 1.92 fl oz, early 0.4 ± 0.3 E 0.6 ± 0.1 BC 0.1 ± 0.0 A
Baythroid XL, 2.8 fl oz 0.4 ± 0.1 DE 0.6 ± 0.1 BC 0.2 ± 0.0 A
Cobalt, 19 fl oz product 1.6 ± 0.7 BCDE 0.8 ± 0.1 BC 0.3 ± 0.0 A
Baythroid XL, 2.8 fl oz, early 0.8 ± 0.1 CDE 1.2 ± 0.1 BC 0.4 ± 0.0 A
Cobalt, 38 fl oz product, early 2.2 ± 0.3 BC 1.2 ± 0.1 BC 0.5 ± 0.1 A
Mustang Max 0.8EC, 4 fl oz, early 2.6 ± 0.6 B 1.8 ± 0.2 B 0.6 ± 0.1 A
Lorsban Advance 4F, 24 fl oz 1.6 ± 0.4 BCD 2.5 ± 0.3 B 0.1 ± 0.0 A
Untreated control 38.1 ± 2.5 A 21.2 ± 2.1 A 0.2 ± 0.0 A
F value 134.72 38.76 1.89
p>F <0.0001 <0.0001 0.0608
SEM , standard error of the m ean. M eans in the sam e colum n followed by the sam e letter(s) are not statistically different, Tukey’s HSD (á=0.05).
Table 14. Control of alfalfa weevil adults, ARDEC, Fort Collins, CO, 2009.
ALFALFA WEEVIL ADULTS PER 180E SWEEP ± SEM1
PRODUCT, FLUID OUNCES/ACRE 7 DAT 14 DAT 21 DAT
Baythroid XL, 2.8 fl oz 0.0 ± 0.0 B 0.0 ± 0.0 A 0.1 ± 0.0 E
Mustang Max 0.8EC, 4 fl oz 0.0 ± 0.0 B 0.1 ± 0.0 A 0.1 ± 0.0 E
Cobalt, 38 fl oz product 0.0 ± 0.0 B 0.0 ± 0.0 A 0.1 ± 0.0 E
Warrior II, 1.92 fl oz 0.0 ± 0.0 B 0.0 ± 0.0 A 0.1 ± 0.0 E
Warrior 1E, 1.92 fl oz, early 0.0 ± 0.0 AB 0.0 ± 0.0 A 0.2 ± 0.0 DE
Cobalt, 19 fl oz product 0.0 ± 0.0 AB 0.0 ± 0.0 A 0.2 ± 0.0 CDE
Steward EC, 11.3 fl oz 0.0 ± 0.0 B 0.0 ± 0.0 A 0.4 ± 0.0 BCDE
Baythroid XL, 2.8 fl oz, early 0.1 ± 0.0 AB 0.0 ± 0.0 A 0.7 ± 0.1 BCD
Lorsban Advance 4F, 24 fl oz 0.0 ± 0.0 AB 0.1 ± 0.1 A 0.8 ± 0.1 BC
Cobalt, 38 fl oz product, early 0.1 ± 0.0 AB 0.1 ± 0.0 A 1.0 ± 0.1 B
Mustang Max 0.8EC, 4 fl oz, early 0.1 ± 0.0 A 0.0 ± 0.0 A 1.1 ± 0.1 B
Untreated control 0.1 ± 0.0 AB 0.0 ± 0.0 A 8.7 ± 1.8 A
F value 3.43 1.97 58.33
P>F 0.0011 0.0499 0.00
SEM , standard error of the m ean. M eans in the sam e colum n followed by the sam e letter(s) are not statistically different, Tukey’s HSD (á=0.05).
Table 15. Control of pea aphids, ARDEC, Fort Collins, CO, 2009.
PEA APHIDS PER 180E SWEEP ± SEM1
PRODUCT, FLUID OUNCES/ACRE 7 DAT 14 DAT 21 DAT
Warrior 1E, 1.92 fl oz, early 13.3 ± 6.9 C 7.9 ± 2.2 BC 14.0 ± 1.8 D
Warrior II, 1.92 fl oz 5.4 ± 0.8 C 5.7 ± 1.0 C 14.0 ± 1.1 CD
Mustang Max 0.8EC, 4 fl oz, early 61.5 ± 8.6 AB 43.0 ± 2.7 A 20.2 ± 3.2 BCD
Baythroid XL, 2.8 fl oz, early 76.9 ± 16.8 A 37.8 ± 6.7 A 21.8 ± 4.0 BCD
Cobalt, 38 fl oz product 2.2 ± 0.4 C 5.9 ± 1.0 C 24.8 ± 4.4 ABCD
Baythroid XL, 2.8 fl oz 9.0 ± 0.7 C 9.0 ± 2.7 BC 25.0 ± 2.8 ABC
Untreated control 43.3 ± 10.1 AB 35.5 ± 5.9 A 25.4 ± 3.3 AB
Mustang Max 0.8EC, 4 fl oz 10.0 ± 2.4 C 11.5 ± 1.3 BC 26.0 ± 3.6 AB
Cobalt, 19 fl oz product 4.1 ± 1.2 C 10.6 ± 1.9 BC 31.2 ± 3.3 AB
Steward EC, 11.3 fl oz 57.6 ± 10.8 AB 41.8 ± 4.6 A 32.3 ± 3.4 AB
Lorsban Advance 4F, 24 fl oz 4.3 ± 0.8 C 15.7 ± 3.4 B 34.5 ± 4.1 A
Cobalt, 38 fl oz product, early 36.8 ± 5.1 B 34.9 ± 5.4 A 36.2 ± 4.1 A
F value 28.57 36.52 8.29
P>F <0.0001 <0.0001 <0.0001
SEM , standard error of the m ean. M eans in the sam e colum n followed by the sam e letter(s) are not statistically different, Tukey’s HSD (á=0.05).
CONTROL OF WESTERN CORN ROOTWORM IN FIELD CORN WITH PLANTING-TIME SOIL INSECTICIDES, SEED TREATMENTS, AND PLANT-INCORPORATED PROTECTANTS, ARDEC, FORT COLLINS, CO, 2009
Jeff Rudolph, Terri Randolph, Frank Peairs, Tyler Keck, Marie Stiles, and Dylan Walker, Department of Bioagricultural Sciences and Pest Management
CONTROL OF WESTERN CORN ROOTWORM IN FIELD CORN WITH PLANTING-TIME SOIL INSECTICIDES, SEED TREATMENTS, AND PLANT-INCORPORATED PROTECTANTS, ARDEC, FORT COLLINS, CO, 2009: All treatments were
planted on 20 May 2009. Granular insecticides were applied with modified Wintersteiger meters mounted on a two-row John Deere Maxi-Merge planter. T-band granular applications were applied with a 4-inch John Deere spreader located
2
between the disk openers and the press wheel. Liquids were applied in a t-band using a CO -powered sprayer calibrated to apply 2.8 gal/acre through one 8001VS nozzle directed between the disk openers and the presswheel. Plots in the first experiment were one 25-ft row arranged in six replicates of a randomized complete block design, while plots in the other three experiments were four 25-ft rows arranged in four replicates of a randomized complete block design. Treatments in the first experiment were evaluated by digging three plants per plot on 10 July 2008. The roots were washed and the damage rated on the 0-3 node injury scale
(http://www.ent.iastate.edu/pest/rootworm/nodeinjury/nodeinjury.html). Treatments in the second experiment were evaluated in the same manner, except three plants were taken from both the first and fourth row of the plot. Plot means were used for analysis of variance and mean separation by Tukey’s HSD method (á=0.05). Treatment efficiency was determined as the percentage of total plants per treatment having a root rating of 0.25 or lower.
Yield was evaluated in the other three experiment by hand-harvesting the center two rows of the plot on 21-22 October 2009. Plot weights were converted to bushels per acre at 15.5% moisture and analyzed as described above.
Western corn rootworm pressure was somewhat lower than in 2008 (0.94 and 1.18 untreated control ratings in two 2008 experiments), with the untreated controls averaging 0.18 in four 2009 experiements. In the first and second experiments, but not the third and fourth, all treatments were less damaged than the untreated control (Table 16 - 19). No treatment effects on yield were observed. No phytotoxicity was observed with any treatment.
Field History
Pest: Western corn rootworm, Diabrotica virgifera virgifera LeConte
Cultivar: N40T, unless otherwise indicated
Planting Date: 20 May 2009
Plant Population: Not available
Irrigation: Furrow
Crop History: Corn in 2008
Insecticide: None prior to experiment
Soil Type: Clay loam
Table 16. Commercial and experimental treatments for control of western corn rootworm, ARDEC, Fort Collins, CO.
2009.
TREATMENT ROOT RATING1 EFFICIENCY2
Counter 15G, 8 oz/1000 ft 0.00 B 100 Force 3G, 4 oz/1000 ft 0.00 B 100 Force 3G, 5 oz/1000 ft 0.00 B 100 Cruiser, 0.25 mg/seed 0.00 B 100 YieldGard® Rootworm 0.00 B 100 Herculex® RW 0.01 B 100 Agrisure® RW 0.03 B 100 Aztec 2.1G 6.7 oz/1000 ft 0.03 B 100 Lorsban 15G, 8 oz/1000 ft 0.04 B 94
Force CS, 0.57 fl oz/1000 row ft 0.06 B 94
Cruiser, 1.25 mg/seed 0.06 B 94
Force CS, 0.46 fl oz/1000 row ft 0.08 B 94
Untreated 0.53 A 50
F value 6.66 —
p>F 0.00 —
0-3 node dam age scale. M eans followed by the sam e letter(s) are not statistically different, Tukey’s HSD (á=0.05).
1
Percentage of 18 plants (total in 6 replicates of a treatm ent) with a rating of 0.25 or less.
2
Table 17. Agrisure® events (hybrid background A) combined with Force CS for control of western corn rootworm,
ARDEC, Fort Collins, CO. 2009.
TREATMENT ROOT RATING1 EFFICIENCY2 BUSHELS PER ACRE @15.5%
Agrisure® 3000 GT + Force CS, 0.35 fl oz/1000 row ft 0.00 B 100 129.6
Agrisure® 3000 GT + Force CS, 0.46 fl oz/1000 row ft 0.01 B 100 123.5
Agrisure® GT/CB/LL + Force CS, 0.46 fl oz/1000 row ft 0.02 AB 100 120.7
Agrisure® 3000 GT 0.03 AB 100 129.2
Agrisure® GT/CB/LL + Force CS, 0.35 fl oz/1000 row ft 0.03 AB 100 135.1
Agrisure® GT/CB/LL 0.10 A 83 126.4
F value 3.26 — 1.13
p>F 0.0343 — 0.3876
0-3 node dam age scale. M eans followed by the sam e letter(s) are not statistically different, Tukey’s HSD (á=0.05).
1
Percentage of 24 plants (total in 4 replicates of a treatm ent) with a rating of 0.25 or less.
Table 18. Agrisure® events (hybrid background B) combined with Force CS for control of western corn rootworm,
ARDEC, Fort Collins, CO. 2009.
TREATMENT ROOT RATING1 EFFICIENCY2 BUSHELS PER ACRE @15.5%
Agrisure® RW/CB/LL + Force CS, 0.46 fl oz/1000 row ft 0.00 B 100 162.4
Agrisure® GT/CB/LL + Force CS, 0.35 fl oz/1000 row ft 0.01 AB 100 157.8
Agrisure® RW/CB/LL 0.01 AB 100 153.2
Agrisure® RW/CB/LL + Force CS, 0.35 fl oz/1000 row ft 0.01 AB 100 164.9
Agrisure® GT/CB/LL + Force CS, 0.46 fl oz/1000 row ft 0.02 AB 100 146.2
Agrisure® GT/CB/LL 0.03 A 100 150.9
F value 2.64 — 1.48
p>F 0.0663 — 2.548
0-3 node dam age scale. M eans followed by the sam e letter(s) are not statistically different, Tukey’s HSD (á=0.05).
1
Percentage of 24 plants (total in 4 replicates of a treatm ent) with a rating of 0.25 or less.
2
Table 19. Agrisure® events (hybrid background C) combined with Force CS for control of western corn rootworm,
ARDEC, Fort Collins, CO. 2009.
TREATMENT ROOT RATING1 EFFICIENCY2 BUSHELS PER ACRE @15.5%
Agrisure® 3000 GT + Force CS, 0.35 fl oz/1000 row ft 0.00 A 100 147.9
Agrisure® 3000 GT 0.01 A 100 130.6
Agrisure® GT/CB/LL + Force CS, 0.35 fl oz/1000 row ft 0.02 A 100 136.4
Agrisure® 3000 GT + Force CS, 0.46 fl oz/1000 row ft 0.03 A 100 142.6
Agrisure® GT/CB/LL + Force CS, 0.46 fl oz/1000 row ft 0.05 A 92 127.4
Agrisure® GT/CB/LL 0.09 A 88 125.8
F value 2.07 — 2.96
p>F 0.1263 — 0.0469
0-3 node dam age scale. M eans followed by the sam e letter(s) are not statistically different, Tukey’s HSD (á=0.05).
1
Percentage of 24 plants (total in 4 replicates of a treatm ent) with a rating of 0.25 or less.
CONTROL OF SPIDER MITES IN CORN WITH HAND-APPLIED INSECTICIDES AND MITICIDES, ARDEC, FORT COLLINS, CO, 2009
Terri Randolph, Jeff Rudolph, Frank Peairs, Tyler Keck, and Dylan Walker, Department of Bioagricultural Sciences and Pest Management
CONTROL OF SPIDER MITES IN CORN WITH HAND-APPLIED INSECTICIDES AND MITICIDES, ARDEC, FORT COLLINS, CO, 2008: Early treatments were applied on 29 July 2009 using a 2 row boom sprayer mounted on a backpack and calibrated
to deliver 17.8 gal/acre at 32 psi with five XR8002VS nozzles. All other treatments were applied in the same manner on 13 August 2009. Conditions were cloudy, N wind 3-6 mph, and 68 - 80EF temperature at the time of early treatments. Precipitation within 24 h of treatment totaled 0.46 inches. Conditions were cloudy, calm and 72EF temperature at the time of late treatments. Early treatments were applied at tassel emergence and late treatments were applied at brown silk. Plots were 25 ft by two rows (30 inch centers) and were arranged in six replicates of a randomized complete block design. Plots were separated from neighboring plots by a single buffer row. Plots were infested on 8 July 2009 by laying mite infested corn leaves, collected earlier that day at Grand Junction, CO, across the corn plants on which mites were to be counted. On 10 July 2009, the experimental area was treated with permethrin 3.2E, 0.2 lb (AI)/acre to control mite predators and promote spider mite abundance.
Treatments were evaluated by collecting three leaves (ear leaf, 2nd leaf above the ear, 2nd leaf below the ear) from two plants per plot -2, 7, 14, 21, and 28 days after the later treatments (DAT). Corn leaves were placed in Berlese funnels for 24 hours to extract mites into alcohol for counting. Extracted mites were identified as Banks grass mite or twospotted spider mite and counted, however, only three twospotted spider mites were found. Mite counts were transformed by the square root + 0.5 method prior to analysis. Counts were subjected to analysis of variance and mean separation by Tukey's HSD method (%=0.05), where appropriate. Untransformed mite counts are presented in Table 20.
Mite densities were extremely low (Table 20). July was the fifth wettest on record, and temperatures were below average. Results are generally inconclusive, given the low mite abundance. There was no phytotoxicity observed for any treatment.
Field History:
Pest: Banks grass mite, Oligonychus pratensis (Banks)
Cultivar: N40T
Planting Date: May 2008 Plant Population: 28,000
Irrigation: Linear move sprinkler
Crop History: Field corn in 2008
Herbicide: Roundup UltraMax, 23 fl.oz./acre + 32 oz Harness + 1% ammonium sulphate on 29 June 2009 Fertilization: 120 N, 80 P
Soil Type: Clay loam
Table 20. Control of Banks grass mite in field corn with hand-applied miticides, ARDEC, Fort Collins, CO, 2009. BANKS GRASS MITES PER LEAF ± SEM1
PRODUCT, FLUID OUNCES/ACRE -2 DAT2 14 DAT 21 DAT 28 DAT TOTAL MITE DAYS3
Zeal, 1.5 oz (early) 0.19 ± 0.07 0.11 ± 0.07 0.17 ± 0.04 0.89 ± 0.20 23.77 ± 0.77
Oberon 4SC, 4 oz + 16 oz COC (early) 0.14 ± 0.11 0.14 ± 0.14 0.03 ± 0.03 1.67 ± 0.59 23.91 ± 1.24
Oberon 4SC, 6 oz + 16 oz COC (early) 0.08 ± 0.06 0.17 ± 0.11 0.28 ± 0.06 1.03 ± 0.28 23.98 ± 0.65
Zeal, 3.0 oz (early) 0.19 ± 0.16 0.06 ± 0.04 0.25 ± 0.10 0.92 ± 0.26 24.05 ± 0.75
Comite II, 36 oz, + dimethoate 4E, 16 oz (early) 0.08 ± 0.08 0.00 ± 0.00 0.19 ± 0.10 2.28 ± 1.21 24.09 ± 1.19 Oberon 4SC, 6 oz + 16 oz COC + 32 oz UAN 28%
(early)
0.00 ± 0.00 0.06 ± 0.04 0.14 ± 0.08 3.06 ± 1.26 24.33 ± 1.18
GWN-1708, 15 oz (early) 0.19 ± 0.12 0.03 ± 0.03 0.19 ± 0.11 2.00 ± 1.12 24.45 ± 1.23
Zeal, 2.0 oz (early) 0.08 ± 0.06 0.14 ± 0.09 0.19 ± 0.08 1.58 ± 0.57 24.62 ± 0.74
GWN-9815, 3.3 oz + COC @ 1% v/v (early) 0.06 ± 0.04 0.17 ± 0.07 0.22 ± 0.10 1.67 ± 0.74 24.63 ± 0.94
Oberon 4SC, 6 oz + dimethoate 4E, 16 oz (early) 0.08 ± 0.06 0.08 ± 0.04 0.17 ± 0.07 1.44 ± 0.42 24.76 ± 1.09
Hero, 10.3 oz + 16 oz COC 0.11 ± 0.04 0.08 ± 0.04 0.36 ± 0.23 1.94 ± 1.06 24.81 ± 0.95
Zeal, 1.0 oz (early) 0.08 ± 0.06 0.06 ± 0.06 0.14 ± 0.07 2.69 ± 0.69 24.88 ± 1.03
Onager 1E, 10 oz (early) 0.03 ± 0.03 0.03 ± 0.03 0.31 ± 0.15 2.69 ± 1.28 25.00 ± 1.44
Zeal, 2.5 oz (early) 0.25 ± 0.08 0.06 ± 0.04 0.14 ± 0.05 2.56 ± 1.31 25.17 ± 0.75
GWN-9814, 5 oz + COC @ 1% v/v (early) 0.14 ± 0.09 0.08 ± 0.04 0.11 ± 0.06 2.39 ± 1.25 25.24 ± 1.66
Hero, 5.15 oz + dimethoate 4E, 16 oz + 16 oz COC, early, repeat at 10 days
0.14 ± 0.07 0.06 ± 0.04 0.31 ± 0.12 1.97 ± 0.59 25.27 ± 1.37
GWN-2106, 2.2 oz + COC @ 1% v/v (early) 0.33 ± 0.11 0.08 ± 0.04 0.14 ± 0.09 2.69 ± 1.38 25.74 ± 1.19
GWN-1708, 22 oz (early) 0.33 ± 0.25 0.06 ± 0.04 0.19 ± 0.10 2.53 ± 1.48 26.28 ± 2.06
Hero, 10.3 oz + 2.85 oz Oberon 4SC + 16 oz COC 0.36 ± 0.19 0.11 ± 0.06 0.25 ± 0.11 1.81 ± 0.55 27.49 ± 1.72
UNTREATED 0.50 ± 0.34 0.56 ± 0.49 1.78 ± 1.58 1.69 ± 0.53 30.91 ± 6.17
F value 1.21 0.73 0.9 0.52 0.75
p>F 0.2701 0.779 0.5863 0.9478 0.7534
SEM , standard error of the m ean. 1
DAT, days after treatm ent. 2
calculated according the m ethod of Ruppel (Journal of Econom ic Entom ology 76: 375-7, 1983)
2009 PEST SURVEY RESULTS Table 21. 2008 pheromone trap catches at ARDEC and Briggsdale.
ARDEC – 1070 Briggsdale3
Species Total Caught2 Trapping Period Total Caught2 Trapping Period2
Army cutworm 21 (23) 8/27 - 10/14 95( (18) 8/28 - 10/16
Banded sunflower moth 73 (0) 6/25 - 10/14 – –
Corn earworm 1 (1) 7/2 - 9/3 – –
European corn borer (IA)1 19 (54) 5/27 - 9/24 – –
Fall armyworm 359(80) 6/25 - 10/14 – –
Pale western cutworm 99 (94) 8/27 - 10/14 207 (144) 8/28 - 10/16
Southwestern corn borer (0) 5/26 - 8/17 – –
Sunflower moth 15 (1) 6/25 - 9/11 – –
Western bean cutworm 10 (3) 6/25 - 9/24 – –
IA, Iowa strain
1
–, not trapped. Num ber in () is 2008 total catch for com parison
2
Briggsdale counts are the average of two traps
3
Table 22. Wheathead armyworm pheromone trap catches, 2009.
Week1 ARDEC Briggsdale Merino Holly Lamar
1 – – – 0 0 2 – – – 0 0 3 – – – 96 0 4 0 40 – 72 464 5 8 213 – 54 98 6 11 109 – 70 72 7 23 28 129 28 24 8 11 45 75 71 22 9 14 14 28 46 15 10 12 24 8 5 12 11 0 2 5 3 2 12 4 2 3 0 0 13 2 3 9 – – 14 1 12 3 – – 15 10 14 – – – 16 13 61 – – – 17 15 55 – – – 18 5 17 – – – 19 0 3 – – – 20 9 69 16 – – 21 1 6 – – – 22 1 4 – 0 0 23 0 6 – 0 0 24 0 1 – 0 0 25 0 2 – 2 0 26 0 0 – 2 0 27 0 0 – 0 0 28 0 0 – 0 0
INSECTICIDE PERFORMANCE SUMMARIES
Insecticide performance in a single experiment can be quite misleading. To aid in the interpretation of the tests included in this report, long term performance summaries are presented below for insecticides that are registered for use in Colorado and that have been tested at least three times. These summaries are complete through 2009.
Table 23. Performance of planting-time insecticides against western corn rootworm, 1987-2009, in northern Colorado
INSECTICIDE IOWA 1-6 ROOT RATING1
AZTEC 2.1G 2.6 (31)
COUNTER 15G 2.6 (33)
CRUISER, 1.25 mg (AI)/seed 2.5 (8)
FORCE 1.5G (8 OZ) or 3G (4 OZ) 2.6 (30)
FORCE 3G (5 OZ) 2.4 (10) FORTRESS 5G 2.8 (14) LORSBAN 15G 3.0 (28) PONCHO, 1.25 mg (AI)/seed 2.4 (8) THIMET 20G 3.4 (15) UNTREATED CONTROL 4.1 (37)
Rated on a scale of 1-6, where 1 is least dam aged, and 6 is m ost heavily dam aged. Num ber in parenthesis is num ber of tim es tested for average. Planting tim e
1
treatm ents averaged over application m ethods.
Table 24. Performance of cultivation insecticide treatments against western corn rootworm, 1987-2005, in northern
Colorado.
INSECTICIDE IOWA 1-6 ROOT RATING1
COUNTER 15G 2.8 (21)
FORCE 3G 3.3 (8)
LORSBAN 15G 3.1 (17)
THIMET 20G 2.9 (19)
UNTREATED CONTROL 4.2 (24)
Rated on a scale of 1-6, where 1 is least dam aged, and 6 is m ost heavily dam aged. Num ber in () is num ber of tim es tested for average. Planting tim e treatm ents
1
Table 25. Insecticide performance against first generation European corn borer, 1982-2002, in northeast Colorado.
MATERIAL LB/ACRE METHOD1 % CONTROL2
DIPEL ES 1 QT + OIL I 91 (4)
LORSBAN 15G 1.00 (AI) A 77 (5)
LORSBAN 15G 1.00 (AI) C 80 (6)
LORSBAN 4E 1.0 (AI) I 87 (9)
POUNCE 3.2E 0.15 (AI) I 88 (11)
POUNCE 1.5G 0.15 (AI) C 87 (4)
POUNCE 1.5G 0.15 (AI) A 73 (7)
THIMET 20G 1.00 (AI) C 77 (4)
THIMET 20G 1.00 (AI) A 73 (3)
WARRIOR 1E 0.03 (AI I 85 (4)
A = Aerial, C = Cultivator, I = Center Pivot Injection. CSU does not recom m end the use of aerially-applied liquids for control of first generation European corn borer.
1
Num bers in () indicate that percent control is the average of that m any trials.
2
Table 26. Insecticide performance against western bean cutworm, 1982-2002, in northeast Colorado.
MATERIAL LB (AI)/ACRE METHOD1 % CONTROL2
CAPTURE 2E 0.08 A 98 (5) CAPTURE 2E 0.08 I 98 (5) LORSBAN 4E 0.75 A 88 (4) LORSBAN 4E 0.75 I 94 (4) POUNCE 3.2E 0.05 A 97 (7) POUNCE 3.2E 0.05 I 99 (5) WARRIOR 1E (T) 0.02 I 96 (2)
A = Aerial, I = Center Pivot Injection
1
Num bers in () indicated that percent control is average of that m any trials.
Table 27. Insecticide performance against second generation European corn borer, 1982-2002, in northeast Colorado.
MATERIAL LB (AI)/ACRE METHOD1 % CONTROL2
DIPEL ES 1 QT PRODUCT I 56 (16) CAPTURE 2E 0.08 A 85 (8) CAPTURE 2E 0.08 I 86 (14) LORSBAN 4E 1.00 A 41 (6) LORSBAN 4E 1.00 + OIL I 72 (14) PENNCAP M 1.00 A 74 (7) PENNCAP M 1.00 I 74 (8) POUNCE 3.2E 0.15 I 74 (11) WARRIOR 1E 0.03 A 81 (4) WARRIOR 1E 0.03 I 78 (4)
A = Aerial, I = Center Pivot Injection
1
Num bers in () indicate how m any trials are averaged.
2
Table 28. Performance of hand-applied insecticides against alfalfa weevil larvae, 1984-2009, in northern Colorado.
PRODUCT LB (AI)/ACRE % CONTROL AT 2 WK1
BAYTHROID XL 0.022 97 (15) BAYTHROID XL 0.022 (early)3 96 (6) LORSBAN 4E 0.75 93 (23) LORSBAN 4E 1.00 96 (6) LORSBAN 4E 0.50 83 (10) MUSTANG MAX 0.025 93 (5)
MUSTANG MAX 0.025 (early)3 89 (7)
PENNCAP M 0.75 84 (11) PERMETHRIN 2 0.10 67 (7) PERMETHRIN 2 0.20 80 (4) STEWARD 0.065 80 (7) STEWARD 0.110 86 (5) WARRIOR 1E or T 0.02 92 (18) WARRIOR 1E or T 0.02 (early)3 68 (5) WARRIOR 1E or T 0.03 94 (8)
Num ber in () indicates num ber of years included in average.
1
Includes both Am bush 2E and Pounce 3.2E.
2
Early treatm ent tim ed for control of arm y cutworm
Table 29. Control of Russian wheat aphid with hand-applied insecticides in winter wheat, 1986-2009 .1 PRODUCT LB (AI)/ACRE
TESTS WITH > 90%
CONTROL 21 DAT TOTAL TESTS % TESTS
LORSBAN 4E 0.50 28 45 62 COBALT 13 FL OZ 2 3 67 DIMETHOATE 4E 0.375 8 39 21 MUSTANG MAX 0.025 2 7 29 PENNCAP M 0.75 3 18 17 LORSBAN 4E 0.25 10 27 37 LORSBAN 4E 0.38 5 6 83 WARRIOR 1E 0.03 4 17 24
Includes data from several states.
1
Table 30. Control of spider mites in artificially-infested corn with hand-applied insecticides, ARDEC, 1993-2008. PRODUCT LB (AI)/ACRE % REDUCTION IN TOTAL MITE DAYS1
CAPTURE 2E 0.08 52 (14) CAPTURE 2E + DIMETHOATE 4E 0.08 + 0.50 65 (14) COMITE II 1.64 14 (14) COMITE II 2.53 49 (6) COMITE II + DIMETHOATE 4E 1.64 + 0.50 53 (10) DIMETHOATE 4E 0.50 42 (14) OBERON 4SC 0.135 55 (3) ONAGER 1E 0.094 86 (3)
Num ber in () indicates num ber of tests represented in average. 2009 data not included.
1
Table 31. Control of sunflower stem weevil with planting and cultivation treatments, USDA Central Great Plains
Research Station, 1998-2002.
PRODUCT LB (AI)/ACRE TIMING % CONTROL1
BAYTHROID 2E 0.02 CULTIVATION 57 (3) BAYTHROID 2E 0.03 CULTIVATION 52 (3) FURADAN 4F 0.75 CULTIVATION 61 (3) FURADAN 4F 1.0 PLANTING 91 (3) FURADAN 4F 1.0 CULTIVATION 83 (3) WARRIOR 1E 0.02 CULTIVATION 63 (3) WARRIOR 1E 0.03 CULTIVATION 61 (3)
Num ber in () indicates num ber of tests represented in average.
ACKNOWLEDGMENTS
2009 COOPERATORS
PROJECT LOCATION COOPERATORS
Alfalfa insecticides ARDEC, Fort Collins Reg Koll, Chris Fryrear, Mark Collins
Barley insecticides ARDEC, Fort Collins Reg Koll, Chris Fryrear, Mark Collins
Corn rootworm control ARDEC, Fort Collins Reg Koll, Chris Fryrear, Mark Collins
Western bean cutworm control ARDEC, Fort Collins Reg Koll, Chris Fryrear, Mark Collins, Larry
Appel, Randy Haarburg
Corn spider mite control ARDEC, Fort Collins Reg Koll, Chris Fryrear, Mark Collins,
Kent Davis
Russian wheat aphid control ARDEC, Fort Collins Reg Koll, Chris Fryrear, Mark Collins
Brown wheat mite control Lamar Bruce Bosley, Pete Krone, Brian Pabst,
Jeremy Stulp, Thia Walker
Pheromone traps ARDEC, Fort Collins Reg Koll, Chris Fryrear, Mark Collins
Pheromone traps Briggsdale Stan Cass
Suction trap Briggsdale Stan Cass
Suction trap Akron (Central Great Plains Research
Station)
Mike Koch, Merle Vigil
Suction trap Lamar Jeremy Stulp, Thia Walker
PRODUCT INDEX
Actara
Manufacturer: Syngenta
EPA Registration Number: 100-938
Active ingredient(s) (common name): thiamethoxam. . . 5 Agrisure® CB/LL
Manufacturer: Syngenta Genetic insertion event Bt11
Active ingredient(s) (common name): Cry1Ab. . . 20, 21 Agrisure® 3000 GT
Manufacturer: Syngenta
Genetic insertion events Bt11 + MIR604
Active ingredient(s) (common name): mCry3Aa. . . 20, 21 Agrisure® RW
Manufacturer: Syngenta Genetic insertion event MIR604
Active ingredient(s) (common name): mCry3Aa. . . 20, 21 Ambush 2E
AMVAC
EPA Registration Number: 5481-502
Active ingredient(s) (common name): cypermethrin. . . 29 Aztec 2.1G Manufacturer: Bayer
EPA Registration Number: 264-813
Active ingredient(s) (common name): 2% BAY NAT 7484, 0.1% cyfluthrin. . . 20, 27 Baythroid 2E
Manufacturer: Bayer
EPA Registration Number: 264-745
Active ingredient(s) (common name): cyfluthrin. . . 30 Baythroid XL
Manufacturer: Bayer
EPA Registration Number: 264-840
Active ingredient(s) (common name): beta-cyfluthrin.. . . 3, 16-18, 29 Capture 2E
Manufacturer: FMC
EPA Registration Number: 279-3069
Active ingredient(s) (common name): bifenthrin. . . 28-30 Cobalt
Comite II
Manufacturer: Chemtura
EPA Registration Number: 400-154
Active ingredient(s) (common name): propargite. . . 23, 30 Counter 15G
Manufacturer: AMVAC
EPA Registration Number: 5481-545
Active ingredient(s) (common name): terbufos. . . 20, 27 Cruiser
Manufacturer: Syngenta
EPA Registration Number: 100-941
Active ingredient(s) (common name): thiamethoxam. . . 20, 27 Dimethoate 4E
Manufacturer: generic
EPA Registration Number: various
Active ingredient(s) (common name): dimethoate. . . 3, 6, 13, 14, 23, 30 Dipel ES
Manufacturer: Valent
EPA Registration Number: 73049-17
Active ingredient(s) (common name): Bacillus thuringiensis. . . 28, 29 Endigo
Manufacturer: Syngenta
EPA Registration Number: 100-1276
Active ingredient(s) (common name): lambda cyhalothrin + thiamethoxam.. . . 5 Force 3G
Manufacturer: Syngenta
EPA Registration Number: 100-1025
Active ingredient(s) (common name): tefluthrin. . . 20, 27 Force CS
Manufacturer: Syngenta
EPA Registration Number: 100-1253
Active ingredient(s) (common name): tefluthrin. . . 20, 21 Furadan 4F
Manufacturer: FMC
EPA Registration Number: 279-2876
Active ingredient(s) (common name): carbofuran. . . 30 GWN-1708
Manufacturer: Gowan
EPA Registration Number: experimental
GWN-2106
Manufacturer: Gowan
EPA Registration Number: experimental
Active ingredient(s) (common name): experimental. . . 23 GWN-9814
Manufacturer: Gowan
EPA Registration Number: experimental
Active ingredient(s) (common name): experimental. . . 23 GWN-9815
Manufacturer: Gowan
EPA Registration Number: experimental
Active ingredient(s) (common name): experimental. . . 23 Herculex® RW
Manufacturer: Dupont
Genetic insertion event DAS 59122-7
Active ingredient(s) (common name): Cry34/35Ab1. . . 20 Hero
Manufacturer: FMC
EPA Registration Number: 279-3315
Active ingredient(s) (common name): bifenthrin + zeta cypermethrin. . . 23 Lorsban 15G
Manufacturer: Dow Agrosciences EPA Registration Number: 62719-220
Active ingredient(s) (common name): chlorpyrifos. . . 20, 27, 28 Lorsban 4E
Manufacturer: Dow Agrosciences EPA Registration Number: 62719-220
Active ingredient(s) (common name): chlorpyrifos. . . 28-30 Lorsban Advanced
Manufacturer: Dow Agrosciences EPA Registration Number: 62719-591
Active ingredient(s) (common name): chlorpyrifos. . . 2, 3 Mustang Max
Manufacturer: FMC
EPA Registration Number: 279-3249
Active ingredient(s) (common name): zeta cypermethrin. . . 3, 16-18, 29, 30 Oberon 4SC
Manufacturer: Bayer
Onager 1E
Manufacturer: Gowan
EPA Registration Number: 10163-277
Active ingredient(s) (common name): hexythiazox. . . 23, 30 Penncap M
Manufacturer: United Phosphorus, Inc. EPA Registration Number: 70506-193
Active ingredient(s) (common name): methyl parathion.. . . 29, 30 Poncho
Manufacturer: Bayer
EPA Registration Number: 264-789-7501
Active ingredient(s) (common name) : clothianidin. . . 27 Pounce 1.5G
Manufacturer: FMC
EPA Registration Number: 279-3059
Active ingredient(s) (common name) : permethrin. . . 28 Pounce 3.2E
Manufacturer: FMC
EPA Registration Number: 279-3014
Active ingredient(s) (common name) : permethrin. . . 28, 29 Steward
Manufacturer: du Pont
EPA Registration Number: 352-598
Active ingredient(s) (common name): indoxacarb. . . 16-18, 29 Thimet 20G
Manufacturer: Amvac and Micro-Flo
EPA Registration Number: 5481-530 and 241-257-51036
Active ingredient(s) (common name): phorate. . . 27, 28 Ultor
Manufacturer: Bayer CropScience EPA Registration Number: 264-1065
Active ingredient(s) (common name): spirotetramat. . . 3 Warrior
Manufacturer: Syngenta
EPA Registration Number: 10182-434
Active ingredient(s) (common name): lambda-cyhalothrin.. . . 3, 5, 15-18, 28-30 Warrior II
Manufacturer: Syngenta
EPA Registration Number: 10182-1295
YieldGard® Rootworm Manufacturer: Monsanto Genetic insertion event MON863