Technical ,Report TROl -9
Agrkzuttural Experiment Station Cooperative Extension Arkansas Valley Research Center November 2001co10 0
a
!ltzkRcR Gniversity REJPoR!mArkansas Valley Research Center Roclry Ford, Colorado
Staff (719) 254-6312 Frank C. Schweissing Michael E. Bartolo Marvin A. Wallace Kevin J. Tanabe Superintendent-Entomologist Vegetable Crops Scientist
Farm Technician Research Associate
Cooperators
Whitney Cranshaw, Entomologist, C.S.U., Department of Bioagricultural Sciences and Pest Management Jessica Davis, C.S.U., Ext. Soil Specialist, Department of Soil and Crop Sciences
Orren Doss, Graduate Research Assistant, C.S.U., Department of Soil and Crop Sciences
Tii Damato, Res. Associate, C.S.U., Department of BioagriculturaJ Sciences and Pest Management Jim Hain, Res. Associate, C.S.U., Department of Soil and Crop Sciences
Ardell Halvorson, Soil Scientist, USDA-ARS
Jerry Johnson, Crop Scientist, C.S.U., Department of Soil and Crop Sciences
Kevin Larson, Crop Scientist, C.S.U., Plainsman Research Center and Dept. of Soil & Crop Sciences Scott Nissen, Weed Scientist, C.S.U., Department of Bioagricukural Sciences and Pest Management
Curtis Reule, Soil Scientist, USDA-ARS
Howard Schwartz, Plant Pathologist, C.S.U., Dept. of Bioagricultural Sciences and Pest Management Jim Valliant, Irrigation Specialist, Rocky Ford, Cooperative Extension
Colorado State University Fort Collins, Colorado Agricultural Experiment Station
Administration
Lee E. Sommers
Director, Agricultural Experiment Station 491-5371
S. Lee Gray, Head
Department of Agricultural and Resource Economics 491-6325
J. Daryl Tatum, Head
Department of Animal Sciences 491-6672
Thomas 0. Holtzer, Head
Department of Bioagricultural Sciences and Pest Management 491-5261
Stephen J. Wallner, Head
Department of Horticulture & Landscape Architecture 491-7019
James S. Quick, Head
Department of Soil and Crop Sciences 491-6517
2001 Advisory Counoil Nembers ESSANSAS VALLNX PzsNAB.cH cF.NTER
Roari FORD, COLORADO
Bent crow1ey El Paso Huerfano Las BniIrms OteK, PtOwrS PU&lO
2001 Nd Blackbwzn, 6619 Hwy. 194, Las Animas, co 81054
2002 Bill Elder, 13500 Hwy. 50, INS Animus, co 81054
2003 *Kim Siefkasi, 32470 Cty. Rd. 10, Las ~nimaa, Co 81054
2001 Dean Rusher, 7995 Co. In. 10, Olnay Gps., CO 81062
2002 *John Tomky, 8800 Hwy. 96, Olnay Bps., CO 81062
2003 Chairman Natt Heeimerich, 5325 In. 9 l/2. Olney Spa., CO 81062
2001 *Toby Wells, 11120 Old Pueblo Road, Fountain, co 80817
2002 Jay Frost, 18350 Hanovwr Rd., Pueblo, co 81008
2003 Glen Emel, 10465 RBA Bnad, Fountain, co 80817
2001 Dennis Busuh, R.S.B. Rt., Box 410, wa1senburg, co 81089
2002 'John Kimbral, P.O. Box 452, Walsanburg, CO 81089
2003 Bob Fruese, P.O. Box 226, Gardner, co 81040
2001 *Paul E. Philpott, Box 3, Hoelms, co 81046
2002 Art Winter, 20110 CR 75.0, Trinidad, CO 81082
2003 Allen Nicol, BOX 63, HA, co 81046
2001 *Dennis Caldwell, 25026 Road 19, Rocky Ford, CO 81067
2002 Vice Chum. Robert Gerlar, 25320 Road BB, La Junta, CO 81050
2003 Hana Hansen, 36606 Raad JJ, La Junta, CO 81050
2001 Jim Ellenbergar, 36101 Rd. 11 l/2, Lamar, CO 81052
2002 *Robert Jensen, 23485 Co. Rd. 00.5, Granada, CO 81041
2003 Leonard Rink, 21971 Hwy. 196, Bristol, co 81028
2001 Dan G@nova, 33200 South Rd, Pueblo, co 81006
2002 *Robert Wiley, 52699 Olson Rd., Boone, co 81025
2003 Clay Fitxsimwns, 36038 So. Rd., Pueblo, co 81006
*Research conmlittee hselrber
Bent Crowley El Parr0 Iiuerfano Las Animas OtelO prowers Pueblo NRCS
John Ming, Fair Grounds, Las Animas, CO 81054 , Courthouas Anna%, Ordway, CO 81063 Jonathan Vrabec, 305 5. Union, co. Bps., Co 80910
, 401 Main, suite 101, Wahcnburg, co 81089 Robert Goebel, 200 E. lst, Rm. 101, Trinidad, CO 81082 Bill Hanwok, Box 190, Rocky Ford, CO 81067
,lOOl S. Main, Lamar, co 81052
Frank Sobolik, Courthouse, Pueblo, co 81003
John Knapp, 29563 Road 18, Rocky Ford, CO 81067 Lorenz Sutherland, 318 Lacy, La Junta, co 81050
2000 Climatic Conditions Arkansas Valley Research Center
Colorado State University Rocky Ford, Colorado
Frank C. Schweissing, Superintendent
This year, for the first time since 1994, the annual precipitation of 9.60” was lower then the long term average (100 yrs.) of 11.86”. Only March and October had significantly increased precipitation amounts, while all the other months were about normal or below. Crop production was good, leaf disease problems were greatly reduced and fall harvest and field work was carried on without interruption.
The frost free period of 153 days between April 25 and September 25 was 5 days shorter than average. Based on a nominal growing season of May 1 to September 30, there were 3099 corn growing degree days which is above normal.
2000 Frost Dates 2000 Average Frost Dates* Average*
Frost Free Frost Free
Last Spring First Fall Period Last Spring First Fall Period
Frost Frost (days) Frost Frost (days)
April 25 - 31°F Sept. 25 - 28°F 153 May 1 October 6 158
I I - _ _
-Month Temperature(F”) Precipitation Snowfall 10 Year Precip.
---___ - I - ~ - -- - - _ -1- _ _ - _ - - _ - _
High Low Avg. 2000 Normal* Total
inches inches Inches Jan. 69 2 35.6 0.33 0.26 Feb 76 10 42.7 0.19 0.30 March 80 17 46.7 2.09 0.69 April 89 22 56.2 0.81 1.32 May 102 32 65.5 0.79 1.83 June 99 50 72.9 0.60 1.39 July 104 53 78.2 1.25 2.00 Aug. 103 53 77.8 1.36 1.58 Sept. 101 28 68.2 0.77 0.91 Oct. 93 29 55.3 1.13 0.79 Nov. 67 -1 34.3 0.11 0.47 Dec. 66 2 29.7 0.17 0.32 4.5 T 7.8 2.0 2.5 3.0 1991 1992 1993 1994 1995 1996 1997 1998 1999 2000 Average 11.62 12.33 11.36 11.42 12.64 13.38 18.58 14.62 19.96 9.60 13.55 Total *Average - 100 years 9.60 11.66 19.8
TABLE OF CONTENTS FIELD CROPS
A l f a l f a - V a r i e t y T r i a l s Alfalfa Weevil-Chemical Control B e a n - P i n t o V a r i e t y T r i a l Corn-Gram & Silage Variety Trial Corn-Nitrogen M a n a g e m e n t Corn-Southwestern Corn Borer C o r n - W e e d M a n a g e m e n t smal1orain-wiirwheat
Sorghum-Forage Variety Trial SorghumGrecnbug Management S o y b e a n - V a r i e t y T r i a l ... ... ... ... ... ... 1 .3 .5 .8 11 15 20 22 25 21 32 onion-VarietyTrial . . . 34 Onion-SalinityTrial . . . 37 Onion-DiseaseManagement . . . 39 Onion-Tbrips Management . . . 43 Onion-WeedMaoagement . . . ..4 7 This research is partially supported by the Arkansas Valley Onion Growers Ass’n. Cabbage-Insect Management . . . 51
caotaloqJe-Early Prodwtion . . . 55
Car&-Disease T r i a l . . . 58
Pepper Variety Trials . . . 60
Hybrid Chili Establishment Trial . . . 63
Jalapeno Establishment Trial . . . 65
Bell Pepper Production Trial . . . 67
Spinach-Hail s i m u l a t i o n . . . 69 T o m a t o - P r o d u c t i o n T r i a l s . . . 71 W a t e r m e l o n - E a r l y T r i a l . . . 78 Watermelon-Transplanted vs Seeded . . . 80 Z i n n i a - S t a n d L o s s . . . 81 2001-RESEARCHPLOTS .._..____..._... 8 4
Compiled by Frank C. Scbweissing
NOTICE
This publication is a compilatiticn of reports dealing with maearcb carried out at the Arkansas Valley Research Center. Trade names have been used to simplify reporting, but mention of a prcdwt does not cmstihxte a recomm&ation nor an endorsement by Colorado State University or the Colorado Agricukural Experiment Stat& In particular, pesticides mentioned in various reports may not be
2000 Alfalfa Variety Performance Trial Report
Location: Arkansas Valley Research Center Rocky Ford, Colorado 8 1067
Stand Established: 1997
Investigator: Frank C. Schweissing, Superintendent
This is a report of the results of an irrigated al&l& variety trial, planted August 29,1997, after 3 years of production. There are 25 commercial and 3 public varieties included in this test.
The trial was set up as a randomized complete block, with four replications (1 plot = 75 sq. ft.). The trial was managed to reduce thctors which limit production. The plot area was fertilized with 150 lbs. of P, 0, per acre prior to planting and again on November 30, 1998. Sencor 75DF .50 lbs. + &unoxone .3 1 lbs. were applied on February 16, 1999 and again on February 22,200O for weed _ control. Furadan 4E at .75 lbs. AI/Acre was applied on April 21,1999 and at 1.0 AI/Acre on April
252000 for alfalfa weevil control.
Harvest dates in 2000 were May 30, July 5, August 10 and Sept. 28. Rainfall from April through September was 5.6 inches compared to a long term average of 9 inches. Growing degree days were above normal. The trial was irrigated prior to the first cutting and after each of the four cuttings. All four cuttings were harvested without rain damage. The average trial yield was 5.84 tons, compared to 6.35 tons in 1999 and 5.36 tons in 1998. Significant differences in yield were observed for all cuttings and total yield.
Yields are reported in oven-dry weights. If you want to determine yields with a particular percent moisture, divide dry yield by 1 .OO minus the percent moisture you usually sell your hay. Example: (Yield/l.OO-.lO) = yield with 10% moisture or 5.34/.90 = 6.49 tons.
Decisions as to variety selection in addition to being based on highest yields should include consideration of those varieties which are maintaining or increasing their average yields compared to the first two years,
Forage
ColoraBo from 1998-00.ields of 28 alfalfa varieties at the Arkansas Valley Research Center, Rocky Ford,
Variety Brand or Source
1st 2nd 3rd 4th
cut cut cut cut 2000 1999 1998 3 Yr. 5130 II5 8/10 9/28 Total Total Total Total
__- --tollslacre’ I_~-_ WL 334RK 3L104* DK 143 Millennia Leaf Master Citron 3i Pinnacle Depend + EV TMF Multiplier II Big Horn ZX 9352* WL 324 5454 DK 142 631 ZC 9651* Adler WL 325HQ Innovator + Z Afiinity+Z DK127 LahOlltan 630 Haygrazer 6L271* ZC 9650’ Ranger W-L Research Novsrtis
DeKalb Genetics Corp. uhion seed co. Union Seed Co. Great Plains Research Arkansas Valley Seed Agripro seeds Inc. Mycagen Seeds Cargill Hybrid Seeds ABI Alfalfa
Germain’s
F’ioneer Hi-Bred Int’l. DeKalb Genetics Corp. Gal-St seed co.
ABI Alfalfa America’s Alfdfas Gemain’s
America’s Alfalfas America’s Alfalfas DeKalb Genetics Corp USDA NV-AES Garst seed co. Great Plains Research Arkansas Valley Seed ABI Altilt% USDA NE-AES USDA WI-AES Column Mean LSD (0.05) cv C%) 1.87 1.82 1.57 1.39 6.65 7.03 5.86 19.54 1.95 1.74 1.40 1.34 6.43 6.59 5.57 18.59 1.88 1.68 1.36 1.42 6.34 6.52 5.67 18.53 2.02 1.70 1.37 1.27 6.36 6.64 5.48 18.48 1.99 1.72 1.43 1.30 6.44 6.73 5.24 18.41 1.90 1.61 1.39 1.34 6.24 6.62 5.54 18.40 1.98 1.66 1.49 1.23 6.36 6.48 5.35 18.19 1.56 1.58 1.35 1.25 5.74 6.63 5.60 17.97 1.77 1.62 1.28 1.33 6.00 6.40 5.44 17.84 1.76 1.56 1.38 1.24 5.94 6.48 5.41 17.83 1.50 1.53 1.38 1.40 5.81 6.55 5.46 17.82 1.50 1.49 1.34 1.21 5.54 6.52 5.74 17.80 1.57 1.62 1.35 1.32 5.86 6.49 5.43 17.78 1.79 1.57 1.29 1.30 5.95 6.47 5.34 17.76 1.61 1.58 1.24 1.26 5.69 6.60 5.38 17.67 1.46 1.57 1.34 1.29 5.66 6.39 5.56 17.61 1.54 1.64 1.35 1.34 5.87 6.29 5.24 17.40 1.86 1.62 1.38 1.26 6.12 6.01 5.25 17.38 1.62 1.54 1.32 1.20 5.68 6.27 5.43 17.38 1.46 1.46 1.25 1.27 5.44 6.44 5.44 17.32 1.67 1.61 1.30 1.16 5.74 6.29 5.24 17.27 1.77 1.68 1.38 1.25 6.08 6.06 5.13 17.27 1.57 1.60 1.28 1.19 5.64 6.19 5.34 17.17 1.61 1.42 1.29 1.14 5.46 6.24 5.29 16.99 1.40 1.58 1.32 1.44 5.74 6.11 5.07 16.92 1.42 1.55 1.28 1.21 5.46 6.01 5.30 16.77 1.28 1.28 1.17 1.10 4.83 5.25 4.71 14.79 1.29 1.25 1.01 0.94 4.49 5.39 4.51 14.39 1.67 1.58 1.33 1.26 5.84 6.35 5.36 17.55 0.24 0.12 0.13 0.13 0.48 0.42 0.31 0.94 10.28 5.32 6.82 7.25 5.90 4.72 4.12 3.79 ‘Yields calculated on oven-dry basis.
Planted August 29,1997 at 10.2 Ibs. seed/acre
*Jndicates eqerimental entry
Chemical Control of the Alfalfa Weevil - 2000 Arkansas Valley Research Center
Colorado State University Rocky Ford, Colorado
September 1999 through February 2000 was substantially drier than usual followed by March with three times the average (0.67”) precipitation, then a very dry April and May, with less than halfthe long time average precipitation. Weevil populations were low and present for only a limited period of time. Economically important damage did not occur and at tlrst cutting was not visible. Pea aphid populations were low.
Methods and Materiab - Supporting information relating to the test plots is given below. All insecticide treatments were applied May 4,2000, at the time the plants were about 20” tall, with a compressed air sprayer mounted on bicycle wheels, Chemicals were applied at the rate of
25 g.p.a. at a pressure of 28 p.s.i.
Alfalfa weevil populations were determined by using a 15” sweep net covering a 180 degree arc. Two separate sweeps were taken in each plot per sampling date. This constitutes 6 sweep counts per treatment from 3 replications. Pea aphid counts were also obtained.
- All insecticides reduced the larval populations below the untreated plots. Visible damage was not apparent at harvest time. Pea aphids were not a factor.
Test Plot Information - 2000
Purpose - To evaluate the effectiveness of selected insecticides for control of the alfalfa
weevil, Hflruposticu (Gyll.) on alfalfa.
Data - 1. Sweep counts
Plots - 39.6’ X 11’ = 435.6 sq. ft. = lOO* acre
Design - Randomized complete block (3 replications) Variety - AV-177 - 4th year
Herbicide - Sencor 75 DF .50 lbs. + Grantoxone 2.5E .47 lbs. AI/Acre - 2/22/00 Plant - March 12, 1997
Treat - May 4,200O
Table l.-Chemical control of the alfalfa weevil on alfalfa. Sweep Counts. Arkansas Valley Research Center, C.S.U., Rocky Ford, Colorado. 2000.
Al2 Alfalfa Weevil3
Treatment’ Pea Aphid
Larvae Adults 5112 5120 S/12 5120 5112 s/20 Mustang 1.5EW ,038 0.00 0.00 3.50 14.17 2.67 2.33 Furadan 4F .50 0.00 0.17 0.67 4.67 0.33 1.33 Warrior T 1cs .03 0.17 0.00 3.17 6.67 0.17 0.00 Steward 1.25sc .ll 0.17 0.17 0.00 1.00 9.17 3.67 Mustang 1.5EW .05 0.17 0.17 4.17 12.33 0.33 0.67 Baythoid 2E ,035 0.33 1.00 1.67 8.50 0.50 2.00 Steward 1.25SC .065 0.83 0.50 0.33 1.33 5.00 5.67 Lorsban 4E .50 0.83 1.00 1.00 6.67 0.33 1.67 Pounce 3.2E .20 4.33 1.17 4.17 7.17 0.00 0.33 Lannate LV 2.4WS .90 3.83 2.33 2.33 1.50 2.50 2.17 Untreated 13.67 3.17 1.00 2.00 7.17 3.17
1 - Treated - May 4,200O + Dyne-Amic .005 VN 2 - Active ingredient per acre
2000 Pinto Bean Trials Arkansas Valley Research Center
This is the eleventh year a variety trial has been can&xl out at this Center in recent years. Yields were much above average and the overall trial average was the second highest in the eleven years. This years trial average was 3664 lbs./acre compared to 2749 Ibs./acre in 1999,2134 lbs./acre in 1998, 2461 lbs./acre in 1997, 3419 lbs./acre in 1996, 1599 lbs./acre in 1995, 3 129 lbs./acre in 1994, 3760 lbs./acre in 1993,254l lbs./acre in 1992,236l lbs./acre in 1991 and 2848 lbs./acre in 1990.
This was a below average year for precipitation at 9.60”. Rust was not a problem
Test Plot Information
Purpose - To evaluate the inherent genetic ability of selected pinto bean varieties to yield under irrigated conditions of the Arkansas Valley.
Data - 1. Yields 2. Test Weight 3. Seeds/lb. Plot - 32’ X lO’(4 rows)
Design - Randomized complete blocks (3 replications) Varieties - 30 entries
Fertilizer - 50 lbs. P,OJAcre + 10 lbs. N/acre - 10120199
Herbicide - Treflan 4E .75 Ibs.AI/Acre + Eptam 7E 3.0 lbs.AI/Acre - 6/3/00 Insecticide - none Fungicide - none
Plant - June 5.2000
Irrigate - 6/6,6/13,7/8,7/27, 817
Harvest - Cut - 902, Lii-9/14; Thresh - 9/14 - 4 rows, 32’ long
Jerry J. Johnson James P. Hain
Yields of pinto bean varieties in the 2000 trial at the Arkansas Valley Research Center, C.S.U., Rocky Ford, Colorado.
Variety Origin Test
Yield Average Moisture Seeds
Bill Z Colo. State Univ.
GTS Cob 502-04 Genetic
CO83778 Colo. State Univ.
Cisco Novartis Seeds, Inc.
co74905 Colo. State Univ.
CO64342 Colo. State Univ.
97: 197P Univ. of Idaho
CO64155 Colo. State Univ.
CO74630 Colo. State Univ.
97:395P Univ. of Idaho
co64599 Colo. State Univ.
Chase Univ. of Nebraska
Elizabeth Fox Bean Co.
Montrose Colo. State Univ.
Poncho Novartis Seeds, Inc.
co75714 Colo. State Univ.
Othello USDA
USPT-73 USDA
Buster Asgrow Seed Co.
93:21 SP Univ. of Idaho
Burke Wash. State Univ.
co75944 Colo. State Univ.
CO64589 Colo. State Univ.
co7551 1 Colo. State Univ.
CO74518 Colo. State Univ.
94: 1023P Univ. of Idaho Buckskin Novartis Seeds, Inc.
CO74527 Colo. State Univ.
Kodiak Mich. State Univ.
Ibs.lA % % 4240 116 11.3 4024 110 10.9 4023 110 11.4 4015 110 15.0 3994 109 13.2 3986 109 11.6 3971 108 13.9 3942 108 13.4 3929 107 11.3 3925 107 14.5 3846 105 12.8 3838 105 12.0 3762 103 12.1 3747 102 11.9 3739 102 11.5 3733 102 11.4 3730 102 12.6 3678 100 11.5 3659 100 13.4 3578 98 11.5 3558 97 11.0 3546 97 12.6 3508 96 11.1 3402 93 10.6 3305 so 11.5 3303 so 18.8 3258 89 14.1 3246 89 10.5 3162 86 12.5 #/lb. 1079 970 944 982 1029 1049 1030 1062 1000 1075 1090 1035 1020 1058 1186 1047 962 1015 1000 980 1150 1191 1130 1123 1143 1171 1005
CO74526 Colo. State Univ. 2836 77
Average 3664
CV% 10.0
LSD(.30) 314.8
Plant - June 5,200O Harvest - September 14,200O Fertilizer - 50 Ibs. P,O, + 10 Ibs. N/Acre
Rust was not a factor in this years test.
Supported in part by the Colorado Dry Bean Administrative Committee
11.0 1073
DESCRIPTION OF PINTO BEANS
BiZ A varikty release by Colorado State University io 1985. It has a vine Type III growth habit with resistance to beao common mosaic virus and moderate tolerance to bacterial brown spot. It is a productive variety when growing cxditious are gocd, similar to Olathe for white mold and lust susceptibility and maturity.
Buckskin Burke
A Type III variety from Novartis Seeds, lnc
A medimn season variety (USWA-19) released by Washiogtoo State in 1996. It has r&stance to rust and white mold.
Buster Chase Cisco c o Eliiabeth GTS Cob 502-94 Kodiak Montrose
Anew variety Tom Asgrow Seed Co. (5051) released io 1998.
A vine variety released by the University of Nebraska. It is resistaot to rust and white mold, moderately resistant to bacterial brow spot, but moderately susceptible to Fusariom wilt.
A variety from Novartis Seeds Inc. (BNK 354)
Colorado State University experimental lines with resistance to rust A variety from Fox Beao Co. with rust resistance,
Ao experimeutal line from Genetic in Twin Falls, Idaho. A variety from Michigan (P94207) with rust resistaoce.
A variety released from Colorado State University in 1999 (CO5 1715) with resistance to rust and excellent seed quality.
Othello A variety released by the USDA with a semi-upright growth habit. It is highly susceptible to rust and bacterial diseases.
Poncho A variety from Nova& Seeds, Inc. (ROG 179) susceptible to rust, but moderately resistant to soma bacterial diseases.
USPT-73 An experimental line from WSU-ARS.
2000 Corn Grain and Silage Variety Trial Arkansas Valley Research Center
The average grain yield in this trial was 233 bushels per acre, greater than any in the previous 10 years. In 1999 trial average was 206 bu., 1998-200 bu., 1997-206 bu., 1996-219 bu., 1995-197 bu.,
1994-230 bu., 1993-178 bu., 1991-209 bu. and 1990-183 bu. The average silage yield was 39 tons per acrecomparedto 1999-33T., 1998-4OT., 1997-32T., 1996-36T., 1995-35T., 1994-33T., 1993-27T., 1992-41T., 1991-37T., and 1990-31T. The average silking date for this trial was 2 days earlier than 1999. Grain yields were adjusted to 15.5% moisture and 56 pound bushels while silage yields were adjusted to 70% moisture. This allows direct comparison between varieties, but actual harvest moistures and silking dates indicate maturity and should be considered when choosing a variety.
Teat Plot Information
Purpose - To evaluate the inherent genetic ability of selected corn varieties to yield gram and silage under irrigated conditions in the Arkansas Valley.
Data - 1. Grain yields 2. Forage yields 3 Growth factors
Plots - Gram - 32’ X 10’ (4rows) Harvest 2 rows Silage - 32’ X 5’ (2 rows)
Design - Randomized complete blocks (3 replications)
Varieties - Gram-24 entries Silage-20 entries Fertilizer - 50 lbs. P,O,/A + 10 Ibs. N/Acre - lo/20199
175 lbs. N/A as NH, - 1 l/16/99
Herbicide - Bladex 1.5 lbs. + Dual II 1.15 lbs. + Gramoxone .3 1 AJ/Acre - 4/27/00 Insecticide - Comite II 1.5 Ibs. AI/Acre - 7/15/00
Capture .08 lbs. AI/Acre - 7/23/00 Soil - Silty, clay loam, l-1.5% o.m., pH ea. 7.8
Plant - May 4,200O
Irrigate - 518, 6/l 1, 6124, 717, 7128, 818, 8118, 9121 Harvest - Silage - September 14,200O - Forage harvester
Gram - October 26,200O - Self-propelled two row plot combine
Jerry J. Johnson James P. Hain
Frank C. Schweissing
Irrigated corn performance at Rocky Ford’ in 2000.
Grain Test Plant
Hybrid Yield Moisture Weight Height Density Lodging Silkin
Pioneer brand 33P67 (BT) Novartis N67-T4 (BT) Grand Valley GVX5458 Garst 8546 Grand Valley SXl600 Mycogen2725 DEKALB DK611 Pioneer brand 33B51 (BT) AgriPro 9570 (BT) Pioneer brand 3 IA13 (BT) Grand Valley SX1300 Pioneer brand 32R42 Novartis N7070 (BT) Kaystar KX-920
Triumph 15 14A (BT) (IMI) Mycogen 2784 (BT) Grand Valley GVX4478 DEKALB DK655 DEKALB DK647 (BTY) Asgrow RX799 (BT) Pioneer brand 31698 Asgrow RX889 Grand Valley GVX0145 Grand Valley GVX5345 Average CV% bu/ac 268 266 250 248 247 246 246 246 243 242 241 237 237 236 234 234 233 217 211 209 204 203 195 193 233 6.8
% Ib/bu in plants/at % date
20.2 61.5 94 33214 1 198 18.8 57.9 92 33487 0 196 17.7 58.2 95 31762 0 198 21.8 57.7 93 33124 0 197 19.2 59.4 109 31490 3 202 21.2 57.6 89 32035 0 197 15.4 59.6 92 33396 1 198 21.2 59.7 90 30855 0 196 21.4 58.7 95 32942 1 196 19.2 59.8 96 31490 1 200 19.2 57.6 92 31036 1 196 18.9 60.2 92 30220 2 199 16.8 57.6 94 31672 0 197 25.4 56.4 96 32942 0 198 20.3 57.4 94 31218 3 199 16.8 57.9 99 33578 1 196 19.7 57.4 93 30310 1 197 20.5 60.2 92 30129 1 198 20.3 56.7 103 31036 0 199 23.4 59.7 98 30764 0 199 22.3 59.9 99 32126 1 203 27.3 58.8 91 31309 5 200 25.7 57.1 103 29584 2 203 26.0 56.9 107 30764 1 203 20.8 58.5 96 31687 1 198
‘Trial conducted on the Arkansas Valley Research Center; seeded 514 and harvested 10126. No ear drop. ‘Julian date.
Corn silage performance at Rocky Ford’ ia 2000.
Plant
Hvbrid Yield Moisture Density Height SilkingZ
MBS38 11 x Lfy 497L A&Pro HY9646 Wilson E7004 Asgrow RX891 Grand Valley SX1602 Wilson EDX5 1 Gmt 8315 DEKALB DK679 Pioneer brand 31B13 (BT) Pioneer brand 3 1G98 Grand Valley GVX4601 Pioneer brand 3 1R88 Grand Valley GVX4681 DEKALB DK647 (STY) Grand Valley GVX2416 FR1064 x Lfy 419L Wilson E7005 MBS3811 xLfy554L Grand Valley GVX4478 Asgrow RX799 (BT) Average CV% tiac 45.3 43.8 43.1 41.3 40.7 40.1 39.8 39.4 39.3 38.6 38.6 37.9 37.8 37.6 36.6 36.3 35.7 34.9 34.1 32.7 38.7 10.0 % 52.2 54.3 55.6 53.9 53.9 58.4 55.5 51.5 57.6 56.4 55.6 55.6 55.3 54.7 57.8 54.3 58.5 60.3 56.4 56.5 56.0 plants/at in date 31853 109 203 29403 104 203 29222 91 205 30583 91 203 31309 105 203 31309 96 203 30310 95 205 31762 107 202 31581 99 203 32398 101 204 30220 99 201 32398 105 204 31672 95 198 30583 101 200 26862 98 202 3 1944 116 202 28496 94 206 28223 112 206 30492 93 198 31127 100 202 30587 101 203 LSD,, 30, 3.3
‘Trial conducted on the Arkansas Valley Research Canter; seeded 5/4 aad hawasted 904.
2Julian date.
2-Yr average irrigated corn performance at Rocky Ford, 1999-00.
2-Yr average corn silage performance at Roclcy Ford, ?:;,:.:. :; :j ::, ,:,~f:i_: :+ :::;-:;::‘i-.~i::‘::::::~~,~~~~~~~~~~~~~~~~~~~~~ 1999-00.
~,~~~~~~~~~~~~::;~~~~~~~~~~~~~~~~~~~~~~i~.~~~~ ~:
bu/ac % lbibu tlac %
Gmt 8546 238 17.8 57.9 A&Pro HY 9646 40.6 57.7 Grand Valley SX1300 231 16.8 57.9 Wilson E7004 38.9 59.6 Mycogm 2725 230 17.5 58.0 Asgow RX897 38.2 58.9 DEKALB DK611 223 14.8 59.7 Gmt Seed 8315 37.7 59.9 Nova&N7070 (ST) 220 15.3 57.8 Pioneer brand 31B13 (B-I-) 36.9 60.1 DEKALB DK647 (BTY) 213 17.5 57.5 DEKALB DK647 (BTY) 34.2 57.1 Asgrow RX799 (BT) 206 21.0 59.9 Asgrow Rx799 (BT) 32.4 56.9
DEKALB DK655 206 19.6 60.1 AVerage 37.0 58.6
Asgrow Rx889 202 24.6 59.3 Average 219 18.3 58.7
Nitrogen Management Projects on Corn and Onion at AVRC
Dr. Ardell Halvorson and Mr. Curtis Reule, USDA-AR& Fort Collins, CO Dr. Frank Schweissing and Dr. Mike Bartolo, AVRC, Rocky Ford, CO
Problem: High nitrate-N (NO&) levels have been reported in groundwater in the Arkansas River valley in Colorado, which is a major producer of melons and vegetable crops grown in rotation with alfalfa, corn, sorghum, winter wheat, and soybeans. Relatively high rates of N fertilizer are used to optimize crop yields and quality, generally without regard to soil testing. Vegetable crops generally have shallow rooting depths and require &quent irrigation to maintain market quality. High residual soil N levels, high N fertilization rates to shallow rooted crops, shallow water tables, and excess water application to control soil salinity all contribute to a high N03-N leaching potential. Application of slow release fertilizers to crop rotations that include vegetables/melons could potentially increase nitrogen use efficiency (NUJZ) and reduce nitrate-N leaching potential. Nitrogen management research is needed to develop improved NUE and N management practices for these furrow irrigated crop rotations. Improved N management practices for melon, vegetable and field crop rotations in the Arkansas River Valley should optimize crop yields while minimizing N fertilizer impacts on ground water quality.
Nitrogen fertilizer rate studies under conventional tillage, furrow irrigation are being conducted on a Rocky Ford silty clay soil at the CSU Arkansas Valley Research Center (AVRC) at Rocky Ford to evaluate the N fertilizer needs for optimum onion and corn yields. Soil N levels are being monitored before N fertilization to evaluate the NUE by each crop. Slow release N fertilizers are being tested to determine the potential to increase NUE and reduce N03-N leaching potential in comparison to regular N sources such as urea.
Research Objectives of N Work at AVRC:
1. Determine nitrogen (N) uptake patterns and N fertilizer use efficiency of onions. 2. Determine N fertilizer needs for optimizing onion and corn yields.
3. Determine if slow release N fertilizer will improve N fertilizer use efficiency by onion and corn and reduce the potential for NO,-N leaching and groundwater
contamination.
4. Develop improved N management practices for crops grown in Colorado Arkansas Valley area.
Research Approach in 2000:
Six broadcast N rates were established for the grain corn study (0,50, 100,150,200, and 250 lb N/a) in 2000. Corn total biomass, grain yield, N uptake, and soil NO,-N were measured. The onion study in 2000 included five banded N rates for onion study (0,50, 100, 150,200) that included urea, Meister, and Polyon N fertilizers. Onions were sampled during the growing season from the 0,100, and 200 lb N/a N rates to determine N uptake patterns. Plant and soil N analyses are in progress on the 2000 samples. Randomized block, split-plot designs were used. Statistical analyses of the data were performed using SAS.
that was fallowed for the latter part of 1997.
Soil NO,-N was high (see Figure 1) in March g2 1998, with a total of 701 lb N/a in the 6 ft z3
profile. Soil NO,-N level in the 0 - 2 fl depth was 317 lb N/a. Fertilizer labeled with i5N was
i 4 8 / Results:
Previous Nitrogen Projects On Onion. In March 1998, USDA-ARS and AVRC scientists initiated a N fertilizer study on onions. The studv was located on a ulot area
Soil NItrate-N (lb N/a)
0 50 loo 150 200 266
’
1
band applied at a rate of 100 lb N/a on May 20 5 and on June 13, 1998 for a total N application of 6
200 lb N/a to determine the N fertilizer use efficiency of onions. A plot receiving no N fertilizer was also included in the study. In 1998, the fresh bulb yield for the 200 lb N/a treatment yielded significantly more than the plots receiving no N fertilizer (Figure 2). The results show that 11% of the fertilizer N applied on May 20”’ and 19% of the N applied on June 13”’ was taken up by the onions. The average amount of fertilizer N taken up by the onions in 1998 was 15%. The data also
showed that the N fertilizer applied in May and June was leached below the onion root zone and was detected at the 6 ft soil depth in September 1998.
Fig. 1. Soil nitrate-N during “N study on onion in 1998 and corn in 1999.
1996 Onion Bulb Yield
140 154 160 200 220 240 260 Dayaf-Year (DOY)
In 1999, corn was grown on the onion fertilizer plots with no additional N fertilizer
applied to determine if corn could recover more Fig. 2. Onion yield as function of N rate and date. of the fertilizer N not used by onion. In April
1999, the soil profile of the onion plots receiving 200 lb N/a was still high (Figure 1)
and still fairly high in the plots receiving no fertilizer N. Both treatments still had enough residual soil NOj-N in the 6 fl profile to produce a 300 bu/a corn crop. The 1999 corn yields were 239 bu/a for the no fertilizer N plots and 234 bu/a for the plots receiving 200 lb fertilizer N/a in 1998. The corn recovered an additional 12% of the 200 lb/a of fertilizer N applied to onion in 1998. Thus the onion and corn crops combined recovered 27% of the
fertilizer N applied in 1998. Residual soil _,
1999 8 1999 Onion Bulb Yield 120 L 1 . . . 2zcLl : I
m.bby 9.J”” z3.h IWd =-4 mm vse
140 190 180 200 220 240 260 Day Of Year (DOY)
N03-N was still high in November 1999 rug. 3. Relative onion bulb yield as function of date
following corn harvest.
This research suggests that obtaining
a soil test before making N fertilizer 1201
199881999OnionNuptake
I .
application would be helpful m preventing application of unneeded N fertilizer. The data suggests that delaying N application to onions until mid-June to early-July would improve N fertilizer use efficiency. The relative yield (Figure 3) and N uptake (Figure 4) curves determined in 1999 and 1998 for onion show that the N requirements of onion is very low up until early July. Frequent irrigation is needed in the early growth stage for onion survival and
establishment. Delaying N application until
---120
140 180 180 200 220 240 280 DayofYear (WY)mid-June to early-July would reduce the r,g. 4. Relative N uptake as a function of harvest date in
potential for leaching the fertilizer N out of lgg8 and ““.
the root zone. The 15N data showed that a large portion of the fertilizer N was moved toward the center of the 44 inch onion beds with the irrigation water, with much of the fertilizer N remaining in the upper portion of the root zone. If corn could be grown on these onion beds, fertilizer N recovery and use could possibly be improved.
The additional N uptake data collected in the 2000 N study on onion will be combined with that t?om previous years to develop improved N uptake curves for onion. The N rate and source (including slow release N fertilizers) study details and data will be reported by Dr. Mike Bartolo.
Nitrogen Rate and Source Study on Corn. AN rate and fertilizer source study on corn was initiated in 2000 on a plot area that had previously been in alfalfa for 5 years, before being plowed up on 20 October 98. Fertilizer application to the alfalfa was two applications of
150 lb P,OS/a as 11-52-o which added 64 lb N/a during the five years of alfalfa. Watermelon was produced on the plot area in 1999 with 100 lb P,O,/a applied as 11-52-o which contained 21 lb N/a. Corn was produced in 2000 with 50 lb P,O,/a applied as 11-52-o which contained 11 lb N/a. Six N fertilizer rates of urea and polyon (slow release N fertilizer) were applied. The slow release N fertilizer was applied to determine if the slow release fertilizer would improve fertilizer N use efficiency and corn yields and reduce N03-N leaching potential. Total corn biomass production, grain yield, plant N uptake, and residual soil NO,-N are being determined.
Analysis of soil samples collected in April 1999 from the plot area shows that the soil NO,-N in the profile was concentrated in the O-2 ft soil depth, with low levels of N03-N at deeper depths (Fig. 5). The total amount of NO,-N in the 6 fi profile was 114 lb N/a. Following the watermelon crop, soil Nitrate levels in November 1999 had decreased in the top 2 Et but increased in the deeper soil depths. The total amount of NO,-N in the 6 ft profile was 157 lb N/a in November of 1999. In April 2000, soil N03-N levels in upper part of the soil profile had increased, with a total level of 180 lb N/a in the 6 ft profile. Thus soil NOs-N levels just prior to
N fertilization and corn planting was
relatively high, despite the fact that little N Soil NO,-N (lb N/a)
fertilizer had been applied during the
0 10 20 30
40 50previous 6 years. The question is, what is the
0
source of this high level of residual soil N?E 1 c 2
Watermelon was planted May 18, X 1999 on the plot area and harvested in late : 3
/S) August and early September. By August 25, i4
1999, the total oven dry biomass produced 5
(tops + melons) was 12,094 lb/a with the tops s ~AVRC Rocky FOKI, Colorad
contributing 4,098 lb/a of this total. About
0 10
20 30 40 50124 lb N/a was returned to the soil in the
tops, which had a C/N ratio of 13. At this Fig. 5. Soil profile nitrate-N for 1999 watermelon crop and
C/N ratio, the tops would decompose rather 2000 comcroP. rapidly when combined with the soil, with a
release of N for following crop. At harvest on August 2S”, the rind made up 29.5% of the oven dry melon weight. Assuming that 50% of the melons were of harvestable size (>18 Ibs), the rind on the unharvested melons left in the field could have contributed 35 lb N/a back to the soil. With a C/N ratio of 14, the rind would decompose rather rapidly. Assuming that the fruit or meat part of the unharvested melons contained about 1% N, an additional 30 lb N/a could possibly have been returned to the soil. When the unharvested melons and tops were destroyed by disking, microbial decomposition of the melon biomass was initiated. This could explain the increase in soil N03-N measured in the profile t?om November 1999 to April 2000. The amount of N in the watermelon tops and unharvested melons could potentially contribute up to 184 lb N/a to the next crop. This might explain the unexpected high level of soil N at corn planting in
2000.
The corn was planted on April 27, 2000 at a seeding rate of 28,336 seeds per acre. The fertilizer N was broadcast applied and incorporated just prior to planting. Corn grain yields were not significantly increased by N fertilization in this study in 2000. Nitrogen fertilizer source had no significant effect on grain yield. The overall average grain yield was 254 bu/a for the study. The lack of
response to N fertilization should probably be expected, given the high level of soil NO,-N in the 6 fi profile (181 lb N/a) in early April 2000.
Corn silage yields (70% moisture)
38
dy.
. .
m
Y = 34.7 +0.0.%x - omruc?
i&o.sl ..
33-0 50 loo 150 200 250
Fertilizer N Applied (lb N/a)
on 9 September 2000 increased Fig. 6. Corn silage yield as function of N rate in 2000
significantly with increasing N rate up to 150 lb N/a then declined with increasing N rate (Fig. 6). The slow release Polyon N source resulted in higher silage yields (36.1 t/a) than with urea (35.2 t/a) (P=O.106 significance level).
Corn plant stands were affected by fertilizer N source and N rate. Plant populations decreased as N rate
increased for urea (Fig. 7). Plant populations were greater with Polyon than with urea. The N rate x N source interaction was significant (P = 0.077). The data show that as the rate of urea-N increased above 150 lb urea-N/a, the plant population was reduced. These data would suggest that if high rates of urea are to be applied at planting, a split application may be desirable to avoid a negative effect on plant population. The decrease in plant population at the 200 and 250 lb/a N rates, especially with urea. exnlains the decrease
p 23000 I,
I-O 50 100 150 200 250 Fertilizer N Applied (lb N/a)
r,g. 7. Corn plant population at harvest as a fimction of N rate and sourcein2000.
observed in corn silage yields at these N rates. In contrast, corn grain yields were maintained at these high N rates despite the lower population. Thus the corn plants at the high N rates
compensated with larger ears, and on some plants two ears were produced.
The N level in the irrigation water is monitored by AVRC throughout the growing
season. We used this information along with number of irrigations and amount of irrigation water applied to calculate an estimate of N added to the cropping system by irrigation. The N
contribution from the irrigation water to the plot area would have amounted to about 6 lb N/a in 1999 while irrigating the watermelon and about 15 lb N/a in 2000 while irrigating the corn. Although the irrigation water contributes some N to the cropping system, it does not appear to be the major contributor to the high levels of N03-N found in the soils at AVRC.
The corn N study will be continued on the same plots in 2001. Nitrogen fertilization effects on residual soil nitrate-N levels will be monitored.
The authors wish to thank Patti Norris, Marcella Causton, Kevin Tanabe, and Marvin Wallace for their field assistance and analytical support in processing the soil and plant samples and collecting the data reported herein.
Evaluation of Corn Borer Resistant (Bt) Hybrids to the Southwestern Corn Borer - 2000
Arkansas Valley Research Center
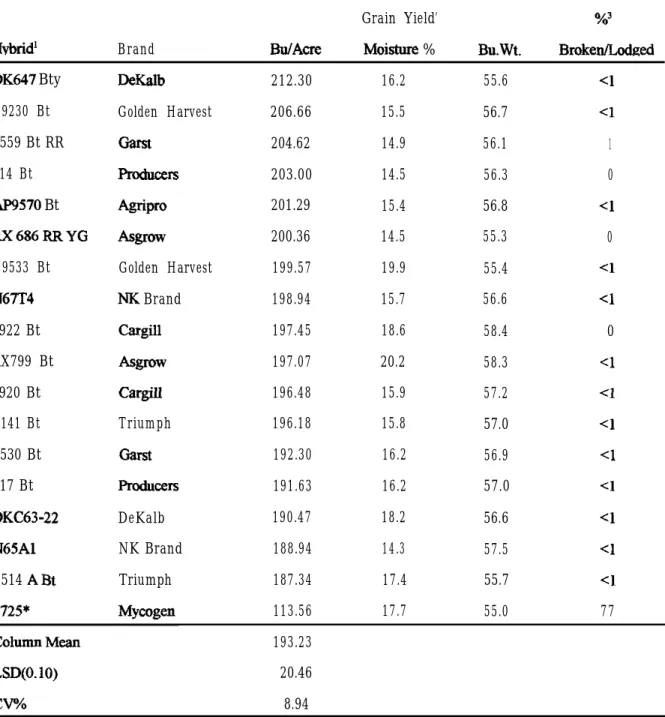
Eighteen corn hybrids, including 16Bt and 1 non-Bt hybrids, were evaluated for resistance to the southwestern corn borer(SWCB), Diufrueu grandiosella Dyar. All of the Bt hybrids had substantially reduced SWCB infestations when compared to the non-Bt hybrid and significantly increased yields. The corn earwonn, (CEW) Helicoverpa ziu (Boddie) was not a factors in this year’s test.
We did not consider the small CEW infestation this year because in trials during 1997 and 1998, the presence of CEW infestations without the SWCB did not result in any yield reduction in the non-Bt hybrids as compared to the Bt hybrids and a number of the Bt hybrids had CEW
infestations as great or greater than the non-Bt hybrids.
The infestation (SWCB) rate for the non-Bt variety Mycogen 2725 was 77%. The overwintering (2000-2001) survival rate in the non-Bt variety was an average 36% as measured on March 27, 2001.
Test Plot Information Date - 1. Yields - grain
2. Insect Infestation
Plot - 32 X 10’ (4 rows) Harvest - 2 rows Design - Randomized complete blocks (4 replications)
Varieties - 18 entries
Fertilizer - 50 Ibs. P,O, + 10 Ibs. N/Acre - 1 l/l l/99 150 lbs. N as NH, - 1 l/16/99
Herbicide - Bladex 1 .O Ibs. + Dual II 1.15 lbs. + Gramoxone .3 1 lbs. AI/Acre - 5/l 8/00
Acaricide - none
Soil-Silty,clayloam, 1-1.5%o.m.,pHca.7.8 Plant - May IO,2000
Irrigate - 5/l 1, 6126, 716, 7J22, 815, 9112
Harvest - October 27,200O - self-propelled two row plot combine
Table L-Grain yields of corn borer resistant (Fkt) and non-resistant corn hybrids. Arkansas Valley Research Center, C.S.U., Rocky Ford, Colorado. 2000.
Grain Yield’ %3
Hvbrid’ Brand BUIACE Moishnx % Bu.Wt. BrokenK.al& DK647 Bty H9230 Bt 8559 Bt RR 714 Bt AP9570 Bt Rx686RuYG H9533 Bt N67T4 7922 Bt RX799 Bt 6920 Bt 1141 Bt 8530 Bt 717 Bt DK63-22 N65Al 1514 ABt 2725* DeKalb Golden Harvest Garst Agripro Agrow Golden Harvest NK Brand Cargill Agrow CQill Triumph Garst Produces DeKalb NK Brand Triumph 212.30 16.2 55.6 Cl 206.66 15.5 56.7 Cl 204.62 14.9 56.1 1 203.00 14.5 56.3 0 201.29 15.4 56.8 Cl 200.36 14.5 55.3 0 199.57 19.9 55.4 Cl 198.94 15.7 56.6 Cl 197.45 18.6 58.4 0 197.07 20.2 58.3 Cl 196.48 15.9 57.2 Cl 196.18 15.8 57.0 <l 192.30 16.2 56.9 Cl 191.63 16.2 57.0 Cl 190.47 18.2 56.6 Cl 188.94 14.3 57.5 Cl 187.34 17.4 55.7 Cl 113.56 17.7 55.0 77 ColumnMean 193.23 LsD(O.10) 20.46 CV% 8.94
1 -Plant -May 10,2000 ‘Not Bt
2 - Yield adjusted to 15.5% moishue and 56 lb. bushels 3 - Percent of all stalks broken or lodged for each treatment.
Chemical Control of the Southwestern Corn Borer - 2000 Arkansas Valley Research Center
Rocky Ford, Colorado Frank C. Sehweissing
This was a good corn production year due to warm temperatures, above average corn growing degree days (3099) and plentiful irrigation water. Precipitation was just over 2 inches below normal but not an important limiting factor,
While this pest is an important limiting factor to corn production in Baca County on a more or less regular basis, it had only in the last two or three years moved into Prowers and Bent Counties due to very mild winters, which allowed the larvae to survive overwinter in the corn stalks. However, this was the 6rst year in memory that this borer had reached high enough numbers to cause significant damage to corn throughout Otero County. Prior to this year it had occurred in Otero County in only small limited areas where they caused very little damage.
Methods and Mater& - Supporting information relating to the test plots is given on page 2. The two row plots were separated by four rows of corn which served as a buffer between plots to reduce the effect of chemical drift and maintain population pressure on the various treatments. The treatments were applied July 27 and a second time on August 11 on half of each plot. Silwet at 10 oz./acre and Bond at 4 oz./acre were added to each treatment. The insecticides were applied with a compressed air sprayer, mounted on a Hahn Hi-Boy sprayer at 38 p.s.i. at the rate of 25 g.p.a. Broken or lodged plants for each plot were counted on October 3,200O. Corn was harvested for grain on October 26,200O.
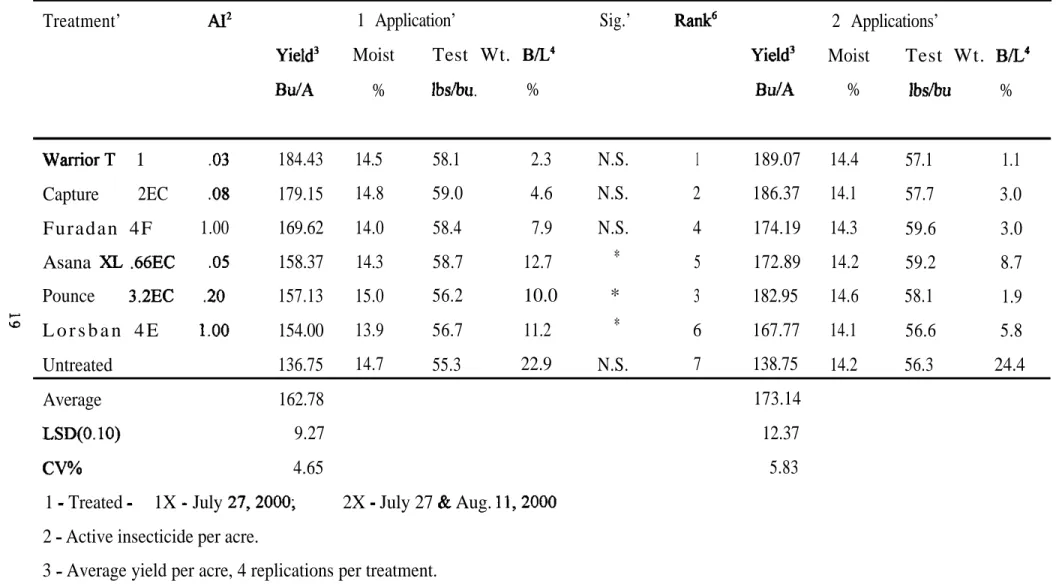
Results and Dish - The various treatments resulted in significantly diierent yields and wide range of broken/lodged corn stalks. Untreated plots produced significantly lower yields than all of the other treatments. Warrior and Capture treatments resulted in the best yields at either 1 or 2 applications. Yields were not significantly diEerent between the two treatments nor was 2 applications significantly better than 1 application. Furadan produced significantly less yield than Warrior and there was also a non-significant difference between 1 and 2 applications. Asana XL, Pounce and Lorsban had significantly lower yields than the previous three with 1 application and the 2 application rates were significantly better than the 1 application rate. There seemed to be a particular benefit for 2 applications of Pounce.
However, it appears considering the present low price of corn and the cost of insecticide applications that the use of 1 application of an effective insecticide would be of particular benefit to growers. Proper timing through the use of pheromone traps and field inspections would be important tools to use with single applications.
Test Plot Information - 2000 Arkansas Valley Research Center
Purpose - To evaluate the effectiveness of selected insecticides for the control of the southwestern corn borer Diufruea grandosella Dyar, in corn.
Data - 1. Broken stalks, lodging 2. Grain Yields
Plots - Treated 87.12’ long X 2 rows (5’) wide = 435.6 sq. Ft. = lOO* acre Design - Split plot, randomized block (4 replications)
Variety - DK58ORR
Fertiliir - 50 Ibs. P,O, + 10 lbs. N/A - disc, 150 lbs. N as NH,, chisel - preplant Herbicide - Bladex 1.5 Ibs. + Dual II 1.15 lbs. + Gramoxone .3 1 lbs. AI/Acre - 4128
Roundup 1 lb. Al/Acre - 616 Soil-Silty,cIayloam, I-1.5%o.m.,pHca. 7.8
Plant - May 2,200O Half Silk - July 12,200O
Irrigate - 5110,619, 6125, 718, 7/29,8/15, 9117
Treated July 27, 1000 and August 11 Hahn HiBoy, compressed air sprayer
-38 psi. - 25 g.p.a. - TW12 cone nozzle
Harvest - October 26,200O - self-propelled two row combine
Table l.-Chemical control of the southwestern corn borer in corn. Arkansas Valley Research Center, C.S.U., Rocky Ford, Colorado. 2000.
Treatment’ AI2 1 Application’ Sig.’ Rank6 2 Applications’
Yield3 Moist Test Wt. B/L’ Yield3 Moist Test Wt. B/L4
Bu/A % Ibs/bu. % Bu/A % Ibs/bu %
WarriorT 1 .03 184.43 14.5 58.1 2.3 N.S. 1 189.07 14.4 57.1 1.1 Capture 2EC .08 179.15 14.8 59.0 4.6 N.S. 2 186.37 14.1 57.7 3.0 F u r a d a n 4 F 1.00 169.62 14.0 58.4 7.9 N.S. 4 174.19 14.3 59.6 3.0 Asana XL .66EC .05 158.37 14.3 58.7 12.7 * 5 172.89 14.2 59.2 8.7 Pounce 3.2EC .20 157.13 15.0 56.2 10.0 * 3 182.95 14.6 58.1 1.9 2 L o r s b a n 4 E 1 .oo 154.00 13.9 56.7 11.2 * 6 167.77 14.1 56.6 5.8 Untreated 136.75 14.7 55.3 22.9 N.S. 7 138.75 14.2 56.3 24.4 Average 162.78 173.14 LSD(O.10) 9.27 12.37 CV% 4.65 5.83
1 - Treated - 1X - July 27,200O; 2X - July 27 & Aug. 11,200O 2 - Active insecticide per acre.
3 - Average yield per acre, 4 replications per treatment.
4 - Percent of all plants broken or lodged for each treatment. Four replications for each treatment. 5 - N.S. - not a significant difference between yields. * - significant difference t-test (0.10) 6 - Rank by yield for treatments with two applications.
BROAD SPECTRUM WEED CONTROL IN CORN Colorado State University - Weed Science
Project Code: CORN1 jO0 Crop: CORN
Plot Widrh: IO FT
Irrigation Type: FUP.RO\V
Locetion: ARKANSAS VALLEY RESEARCH CENTER Site Description ’
Vuiety NORTHPJJP KING 75-Q; Planting Da: ~. 4/27/00 Plot Len-mh: ‘30 FT Reps: 5
TeXWe CLAY LOAM
Soil Description
%OM %SYid %Silt %Clay PH C E C
1.6 44 25 25 7.8 Applicrrjon Dste Time of Day Application Method Application Tining Air Tcmp (F) Soil Temp (F) Relariye Humid@ (%) Wind Velocity (mphldir.)
Application Information A B C D j/5/00 5/l 9100 9:00 AM I:00 PM BROADCAST BROADCAST PRE POST 72 71 65 74 60 32 0 0 4pplication Equipment CPA PSI I Summay Comments
The preemergence iiezunents were applied S dtys ifier plenriag, some weed emergence hzd occurred. The soil surface ~85 dry, sub-rurfxe moisnxe ~2s good at time of spplicaiions. The post emergence neatmtnrs were rpplied over 4 inch 1211 Corn 2t the 5 leaf stage, venice mzllow (HIBTR) was co@edon io 4 leaves, redroot pigweed (AMARE) was 4 leaves, and kochja ws l-6 inches ~11. All trczmentt provided excellenr lveed control wirh the exception of aeatmenr 5 - lCIAS676/ZA1296, a pre-mix of ace&hlor end mesotrione applied preemer~eence. The ineffectiveness of treatment 5 mzy have been due to emerg&ce of some xveeds 51 lime of eppliczlion.
T i m Damato P h i l Westra
Colorado itate University
BROAD SPECTRUM WEED COFiTROL IN CORN Trial ID: C0RN1300 investigator: CSU
Location: ROCKY 'CR3 Strc‘y Dir.: W e d S c i e n c e
Weed CO& 3ISTR I(CRSC A?u+?.E
Rctirrg Dita Type CONTROL CONT3OL CONTROL
Rating eni-i PERCENT PXRCfNT PZXCZNT
Rrting Date 6-6-00 C-6-00 6-6-GO
Trt Tre~t~~iit Form 3% 3ate crow Appl NO. N~~,e FzrLT es Rste Lhit stg C&e
15 DT 1.23 02/A 5x A 75 ZT 1. 25 021.: ?3: A 70 5? I..23 02./A ?OST 3 L I.5 X/A ?OST 3 I, 2 Q?/r. ?OST 3 j.j L q.j .S?,.B. ?.?E A 3.2 L L 5 ??/A 3% A 4 I. .2aa I?/>. POST 3 L 1 9 v/v ?OST 3 5 2.5 $ V/V POST 3 6L 16 021.X ?RZ ii 1.5 L a 021~ POST 3 40 C? .33 02/>. FOST 3 .25 5 v/v 'OST 3 7.64 L 1.67 11/A ?XS A 51.4 Of 5 a/.:. ?OST 3 i . 25 t V/V ?OST 3 j j ~~ 1.7 02/A ?OST 3 5 1 k V/‘i SST 3 5 2.j 6 v/T: ?OST 3 s o 3: 14 DZf.2 T-09 3 > 1 b v/v POST a L 2.5 5 v/v ?OST 3 70 Df 6 02/A FOST B -L 1 h V/V ?OST 3 L 2.5 t ‘J/V "CST 3 75 Df .E6 02/s. ?OST 3 40 D ? .33 02/A POST B L 1 b V/V POST B L 2.5 % v/v POST 3 0.0 e 0.0 c 0.0 c 78.3 c 53.3 i 100.0 a 95.0 ib 100.0 2 94.7 a 85.0 bc 53.3 z 96.7 2 20.3 d 35.0 b 51.7 b 91.7 & '6.7 e 100.0 e 96.3 cb 100.0 i. 90.0 2 9c.o ZiJ $6.7 z ?6.7 c s5.0 cb 100.0 2 59.7 e 100.0 + 100.0 a 100.0 a 94.7 ab ioo.0 a 10.82 3.28 14.29 6.33 5.48 8.44 8.09 6.5 3.87 0.300 1.202 0.289 0.7436 0.3197 0.7538 12.323 103.384 3 8 . 1 % 0.0001 0.0001 0. ODDi 36.7 a
Winter Wheat Variety Trial - 1999-2000 Arkansas Valley Research Center
The average yield of 84.1 bushels per acre was about the same as the previous year. Range in yields was 94.3 bu. to a low of 70.1 bu. per acre.
Test Plot Information Data - 1. Grain yields
2. Growth factors
Plots - 30’ X 5’ (4 rows), Harvest 5’ X 24’
Design - Randomized complete block (3 replications)
Variety - 15 varieties + 15 experimental lines or varieties no longer available Fertilizer - 8 1 lbs. NO,-N in soil test
50 tbs. PZ05 - lOl20199
57 lbs. N/acre as urea in irrigation water - 4/17/00 Herbicide - Bronate 1 lb. AI/Acre - 2/28/00
Insecticide - DiSyston SE .75 lbs. AI/Acre - 4113100 Plant - September 29, 1999 900,000 seeds/acre Irrigate - 9/30, 10/28, 4/l 7, 518, 5124
Harvest - June 26,200O - small plot combine
Jerry J. Johnson James P. Ham
Table l.-Irrigated winter wheat performance trial. Arkansas Valley Research Center,
C.S.U., Rocky Ford, Colorado. 2000.
Variety’ Yield’ Moisture Test Wt. Plant Ht
BulAcre % lbs./bu. inches
Venango 94.3 10.6 56.3 34 TAM 107 91.3 10.1 54.5 33 Nuplains 89.3 12.0 55.2 33 Trego 88.4 10.8 56.1 33 Enhancer 87.2 9.6 52.0 34 Jagger 86.8 10.1 54.3 33 Yuma 83.7 10.6 53.7 34 Prairie Red 82.0 10.0 54.2 32 Kalvesta 81.5 11.0 56.6 32 2137 80.9 9.5 51.6 32 Cossack 77.3 9.8 53.2 36 Wesley 75.2 10.1 53.5 31 Yumar 75.0 9.2 49.8 34 Akron 74.4 9.9 53.9 33 Custer 70.1 10.3 54.7 32 Average 84.1 10.5 54.5 CV% 12.3 LSD(0.30) 8.8
1 - Plant - September 29, 1999 900,000 seeds/acre Harvest - June 26,200O Varieties headed out week of May 8,200O
2 - Grain yields are adjusted to 13% moisture, 60 lb. bushel
Fertiliier - 50 lbs. P,O, + 10 lbs. N as 1 l-52-00 - October 20, 1999 81 lbs. N available - soil test
57 lbs. N in water as urea - April 17,200O Herbicide - Bronate 1 lb. Al/Acre - February 28,200O Insecticide - DiSyston .75 lbs. Al/Acre - April 13,200O
u \D Fl m m N N I N -CI -00 u u -h 0 h P m P -.a v, -I. m m m -N r-T z.-\I -vl - r-P -2 -ST -m G. -m -* m m P v -VI 0 0 -0 -N 9 v, v) Y) 0 P N vl v) d v)
G’ rice ( wig very -R -MR -R iii 2 I -7 7 -5 -1 -I -6 -6 -4 -4 -5 -5 ID “t E i 2 -7 -7 -5 -2 -4 -4 -I -3 -> -1 -I
7
ss
4 -7 -7 -5 -4 -4 3 -3 -2 -8 -3 -3 g 5 -8 -8 -2 -5 -3 -3 -3 -4 -8 -3 -3 ttH qu; !l! i‘&gJ 5 7 7 5 5 5 5 fg 4 -2 -2 -3 -4 -4 -2 -3 -K -3 -5 -t cE
4 -2 -2 -6 -5 -6 -7 -5 -3 -JA -5 -7 gij -4 -4 -4 -I -4 -5 -3 -qA -4 -4 -5 -5 lenl 1AK V, kin -:0ptile v (1 g qua,+ 0850034/P1372129ff5* teputation.Developed from the hackcross transfer of RWA resistawe into Lamar. 2 Moderately resistant to RWA, tall, medium-late maturity, very goti
milling and baking quality characteristics. Similar to Lamar. extent oderately resisti; to dWA. ~. -~-~~r-~Developed from reselection within Prowers for imoroved RWA 2 Tall, long coleoptile, medium-late maturity, high test weight
nd very good milling and baking quality characteristics. Vew similar CSIJ-1999
KS-2000 TX-1984
o Lamar and Prowers, except for improved RWA resistance. 4
-resistant (different gene from CSU varieties), medium height and edium maturity. Good test weight. First entered in Colorado Variety Trials in 2000.
Developed via “hackcross transfer” of Greenbug resistance directly into 7 TAM 105. Bronze-chaffed, early maturing semidwarf, medium long
,coleoptile, good heat and drought tolerance. DCW~ end-use aualitv reputation. Very susceptible to leaf rust. . , AM 107
AM I05*4/Amigo
N c
S87H325iRio Blanco
andom Mating Population
7
Developed via “backcross transfer” of an additional Greenbug resistance gene directly into TAM 107. Very similar to TAM 107. Marginal end-use quality. Goad yield performance record in Colorado.
Hard white winter wheat (HWW) developed by KSU program in westen 3 Kansas (Hays). Medium maturity, semidwarf with, good straw strength, high test weight, and good end-use quality characteristics. Good drylanc pafommnce record in Colorado Variety Trials.
A private entry from Cargill-Goertzen. Medium-late semidwarf, very ,,A good straw strength, good test weights. Very good yield performance r.mder irrigated conditions in CSU Varietv Trials. Observed to shatter
uite se&y in 1999 (Lamar, CO dryland testing site).
(Medium-early, short, excellent straw strength. Good winterhardiness TX- I995 KSU-1999 Cargill-oertzen-2000 5 7 NA 6 umafP1372129//C0850034
irus t&tame (WSMV), test
NEB-1998 S 2 bnd baking quality characteristics. May bibest adapted for high-input, irrigated production systems.
all, early, very long coleoptile, very poor straw strength, strong KSU-1944 S
itendency to shatter prior to harvest. (Long-term check variety) Developed from a complex cross with 75% Vona parentage. Medium 2 maturity. semidwarf. very nood straw streneth. short coleootile. eood S -R csu-1991 csu-1997 ._ - . .u
aking quality characteristics.
!Developed via “backcross transfer” of RWA resistance directlv into 6
ngth (I and ba’
2 “ma. ‘Medium-maturing semidwarf. Very good straw stren&$ghly tter than Yuma despite taller Stature. Good baking quality
:COL), winterhardiness (WH), leaf rust resistance (LR), wheat streak mosaic :RWA), heading date
:ht (TW), Protein COI
Irrigated Forage Sorghum Hybrid Performance Test at Rocky Ford, 2000.
INVESTIGATOR: Frank C. Schweissing, Superintendent, Arkansas Valley Research Center, Rocky Ford, Colorado.
PURPOSE To identity high yielding hybrids under irrigated conditions. ,
PLOT: Two rows with 30” spacing, Summay:6mrbxJSeasonPrec+WmandTBnpRabrre/l 32’ long. SEEDING DENSITY: 96,800 ArkansasVdeyRgearchCenter,Radrlfwd, olmccwlly. Seed/A. PLANTED: May 19. MCillil Ram GOD/Z >WF >lCOF DAPP HARVESTED: September 13.
EMERGENCE DATE: 7 days after planting. SOIL TEMP: 60” F.
IRRIGATION: Four lirrrow irrigations: May 22, July 1, August 1, August 17, total applied 18 acre-in/A.
PEST CONTROL: Preplant Herbicide: Roundup 1 lb. AI/A. Preemergence Herbicide: biinox 2 lbs. AI/A. Insecticide: None. I in. -.6&p----w 0.22 101 7 2 12 June Ob!l 618 20 0 42 w 125 793 27 11 Ausust 1.36 751 29 6 1: Septanh 0.22 278 13 1 117
I
TOtd 3.65 2541 96 20 117 /l Gm*ingseasonhomMsl19(~)toSeptemberl3(harven). R GDD: GtwingDegreeDaysforsoqhum. /3DAp:DzpuefPlanlblg.CULTURAL PRACTICES: Previous crop: watermelons. Field Preparation: disc 2X, roller pack 2X, field cultivator, float. Cultivation: 2 X.
SOIL: silty-clay loam, l-1.5% O.M., pH-ca. 7.8. FERTILIZER: 50 lbs. P,O, and 150 Ibs. N/Acre.
COMMENTS: Cloddy soil conditions resulting in not as good a stand as we expected. Hot, dry summer. Adequate supply of irrigation water. No lodging. Greenbugs were not a problem. Forage yields very good.
Table l.-Irri@ted Forage Sorghum Hybrid Performance Test at Rocky Ford, 2000’
Days s%F Yield %
Brand Hybrid Forage to50% Stand Plant At aem Dry Forage of Test
Type* Bloom PlWA3 Ht. Hawed sugar Matter Yield’ Avg.
(No.) ( 1 0 0 0 X) @Is.) W) W) (TM
BUFFALO BRAND BUZzlo Brand s s I6 53.5 122 ED 9 42 42.19 123
BUFFALO BRAND GARRISON & TOWNSEND BUFFALO BRAND GARRlSON & TOWNSEND BUFFALO BRAND BUFFALO BRAND BUFFALOBRAND BUFFALO BRAND GARRISON & TOWNSEND BUFFALO BRAND MYCOGEN (Check) Gmzex BMR I27 SG-BMR-201 Grazexllw SG-BMR-301 Grazexn canex n CaneX Gmzex BMR 737 SG-BMR-100 GrszexBMR116 2725 NB305F ss 82 55.5 104 SD 10 36 38.45 112 SS 82 56.0 102 E D 9 33 37.00 108 ss 71 54.0 111 HD 10 45 36.59 107 ss V% 53.0 113 k3 7 23 36.43 106 ss 14 54.0 106 BD 10 37 34.86 102 FS 84 54.0 104 ED 12 34 34.61 101 FS I9 52.5 96 SD 12 33 34.14 100 SS I6 55.5 102 HD 8 36 33.50 98 FS 83 50.0 101 SD 5 31 32.62 95 ss 83 49.5 104 SD I 33 32.59 95 corn 69 30.0 81 HD 7 41 31.09 91 FS 87 57.0 108 SD 12 29 29.37 86
iWFFiL0 BRAND Canex BMR 208 FS 80 52.0 91 HD 3 34 26.00 76
AVerage I3 51.9 103 9 35 34.25
LSD (0.20) 3.08
1 - PlmtedMay 19,200o; Harvest septemba 13,200o
2 -Forage Type: FS, Forage Sorghum; SS, Sorghum Sudan grass 3 -Plant PopulatioIl per acre June 20,200o 4 - seed Maturation: ve& vegitative; PM, pIemilk; EM, early milk; MM, midmilk; LM, late a ED, early dough;
SD,softdow&HD,haddoqh
5 -Forage Yield adjusted to 70% moisture content based on oven-dried samples.
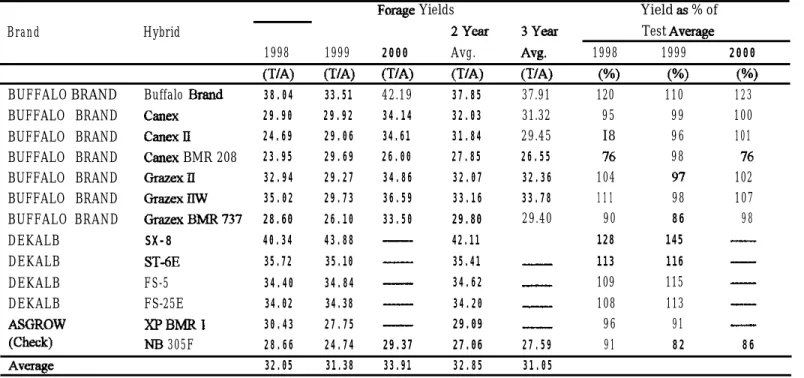
Table 2Aummrry: Irrigated Forge Sorghum Hybrid Performance Tests at Rocky Ford, 1998-2000.
Forage Yields Yield as % of Brand Hybrid 2Year 3Year Test Average
1998 1999 2000 Avg. Avg. 1998 1999 2000 (T/A) (T/A) (T/A) CW VW w W) W)
BUFFALO BRAND Buffalo Brand 38.04 33.51 42.19 37.85 37.91 120 110 123 BUFFALO BRAND C;meX 29.90 29.92 34.14 32.03
BUFFALO BRAND canex II 24.69 29.06 34.61 31.84
BUFFALO BRAND Canex BMR 208 23.95 29.69 26.00 27.85
BUFFALO BRAND Grazexll 32.94 29.27 34.86 32.07
BUFFALO BRAND Grazexllw 35.02 29.73 36.59 33.16
BUFFALO BRAND Grazex BMR 731 28.60 26.10 33.50 29.80
DEKALB SX-8 40.34 43.88 - 42.11 DEKALB ST-6E 35.72 35.10 - 35.41 DEKALB FS-5 34.40 34.84 - 34.62 DEKALB FS-25E 34.02 34.38 - 34.20 ASGROW XPBMRI 30.43 27.75 - 29.09 31.32 95 99 100 29.45 I8 96 101 26.55 I6 98 I6 32.36 104 97 102 33.78 111 98 107 29.40 90 86 98 128 145 -- 113 116 -- 109 115 -- 108 113 -- 96 91 -WW NB 305F 28.66 24.74 29.37 27.06 27.59 91 82 86 Average 32.05 31.38 33.91 32.85 31.05
Performance of Greenbug Resistant Sorghum Hybrids in the Arkansas Valley, 2000
F. C. Scbweissing’
This is a report of a gram sorghum trial with greenbug resistant hybrids conducted at the Arkansas Valley Research Center. The weather conditions were drier than normal through the growing season while temperatures were very warm. The annual precipitation of 9.60” was below the long term average (99 yr. = 11.88”) for the first time since 1994. Predator populations were significant but not evenly distributed in the field. Greenbug populations between plots within an untreated variety could be highly variable.
TESTING PROCEDURE
Individual plots of each hybrid consisted of four rows 72 feet long and spaced 30 inches apart. Each plot was split by four foot alleys with one-half sprayed, at random, with insecticides. Each hybrid was replicated four times,
The trial area was fertilized with 150 lbs. Of nitrogen and 50 lbs. of P,O, per acre. Plots were planted May 19,200O at 79,805 seeds per acre. Soil conditions were cloddy and dry and a emergence irrigation was needed. A preplant application of glyphosate at 1 lb. ai/acre and a pre-emergence application of bifenox at 2 lbs. ai/acre provided weed control.
The trial area was irrigated four times: May 22, July 1, August 4 and September 19. Carbo8tmn (.5 lbs. ai/a) + chlorpyrifos (.5 lbs. ai/a) and PBO (.l Ibs. ai/a) were applied to the sprayed plots for greenbug control on August 3,200O.
All plots were harvested October 27,200O with a self-propelled two row combine.
Table l.-Agronomic data for sorghum hybrids tested in the greenbug-resistant trial at Rocky Ford, 2000.
Sprayed Unsprayed
_- - -
-______---_---_---Brand Hybrid Days to Height Test Days to Height Test
Bloom wt. Bloom wt. (No) (W (Lb4 Wo) (14 (Lb4 CARGILL 576 68 41 54.4 68 40 53.9 CARGILL 627 69 48 56.0 69 47 54.8 CARGlLL 647 70 51 58.1 70 51 58.1 CARGlLL 697 75 49 55.4 75 50 53.6 CARGILL 77OY 76 49 53.3 76 48 51.4 NC+ 7Y57-K 82 54 53.7 82 52 52.7 TRIUh@H TRX93390 69 47 56.1 69 49 55.4 TRIUMPH TRx94090 73 52 56.3 73 51 56.7 TRIUMPH TRx94891 74 51 56.7 74 51 56.9 DEKALB x-914c 76 52 58.0 76 52 57.7 DEKALB X-91% 79 57 55.2 79 54 54.5 DEKALB x-944c 71 45 56.1 71 49 55.9 DEKALB DK-44c 71 48 56.2 71 49 55.6 DEKALB DK-53c 76 52 58.8 76 51 57.6 DEKALB DK-54~ 81 5.5 55.0 81 54 53.6 MYCOGEN 3636 72 43 53.0 72 41 52.3 MYCOGEN 3696 83 48 53.1 83 48 52.8 NOVARTIS 1486 72 43 52.6 72 42 51.6 NOVARTIS 1606 82 52 54.4 82 52 53.3 PIONEER 8500 68 47 57.7 69 48 56.7 PIONEER 8505 69 48 57.9 69 49 57.6 (Check) 399X2536 78 46 51.5 78 46 49.9 Average 74 49 55.4 74 49 54.7
RFSULTS
Agronomic data for the hybrids in this trial is presented in Table 1. Greenbug activity did not intluence the three factors to any great degree although the test weights for the unsprayed plots were somewhat lower than those in the sprayed plots. This was a relatively dry, warm year and the average days to bloom were less than recent years while degree-days during the growing season were above normal for our area (ca. 3099DD). Tbis was a good production year for grain sorghum in the trial, better than the 1997 overall treated trial average of 7503 lbs. per acre but not as good as the 1994 overall treated trial average of 9013 lbs. per acre.
Greenbug counts, obtained on August 9 and 17 in both sprayed and unsprayed plots, are presented in Table 2 as the average number of greenbugs per plant. The population was determined by counting the number of greenbugs on two plants in each plot. Greenbug counts in the untreated plots are an indication of relative levels of non-preference (antixenosis) and/or antibiosis factors in the plant. Overall populations were moderate in the untreated plots but the counts for several hybrids were as high or higher as those for the long time check variety (399X2536).
Four samples of greenbugs, collected from the trial area were sent to Dr. Gerald Wilde at Kansas State University for identification as to biotype and level of insecticide resistance. Fifteen subsamples were tested and twelve were found to be biotype I and three biotype K. Insecticide resistance varied from 11 to 18 percent in the samples. The convergent lady beetle, Hippoahiu convergens, and the green lacewing Chrysopa q~. were numerous in various areas of the plots and undoubtedly contributed to the variability in greenbug populations between plots within an untreated hybrid.
Yield loss indicates a combiition of damage to the plants by the greenbug populations present and level of tolerance to the infestation. Differences in yield between sprayed and unsprayed plots were highly variable for each hybrid. Some hybrids showed very little resistance/tolerance to the populations present in the untreated plots as indicated by the large yield differences. In other hybrids, populations were low in the untreated plots combmed with low yield differences, Incremental differences occurred with other hybrids between the two extremes.
Growers interested in the yields that can be obtained from these hybrids should note the rankings in Tables 2 and 3. Significant differences occurred between hybrids in both the sprayed and unsprayed plots. Table 2 ranks the hybrids according to their yield performance in the unsprayed plots. Table 3 ranks the hybrids accordmg to their performance in the sprayed plots. One of the hybrids produced higher yields in the unsprayed plots than their sprayed counterparts (Table 3).
This year is the first year since 1997 that greenbug populations developed to sufficient numbers to cause differences in yield between the sprayed and unsprayed plots of at least some of the hybrids. Two hybrids actwlly had greater yield differences between the sprayed and unsprayed plots than our longtime standard open pedigree hybrid (399X2536) although yields were substantially lower in the check.
It appears that predators and the parasite, LySiphZe&s festuceipes, have been very effective in reducing greenbug populations. The availabii of a number of greenbug resistant/tolerant varieties enhanced the predator/parasite effect along witb greater than usual rainfall, during the growing season, for most of the past ten years. Although biotype I and now K have been present in our fields since 1991 neither have caused major damage to commercial production, as yet.
Soybean Variety Trial - 2000 Arkansas Valley Research Center
This is the second soybean trial at the Center. Trials were initiated in 1999 due to a renewed interest in oil crops, in part, because of a new processing plant which has been established at Lamar. Precipitation was below normal through the growing season as was total precipitation for the year at 9.60”. Irrigation water supplies were very good. Yields were substantially better than last year and averaged 66 bushels per acre for the trial compared to 53.7 bu. Per acre in 1999. Yields ranged from 57.5 bu. to 74.2 bu. per acre.
Test Plot Information
Purpose - To evaluate the inherent genetic abiity of selected soybean varieties to yield under irrigated conditions in the Arkansas Valley.
Data - 1. Yields
Plots - 32’ X 10’ (4 rows) Harvest-2 rows
Design - Bandomized complete blocks (3 replications)
Variety - 17 entries
Fertilizer - 50 lbs. P20JA - 10/20/99
Equivalent of 15 oz. of soybean imroculant/300 tbs. of seed Herbicide - Pursuit .0626 lbs. AI/Acre - 6/6/00
Poast .28 lbs. AI/A + pt. Dash/A. - 6/20/00 Basagran 1 lb. + Blazer .25 lbs. AI/Acre - 6/23/00
Insecticide - none
Soil - Silty, clay loam, l-l.5 o.m., pH - ca. 7.8
Plant - May 3 1,200O 174,240 seeds/Acre 30” rows Irrigate - 6/l, 6112, 718, 7125, 8110, 8125, 9115
Harvest - October 13,200O Self propelled two row plot combine Frank C. Schweissing James P. Hain
Table I.-Performance of soybean varieties at the Arkansas Valley Research Center, C.S.U., Rocky Ford, Colorado. 2000.
Variety Brand Test Test
Yield Average Weight Moisture
DKB 38-51 346 RR 5404 93851 5383 5370 RR TR3750 RR 93834 TR3939 RR CX391 RR AG 3701 5316 RR AG4101 TR4319 RR 429 RR 94801 DeKalb Producers Mycogen Mycogen Mycogen Triumph Pioneer Triumph DeKalb Asgrow Mycogen Asgrow Triumph Producers Pioneer Bu.lA 74.2 72.4 71.3 71.2 70.8 67.8 67.6 66.7 65.7 65.7 65.4 63.6 63.4 61.3 60.9 58.8 % 112 110 108 108 107 103 102 101 99 99 99 96 96 93 92 89 Ibs.lbu. 56.0 56.2 55.8 56.1 56.0 56.2 56.4 56.8 56.6 56.4 57.0 55.7 55.7 55.6 56.9 56.5 % 8.3 8.5 8.4 8.4 8.3 8.3 8.4 8.4 8.7 9.0 8.3 8.5 11.8 14.4 8.9 8.9 9396 Pioneer 57.5 87 56.6 Average 66.0 CV% 7.2 LSD(.lO) 5.7
Plant - May 31,200O
Fertilizer - 50 Ibs. P,OJAcre Soybean innoculant - 15 oz./300 Ibs. of seed Herbicide - Pursuit .0626 Ibs. Al/Acre - 6A3
Poast .28 Ibs. AI/Acre + Dash - 6/20
Basagran 1 tb. + Blazer .25 Ibs. Al/Acre - 6/23 Fungicide - 0 Insecticide - 0
Harvest - October 13,200O
8.3