JOURNAL OF
ENVIRONMENTAL HYDROLOGY
The Open Access Electronic Journal of the International Association for Environmental Hydrology
On the World Wide Web at http://www.hydroweb.com
VOLUME 23
2015
HYDROCHEMISTRY OF SPRINGS, NAJAF AREA, IRAQ
S.A.J.M. AL-Dahaan 1 Hussain M. Hussain 1
Nadhir Al-Ansari 2
Sven Knutsson 2
1 Department of Geology, Faculty of Science, University
of Kufa, Kufa, Iraq
2, Department of Civil, Environmental and Natural
Resources Engineering, Luleå University of Technology, Lulea, Sweden
Springs exist in the southwestern desert of Iraq at Najaf at latitude 31º 00'- 32º 15' and longitude 43º 30'- 44º 30'. Two aquifers exist in the area. The first is composed of recent deposits while the second aquifer is of Miocene age. The latter is important because it contains huge quantities of groundwater. Water of these springs is slightly brackish and very hard. The predominant salt in the water of these springs is magnesium sulfate (MgSO4) and sodium chloride (NaCl). The water type is
sulfate. Most of the springs (70%) are of marine water origin, while the remainder (30%) are of continental water origin.
INTRODUCTION
Iraq relies heavily on the Tigris and Euphrates Rivers for its water resources and the use of groundwater resources is less than 10% (Al-Ansari, 2013; Al-Ansari et.al. 2014; Al-Ansari and Knutsson, 2011). Recently, Iraq is experiencing a water shortage crisis due to the construction of dams on the Tigris and Euphrates and their tributaries outside the border of Iraq, the effect of global climate change, and mismanagement of water resources. These are the main factors responsible for the water shortage problems in Iraq (Al-Ansari, 2013). This requires that other resources be used (e.g. groundwater) to overcome this problem.
Most of the water is consumed for irrigation purposes in Iraq (Al-Ansari, 2013; Al-Ansari et.al. 2014; Al-Ansari and Knutsson, 2011). The agricultural practices are restricted to a narrow strip along the Tigris and Euphrates Rivers and groundwater use for irrigation is very limited. Local people in Iraq had used hand-dug wells long time ago for domestic use of water. Hydrogeological studies indicate that there are 14 main aquifer groups available in Iraq divided into five hydrological units (Krasny et al., 2006).
Estimated groundwater use is about 12 billion cubic meters (Alsam et al., 1990). More than 50% of the groundwater is consumed for domestic purposes. This amount represents only 20% of the available resources that had been exploited (Alsam et al., 1990).
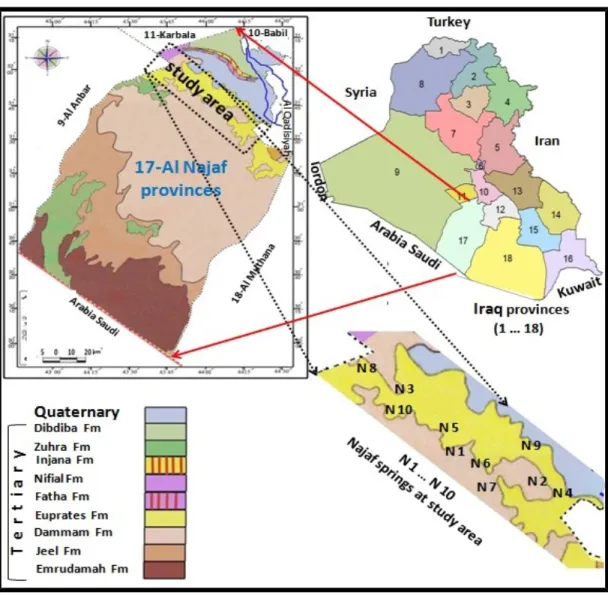
In this research, springs located in area which is considered as part of south western of Iraq in Najaf area governorate ( latitude 31º 00 – 32º 15 and longitude 43º 30 – 44º 30 ) had been investigated (Figure. 1) to find out their hydro-chemical characteristics. Najaf springs are a part of a series of springs that extend from Hit city (Al-Anbar governorate) in the west of Iraq to Samawa city (Al-Mothanna governorate) in the south western part of Iraq. They are nearly parallel to Euphrates on the eastern edge for western desert. The general direction for the distribution of springs coincides with that of faults running northwest–southeast (Budy and Jassim, 1987, Fouad, 2007, Al-Jiburi and Al-Basrawi, 2007 & 2009, Ma’la, 2009). Water supplied from springs is of more interest in Iraq now especially in areas where surface water is scarce.
GEOLOGY AND STRATIGRAPHY
Sedimentary rocks formations are the exposed rocks within the study area. The age of these formations is ranging from upper Cretaceous to Quaternary period (Figure 1) (Budy and Jassim, 1987; Al-Juburi, and Al-Basrawi, 2007).
There are many faults in the western desert with two main directions. First, deep primary faults with direction northeast–southwest plus some of complementary faults with direction northwest–southeast. The second direction, is the deep secondary faults with direction north–south and east–west. The distribution of springs takes a north–south trend. At the study area they are located in a depression (Bahar- Al-Najaf) and they are bounded from the north by steep slope cliffs. Sand dunes, alluvium and retaining of cliff wall cover the surface of study area. Dammam formation outcrops at the western side of the study area. The Euphrates formation uncomformably overlies Dammam followed by conformable contact with Dibdiba formation. Table 1 shows the depth and thickness of the sequence, lithology and the age of each formation (Hassan, 1973).
Figure 1. Locations and geologic map for springs at study area. Table 1. Stratigraphic section for study area (Al-Kifl Well. No. 1).
Formation Age Lithology Thickness Depth Soil and alluvial deposits
Dibdiba fm U. MiocenePleistocene Sand, feldspar and marlFriable sand gravel 93.5.M 93.5.M Fatha M. Miocene Gypsum, silty gypsum, lime
clay and limestone 106.4.M 197.M Euphrates L. Miocene Fine grains limestone with
lime clay
43.6.M 303.4.M Dammam U. Eocene Fine grains of dolomitic
limestone and lime clay at lower part
189.9.M 374.M Rus L. Eocene Limestone with fine grains of
anhydrite and dolomite 73.6.M 536.9.M Al-Alegy L. Eocene
Paleocene
Lime clay, limestone and dolomite
271.9.M 610.5.M Shiranish U. Cretaceous Lime clay containing a cutting
HYDROGEOLOGY
Two main aquifers were studied; the first is composed of recent deposits while the second is of Miocene deposits (Dibdiba Formation- U. Miocene, Fatha- M. Miocene and Euphrates formation- L. Miocene). Recent sediments are mainly sand pebbles, silt and mud or clay. Miocene aquifer is mainly composed of pebbly sandstone and sandstone with some clay stones, siltstones and marl associated with secondary gypsum. These deposits contains more significant amount of groundwater under hydrostatic pressure compared to recent deposits. This leads groundwater to flow naturally above the earth surface forming these springs (Hassan, 1973).
Chemical analysis for Miocene water proved the presence of two types of water mainly: 1-Magnesium-sulfate water type.
2-Sodium-chloride water type.
There is huge anticline that covers the eastern part of the western-southern desert and the studied area lies within the northern part of this fold. The fold is very gentle and the recharge area in this area is located north of this anticlinal area while the discharge area is where the springs exist. These aquifers are all confined (Buday and Jassim, 1987).
MATERIALS AND METHODS
Ten (10) water samples were collected from the springs at the studied area in April, 2014. The collected samples were chemically analyzed for the major cations and Anions. Unstable parameters such as pH and electrical conductivity (EC) were measured in the field using pH meter and EC meter. Sodium and potassium contents were determined by using Flame photometer. Calcium and magnesium contents were determined by EDTA. Chloride was determined using the APHA (1992) procedure. Sulfate concentrations were obtained using Technical ultra violet spectrophotometer (U.V). Carbonate and bicarbonate contents were measured by acid-base titration (Adams, 1990). TDS was measured using vaporization at 105 C º (Boyed, 2000).
The accuracy for the measurements of cations and anions in the water samples was calculated according to following equations (Hem, 1989, Kehew, 2001).
r∑Cations - r∑Anions
R.D % = --- × 100 (1) r∑Cations + r∑Anions
A % = 100 – R.D% (2) where R.D % = Relative Difference, r∑Cations and r∑Anions = sums of positive and negative concentrations (equivalent per million – epm), and A = accuracy.
Results are acceptable where R.D % ≤ 5%, they are accepted with risk where 5% ≤ R.D % ≤ 10%, ane are unacceptable if R.D % > 10% . The results indicated that the accuracies for all samples were within acceptable limit.
Total Dissolve Salts (TDS), Electrical Conductivity (EC) and major cations and anions (TCS) were also tested according to the following:
where TCS = ∑Major Cations + ∑Major Anions.
TCS is calculated major anions and cations which are less than TDS and EC represents the electrical conductivity for all cations and anions (TDS + TCS).
The results were acceptable according to Fetter (1980).
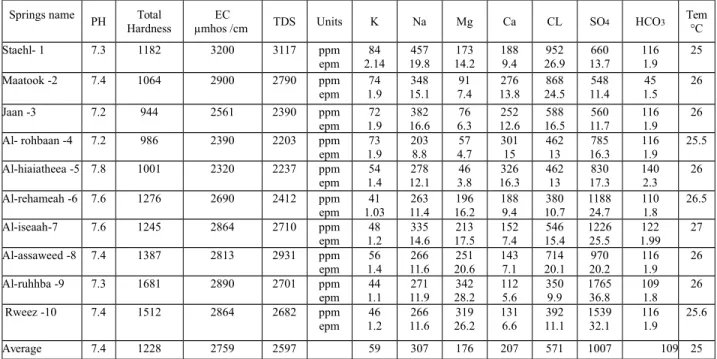
Table 2. PH, total hardness, EC, TDS, major ions and temperature for water springs.
Tem C ° HCO3 SO4 CL Ca Mg Na K Units TDS EC µmhos /cm Total Hardness PH Springs name 25 116 1.9 660 13.7 952 26.9 188 9.4 173 14.2 457 19.8 84 2.14 ppm epm 3117 3200 1182 7.3 Staehl- 1 26 45 1.5 548 11.4 868 24.5 276 13.8 91 7.4 348 15.1 74 1.9 ppm epm 2790 2900 1064 7.4 2 -Maatook 26 116 1.9 560 11.7 588 16.5 252 12.6 76 6.3 382 16.6 72 1.9 ppm epm 2390 2561 944 7.2 3 -Jaan 25.5 116 1.9 785 16.3 462 13 301 15 57 4.7 203 8.8 73 1.9 ppm epm 2203 2390 986 7.2 4 -Al- rohbaan 26 140 2.3 830 17.3 462 13 326 16.3 46 3.8 278 12.1 54 1.4 ppm epm 2237 2320 1001 7.8 5 -Al-hiaiatheea 26.5 110 1.8 1188 24.7 380 10.7 188 9.4 196 16.2 263 11.4 41 1.03 ppm epm 2412 2690 1276 7.6 6 -Al-rehameah 27 122 1.99 1226 25.5 546 15.4 152 7.4 213 17.5 335 14.6 48 1.2 ppm epm 2710 2864 1245 7.6 7 -Al-iseaah 26 116 1.9 970 20.2 714 20.1 143 7.1 251 20.6 266 11.6 56 1.4 ppm epm 2931 2813 1387 7.4 8 -Al-assaweed 26 109 1.8 1765 36.8 350 9.9 112 5.6 342 28.2 271 11.9 44 1.1 ppm epm 2701 2890 1681 7.3 9 -Al-ruhhba 25.6 116 1.9 1539 32.1 392 11.1 131 6.6 319 26.2 266 11.6 46 1.2 ppm epm 2682 2864 1512 7.4 10 -Rweez 25 109 1007 571 207 176 307 59 2597 2759 1228 7.4 Average
RESULTS AND DISCUSSION
Physical properties
Generally, the water of the springs in the study area was colorless and its temperature ranges between 240 and 270C. The pH was ranging between 7.2 to 7.8, with an average value 7.4 (see table 2).
Electrical Conductivity (EC) and Total Dissolved Solids (TDS)
EC: Is the ability for (1 cm³) of water to connect electric current at 25° C (Todd, 2005). It is a mark of ions type, temperature and dissolved constituents type (Boyed, 2000). Electrical conductivity is indirect method for salinity measurement (Hem, 1989). The response of the conductance value with temperature may change at different salts and concentrations. Generally if the temperature of the sample increases of 1°C it wil lead to an increase of about 2% in conductivity.
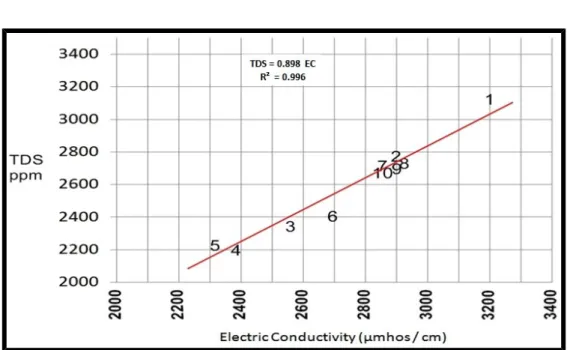
The range of EC in the water springs was (2320 – 3200) µmho /cm and the average was (2759) µmhos /cm.
TDS: Solids remaining after evaporation of water sample to dryness is referred to as total dissolved solids (Drever, 1997). TDS represents summation of all concentrations of cations and anions.
The range of total dissolved solids in the water of the springs was (2203 – 3200 ppm) and the average was (2597 ppm) (Table- 2). Using the TDS values of the springs, they are slightly-brackish
according to Todd (2005) (Table 3).
The relationship between EC and TDS (Figure 2) gave a linear relationship with positive correlation coefficient (r = 0.996) (Figure 2).
Table 3. Classification of water according to TDS (ppm).
Water class (Goorel.1958) (Altoviski.1962) (Drever.1997) (Todd.2005) Fresh water 0 – 1000 0 – 1000 < 1000 10 - 1000 Slightly water --- 1000 - 3000 1000 – 2000 ---Slightly-brackish water 1000 – 10 000 3000 – 10 000 2000 – 20 000 1000 – 10 000 Brackish water 10 000 – 100 000 10 000 – 100 000 --- 10 000 – 100 000 Saline water --- --- 35 000 ---Brine water > 100 000 > 100 000 > 35 000 > 100 000
Figure 2: Relationship between total dissolved solids and electrical conductivity.
Chemical Properties
Calcium:
It is product of many kinds of rocks and minerals like (carbonate and gypsum rocks, amphibole, feldspar and pyroxene minerals) and/or fertilizers (Hem, 1989). The range of calcium in water of the springs was (112 – 326 ppm) and the average was (207 ppm). (Table- 2).
Magnesium:
The source of magnesium is weathering of different minerals like pyroxene, biotite, amphibole and mica in igneous rocks and Sedimentary rocks such as magnesite, dolomite and brucite. So it can be found in Palygorskite of clay minerals (AL-Qaraghuli, 2005). The range of magnesium in water of the springs was (46 – 342 ppm) and the average was (176 ppm). (Table- 2).
Sodium:
minerals (Appelo and Postman, 1999). The most soluble salt of sodium compound is sodium chloride (NaCl) while the sodium bicarbonate (NaHCO3) is the least soluble one. The range of sodium in the water of the springs was (203 – 457 ppm) and the average was (307 ppm) (Table- 2).
Potassium:
The source of potassium is the weathering for mica (biotite), microcline, orthoclase and feldspathoid leucite of igneous rocks. It is present in clays like Illite, Sylvite of evaporates rocks and organic remains (Hem, 1985).
The range of potassium in the water of the springs was (41 – 84 ppm) and the average was (59 ppm) (Table 2).
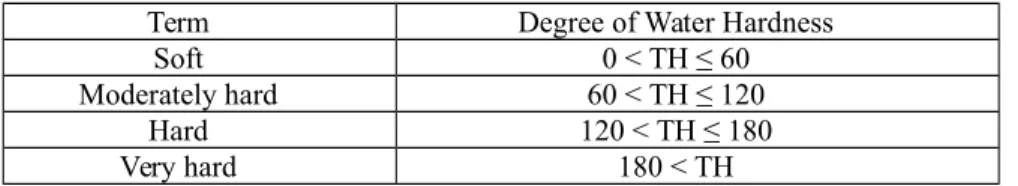
Total Hardness (TH):
It is an indicator for presence of Calcium and Magnesium in water. Hardness can be precipitated by water heating. Total hardness was calculated as follow:
TH = 2.497 Ca+2 + 4.115 Mg+2 (3)
where: TH, Ca+2 and Mg+2 is measured in ppm.
Hardness is important at evaluating the local use of water springs. There are four degrees of hardness according to Todd (2005) water classification (Table 4). The range of hardness (Table 2) for the springs was (944 – 1687 ppm) and the average was (1228 ppm). According to the classification of Todd (2005), all the water springs at study area are very hard water.
Table 4. Classification of water according to the total hardness (Todd.2005).
Term Degree of Water Hardness Soft 0 < TH ≤ 60 Moderately hard 60 < TH ≤ 120
Hard 120 < TH ≤ 180 Very hard 180 < TH
Chloride Ion Cl-1:
It is one of the most abundant halogens. The source of chloride is halite and Sylvite of sedimentary rocks, apatite and feldspathoid of igneous rocks and in the groundwater from old marine water (Davis and Dewist,1966; WHO, 2007). The range of chloride in the water of the springs was between (350 – 952 ppm) and the average was (571 ppm) (Table 2).
Sulfate Ion SO4-2:
Gypsum and anhydrite is the main source of sulfate in springs. Also, the oxidation of barite mineral (BaSO4) gives sulfates, besides fertilizers that contain different quantities of sulfate. The H2S gas in the atmosphere of industrial and biological activities is finally oxidized to SO2 and then to sulfate (WHO, 1996; Todd, 2005). The range of sulfate in the water of the springs was (548 -1765 ppm).The average was (1007 ppm) (Table 2).
Bicarbonate ion HCO3-1:
(H+). High depletion of (HCO3) into CO3 at (pH > 8.2), Hydrogen ion (H+) will be added to the
carbonate (CO3) and become dissolved bicarbonate at (8.2 > pH) (Davis and Dewiest, 1966). The range of bicarbonate in the water of the springs was (45 – 140 ppm). The average was (109 ppm) (Table 2).
The distributions of calcium, magnesium, sodium and potassium are controlled by lithology, discharge – recharge rates and ionic exchange. At the study area, the sources of Ca+2 and Mg+2 are the
calcareous and evaporates materials in the Euphrates and Dammam formations. The highest concentrations of Ca+2 and Mg+2 were located in high discharge springs at low lying area (Figure 1).
The distribution of Na+1 and K+1 reflects a variety in their sources. This might be due to the mixing of
water springs with water of Euphrates aquifer of marine origin and/or the effect of the sediments of Euphrates and Fatha aquifers. These sediments are production of the weathering and erosion of igneous rocks at Arabian shield. These conditions are leading to ionic exchange which is plying a big role in the ions concentrations of the water of the springs.
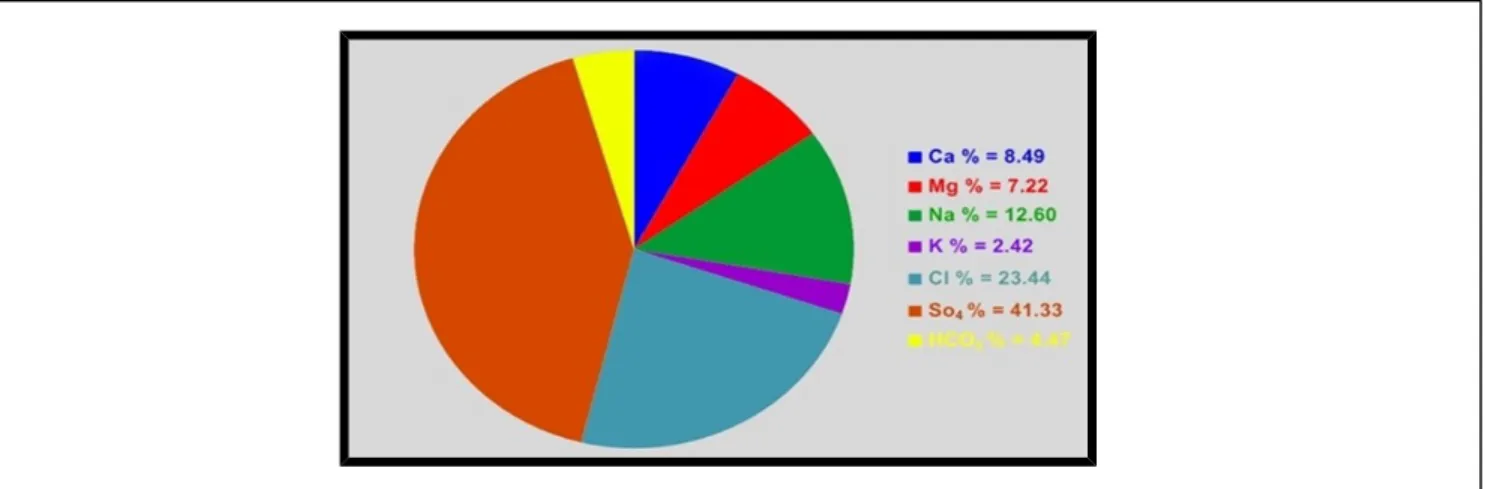
The results indicate that SO4 ions were dominant in water of the springs (Figure 3). This suggests that a source for Sulfate ions exists. This is due to the presence of evaporate minerals such as gypsum and Anhydrite of Fatha and Rus and Dammam Formations. Chloride ion concentration showed an increase in some springs, this increase is a result of mixing of marine water in Euphrates Formation with Meteoric water in Dammam Formation. Bicarbonate ion concentrations were variable at acceptable limits.
Figure 3. Average percentage of concentrations for major ions in springs. Hydrochemical Formula:
Water type can be known from the hydrochemical formula. It depends on the ratio of major ions (epm %) which had more than (15%) availability (Ivanov et.al., 1968).
The hydrochemical formula usedfor the water of the springs was: (SO4. Cl. HCO3) epm%
TDS (ppm) =--- PH (4) (Ca. Na. Mg. K) epm%
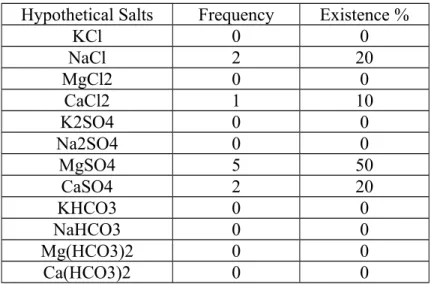
Results showed (Table 5) the predominance of Magnesium sulfate (MgSO4) salt at the springs. It consists (50%) of total samples. The locative distribution for other salts are (20%) for each calcium
sulfate and sodium chloride with (10%) for calcium chloride. More over the sulfate water type (SO4) contains (70%) of water in the springs. This is meaning, sulfate water is a result for leaching of sulfate ions from Rus formation (Table 1) by the water of the springs. The existence of sulfate water type is due to the effect of the presence of gypsum and anhydrite. Also springs contains considerable concentrations of chloride (Cl). Meybeck (1983) stated that (55%) of chloride ions in the groundwater are from rocks erosion, and about (45%) are from rain cycles. The increase at Chloride is consistent with the decrease of sulfate ions concentrations. Furthermore, the hypothetical salt combination showed the predominance of MgSO4 salt (Table 6).
Table 6. Hypothetical salts for water springs. Hypothetical Salts Frequency Existence %
KCl 0 0 NaCl 2 20 MgCl2 0 0 CaCl2 1 10 K2SO4 0 0 Na2SO4 0 0 MgSO4 5 50 CaSO4 2 20 KHCO3 0 0 NaHCO3 0 0 Mg(HCO3)2 0 0 Ca(HCO3)2 0 0
Table 7. Average of hydrochemical ratios for water springs
Springs number and
name. rNa / rCl rNa / r (Cl+SO4) r (Na+Mg) / rCl Origin
1- Staeh 0.74 0.49 1.20 Marine 2 -Maatook 0.62 0.42 0.92 Marine 3- Jaan 0.99 0.59 1.06 Marine 4 -Al-rohbaan 0.68 0.30 1.03 Marine 5 -Al-hiaiatheea 0.93 0.40 1.20 Marine 6- Al-rehameah 1.07 0.32 2.60 Continental 7-Al-iseaah 0.95 0.36 2.08 Marine 8- Al-assaweed 0.58 0.29 1.60 Marine 9 -Al-ruhhba 1.20 0.25 4.00 Continental 10- Rweez 1.05 0.27 3.40 Continental
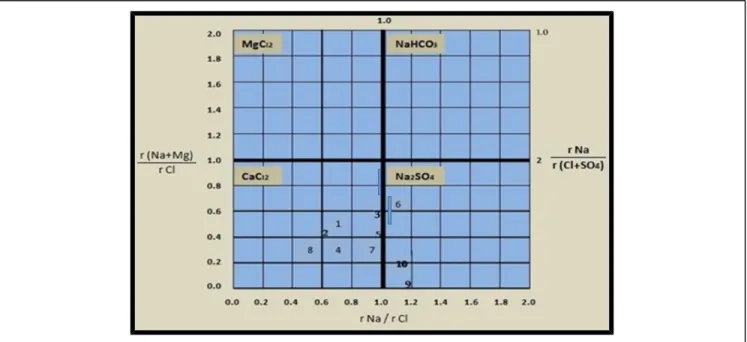
Figure 4. Plot of the water of the springs on the diagram for origin of groundwater.
Origin of springs
The ratio of positive and negative ions is usually used to detect the origin of groundwater (Sulin, 1946, Al-Fatlawi, 2010). Accordingly, the ratio between sodium ion concentration (epm) and chloride ion concentration (epm) (rNa / rCl) is used for this purpose as follows:
If rNa / rCl > 1, then the water is of Continental origin i.e. it is atmospheric water. If rNa / rCl< 1, then the water is of Marine origin.
Thus two classes can be distinguished for the origin of groundwater depending on the ratio of (rNa / rCl). Figure 4 show that most of the springs (70%) are of marine origin (CaCl2), while the other (30%)
are of continental origin (Na2SO4) according to Table 7.
CONCLUSION
The springs of Najaf area follow the trend of major faults in the area. The main source of water for these springs is the Miocene aquifer. The water of these springs is slightly-brackish where the range of total dissolved solids is 2230-3200 (average is 2597 ppm). All the water of these springs is very hard type where total hardness is between 944-1687 and the average is 1228 ppm. Magnesium sulfate and sodium chloride are the predominant salts in the water of the springs. About 70% of the water of these springs is of marine origin while the remainder is of continental origin.
ACKNOWLEDGMENTS
The authors would like to thank Professors R. Alkhaddar of Liverpool JM University and M. Alshawi of Salford University for their fruitful suggestions and discussions.
REFERENCES
Adams, V.D. 1990. “Water and wastewater examination manual”, Lewis Publishers, 247p.
Al-Ansari, N.A. 2013. “Management of Water Resources in Iraq: Perspectives and Prognoses”, J. Engineering, 5, 8, 667-684.
Al-Ansari, N.A. and Knutsson, S. 2011. “Toward Prudent management of Water Resources in Iraq”, J. Advanced Science and Engineering Research, 1,53-67.
Al-Ansari, N.A., Ali, A. and Knutsson, S. 2014. “Present conditions and Future Challenges of Water Resources Problems in Iraq”, J. Water Resources and Protection, 6, 12,1066-1098.
Al-Fatlawi, A. N. 2010. “Hydrogeological Study for Umm Er Radhuma Aquifer – West of Iraq”, PH.D. Thesis, Baghdad University Iraq (Unpublished).
Al-Juburi, H.K.,Al-Basrawi, N.H. 2007. “Hydrogeology”, in Geology of Iraqi Western desert, Special Issue of Iraqi Bulletin of Geology and Mining, 125-144.
Al-Juburi, H.K.,Al-Basrawi, N.H. 2009. “Hydrogeology”, in Geology of Iraqi Southern desert, Special Issue of Iraqi Bulletin of Geology and Mining,77-92.
Al-Qaraghuli, N. A. 2005. “Content of Nutrient elements (Total, Water Soluble and Available) in Fertilizers (TSP, MAP, NP& NPK) Produced from Al-Qaim Plant”, Iraqi Journal of Agricultural Science, 36, 5, 35-41. Alsam, S., Jassim, S.Z. and Hanna, F. 1990. “Water balance of Iraq: stage 2, geological and hydrogeological
conditions”, Report, Ministry of Irrigation, Iraq.
APHA, 1992. “Standard Methods for the Examination of Water and Wastewater”, American Public Health Association, New York. 16th Ed.
Appelo, C. A. J. and Postman, D. 1999. “Geochemistry, Groundwater and Pollution”, Rotterdam, A. A. Balkama, 536P.
Boyed, C. E. 2000. “Water Quality an introduction”, Kluwer Academic Publisher, USA. 330P.
Budy, T. and Jassim, S. Z. 1987. “The Regional Geology of Iraq (Tectonism, Magmatism and Metamorphism)”, Report submitted to the Iraqi Geological Survey, 325P.
Davis, S. N., and Dewest, R.J.M. 1966. “Hydrogeology”, Johan Wiley and Sons. Inc., New York. 464P.
Drever, J. I. 1997. “The Geochemistry of Natural Water, Surface and Groundwater Environments”, 3rd ed.,
prentice Hall, USA, 436P.
Fetter, C. W. 1980. “Applied Hydrogeology”, Charles Merrill Pub. Co. A. B. Bell and Howell Company, Columbus, Ohio, 488P.
Fouad, S.A. 2007. “Tectonic and Structural Evolution”, in Geology of Iraqi Western desert, Special Issue of Iraqi Bulletin of Geology and Mining, 29-50.
Hassan. A. H. 1973. “Hydrological, hydrogeological and hydrogeochemical Investigations of Bahar Al-Najaf area”, M.Sc. Thesis. University of Baghdad (Unpublished).
Hem. J. D. 1985. “Study and interpretation of the Chemical Characteristics of Natural Water”, 3rd.U. S. G. S.
Water Supply Paper. 2254. 263P.
Hem, J. D. 1989. “Study and Interpretation of the Chemical Characteristics of Natural Water”, U.S Geological Survey, Water Supply Paper 2254, 246P.
Ivanov. V. V., Barvanov. L. N. and Plotnikova.G. N. 1968. “The Main Genetic Type of The Earth's Crust Minerals Water and Their Distribution in USSR”, Inter. Geol. Cong. Of 23rd Sessions, Czehholoslovakia, Vol.
12, 33P.
Kehew, A. E. 2001. “Applied Chemical Hydrology”, Prentice Hall, New Jersey, 368P.
Krasny, J., Alsam, S., and Jassim, S. Z. 2006. “Hydrogeology”, In Geology of Iraq. 1st ed. Published by Dolin, Prague and Moravian Museum. Prague.
Ma’ala, K.A. 2009. “Tectonic and Structural Evolution”, in Geology of Iraqi Southern desert, Special Issue of Iraqi Bulletin of Geology and Mining,35-52.
Meybeck, M. 1983. “Atmospheric Inputs and River Transport of Dissolved Substances”, In: Dissolved Loads of Rivers and Surface Water, Quality/Quality Relationship,
Proc. Hamburg Symposium, Wallingford, U.K; LAHS Publ.
Sulin, V. A. 1946. “Waters of petroleum formations in the system of natural water”, Gostoptekhiz-dat, Moscow (in Russian), 35-96.
Todd, D. K. 2005. “Groundwater Hydrology” (3rd edition), John Wiley and Sons, New York, USA, 650P.
WHO, World Health Organization 1996. “Guideline for Drinking Water Quality”, 2nd Ed., Vol.2,
Recommendations, World Health Organization, Geneva, 951P.
WHO, World Health Organization 2007. “Guide Fine for Drinking Water Quality: Recommendation”, 4th ed.
36P.
ADDRESS FOR CORRESPONDENCE Nadhir A. Al-Ansari
Department of Civil, Environmental and Natural Resources Engineering Lulea University of Technology
Lulea, Sweden