doi: 10.17265/1934-7359/2017.07.002
Risk Management Concepts in Dam Safety Evaluation:
Mosul Dam as a Case Study
Nasrat Adamo1, Nadhir Al-Ansari1, Jan Laue1, Sven Knutsson1 and Varoujan Sissakian2
1. Department of Civil, Environmental and Natural Resources Engineering, Lulea University of Technology, 97187, Lulea, Sweden; 2. Department of Geology, University of Kurdistan, Hewler, Iraq
Abstract: Gradual shift has been observed lately of dam safety procedures from the conventional technical based towards a wider
scope of risk management procedure based on risk analysis. The new approach considers the likelihood level of occurrence of a multitude of hazards and the magnitude of the resulting possible consequences in case of failure using rational cause and effect arguments. Most dam owners are shifting towards the use of the new risk based procedures; and even governments themselves are moving towards formalizing the new trend. Legislations in the United States were promulgated [1] after serious dam failures and the adoption of stringent levels of scrutiny led such federal dam owners to pioneer in this field and in developing the concepts and methods required. The corner stone in risk analysis is the definition of the potential modes that may lead to failure and assessment of the likelihood levels of their occurrence and possible category of the consequences which, after thorough evaluation, will shape the decision making. This type of analysis was applied to Mosul Dam as a case study and resulted in definite recommendations.
Key words: Risk analysis, risk management, Mosul Dam, Iraq.
1. Introduction
Due to changing values of society in the last few decades and specially so in respect to dam safety, it has become necessary to provide and develop tools to look into the worth of new dams in order to facilitate their acceptance by the various groups active in forming public opinion and by financing agencies looking for best returns in the fragile world’s economies of today. New values have been adopted by various elements which include such groups as environmentalists, welfare societies, health organizations and insurance companies in their outlook towards dams. Nobody can; however, ignore the fact that most countries continue to build new dams to generate and store clean energy even with the development of nuclear, wind and solar forms of power. Highly developed countries and, to lesser degree, the lesser developed ones are burdened with a legacy of thousands of aging dams which need regular
Corresponding author: Nadhir Al-Ansari, professor;
research fields: water resources and environment. E-mail: nadhir.alansari@ltu.se.
re-evaluation in the light of their safety concerns and their potential hazards in addition to their diminishing benefits. These old dams may need basic repairs and upgrading measures, which require very large investments. In many cases, the decision maker could face at certain point the situation where a drastic decision of closing a facility might have to be made. The possibility of decommissioning the dam has to be checked especially if it poses a grave safety hazard or has expired due to sedimentation or malfunctioning and does not meet the requirements of today’s safety standards or operation requirements.
In the past, the subject of dam safety was treated on a purely technical basis as related to floods, seismicity, foundation conditions and dam design, and questions of human errors of operation were to be avoided by compiling detailed operation and maintenance manuals have been avoided. The development of the new line of thoughts, however, requires new decision concepts, which infuse the new social and economic values and the limitation of resources in the decision-making
D
processes. Much work has been done during the past four decades on this field which has resulted in what is known now as risk management as an evaluation and optimization tool in this field.
2. Traditional Dam Safety Procedures and
Risk Management
In the context of dam safety evaluation, a clear shift of public opinion and management policies is observed from the old and traditional dam safety procedures which normally deal with the impacts of a given hazard such as an extreme flood, seismic event or a certain deficiency towards a wider framework of decision making processes known as risk assessment. This framework, while it embraces the old procedures and principles, adds other elements into the process. They aim towards improving the understanding of dam behavior, assisting in finding new ways to satisfy investigation and surveillance needs. They also assist in identifying measures for risk reduction and contributing to the optimization process of resource allocation in addressing the needs of one dam or group of dams. Risk analysis drives towards more accurate estimates of hazards frequencies and expected damage. In such approach, the uncertainties are partly related to the natural randomness of hazards, and partly because of our incomplete understanding and measurement of the hazards exposure and vulnerability to be considered. In a statement made in the proceedings of the third United Nations Conference on Disaster Risk Reduction [2], it states: “Historical losses can explain the past but they do not necessarily provide a good guide to the future. In a pessimist view, the worst disasters that could happen have not happened yet”.
A probabilistic risk assessment might simulate those future disasters, which based on scientific evidence, are likely to occur. In this assessment, the probabilistic model augments historical records by reproducing the physics of the phenomena and recreating the intensity of a large number of synthetic events. In contrast, a deterministic model treats the probability of an event as
finite and it is done in five steps:
(1) Surveillance and thorough inspections, instrumenting and monitoring, and data collection;
(2) Emergency preparedness planning, which includes documenting in details required actions in case of emergency and the preparation of responsible person names lists and telephone numbers to be contacted in such case, the definition of emergency actions and annual or semiannual drills on them. All these actions may be outlined and detailed in what is known to be an EAP (emergency action plan);
(3) Comprehensive periodic review of the dam components and marking their functioning and any deviation from previous reviews. Such reviews may be carried out every 5 or 10 years [3];
(4) Deficiency investigation in case any such deficiency is confirmed in the reviewing process, so to assess remediation options and their priority, finally;
(5) Once a deficiency is defined and a treatment option is determined then rehabilitation action will be started.
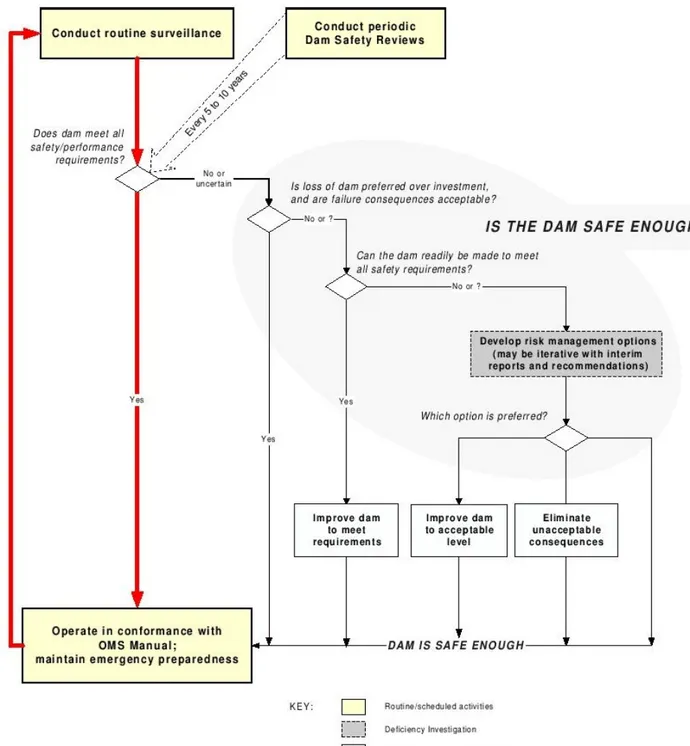
In the more oriented risk management policy, these five steps are incorporated in the framework of the whole risk management process and communicated to stakeholders; as suggested in Fig. 1.
In a follow-up to performing these actions, the decision-making stage should begin trying to make the best use of all the previous findings by incorporating them in an iterative process to reach the final optimum decision hoped for and conclude the risk management as a whole. An example of such integration was proposed by British Columbia Hydro (BS Hydro), Canada, as explained in Fig. 2.
In Fig. 2, the shaded areas represent deficiency investigation components while the diamond areas are actually (risk management points) where a decision of Yes or No should be made in order to proceed in the overall risk management.
In each risk management point, three major actions would have to be taken; these are risk analysis, risk evaluation and risk assessment.
Fig. 1 Steps in risk management decision-making [4].
3. Main Concepts in Dams Risk Management
Risks may be considered as the intentional interaction with uncertainties. In the overall framework of dam safety, it can be defined as “the measure of the likelihood of occurrence of an adverse condition and the severity of consequence of such a condition”. The risk for a particular mode of failure is the probability of occurrence of a loading scenario PL (static, seismic, hydrologic, geologic, mechanical, etc.) multiplied by
the response of some component of the structure PF (probability of failure of this component) times the consequence of such load CL (uncontrolled release of reservoir). This may be expressed by the following equation:
Risk = PL × PF × CL
Risk analysis is the calculation of dam safety and risks for certain condition(s) typically resulting in failure (uncontrolled release of the reservoir). The procedures adopted by some dam owners and authorities
Risk
Fig. 2 BC hydro’s proposal for integrated risk management processes.
can be made visible by using a ranking system for the likelihood of failure estimates and magnitude of consequences such as FMECA (failure mode and effect analysis, or can be quantitative risk analysis.
Risk assessment is the process of considering the quantitative or qualitative estimate of risk together with all related social, environmental, temporal, and other
factors in order to determine a recommended course of action to mitigate or accept the risk. Such analysis must necessarily be carried out by experts in various fields; such as geologists, geotechnical engineers, hydrologists, hydraulic and structural engineers, and mechanical and electrical engineers.
examined in terms of costs and benefits and evaluated in terms of acceptability of risk considering the needs, issues, and concerns of stakeholders. Risk management is the systematic application of management policies, procedures, and practices to the tasks of analyzing, evaluating, controlling, and communicating about risk issues. In another word, it is the total of the previous operations just outlined, and so its final goal is to enhance the decision-making process. It takes in due course the stakeholder’s perception of their needs and concerns through the communication process. A graphic representation of a typical FMECA for dam
safety procedure is shown in Fig. 3. This procedure was established by the United State Federal Emergency Management Agency (FEMA) [5] in their guidelines known as “Federal Guidelines for Dam Safety Risk Management” [5]. The framework of activities shown in Fig. 1 is, in fact, nothing more than performing the same activities indicated in the flow chart shown in Fig. 2. Fig. 3, however, shows the interrelationship of these activities. It also shows that the performance of PFMA (potential failure modes analysis) is the first step in the whole process of risk analysis leading to the decision making stage of risk management.
4. Risk Management Practices Followed by
Different Dam Owners
Recent history shows that the concept of risk began to circulate and tested since the 60s of the last century among some industries, which were attempting to quantify the risks of hazards inherent in their practices. Driving actors, among others, were the nuclear energy industry, insurance companies, and the health sector. Risk management began to show its value as a strong tool for the assessment and evaluation of such risks and could serve as a strong basis for informed decision making, especially when it came to safety decisions and optimizing of resource allocation. This development led many entities interested in dam safety to use risk analyses since late 1980s as a way for decision making in the field [5]. Dam safety management, however, may have taken different ways of development and application in different countries and even among dam owners in the same country. In all cases, the goal was always the same, i.e., better understanding, and more informed decision making. This may be explained when comparing dam safety procedures in such countries as the UK, France, Sweden, and USA.
4.1 UK
Dam safety management in the UK is governed; generally, by legislations whereby responsibility is divided between dam owners, councils or local governments, government departments and technical panels of qualified engineers appointed by the ICE (Institute of Civil Engineers). There is no current official support or use by dam owners of QRA (quantitative risk analysis) and societal risk criteria. But, a survey of dam safety management carried out by Scottish and Southern Energy [6] reveals their use of FMECA (failure mode and effects criticality analysis) since 1996 in their 84 dams out of which 56 are considered to be large dams according to ICOLD (International Commission on High Dams) criteria.
Their policies rely on emphasizing that surveillance, operations and maintenance practices should be risk based. These issues are addressed by standard procedures and governed by the Reservoir Acts of 1975 and 2011.
Concepts of acceptable risks to human life have been the subject of research conducted by the HSE (Health and Safety Executive) since the 70s. Although their research was mainly oriented towards risks in the industrial and nuclear sectors, it had contributed to the definition of tolerable risk and acceptable risk in general in other areas such as dams. In this respect, HEC reckons that the individual risk/annualized failure probability guideline is generally taken as 1 in 10,000 per year. In the water resources industry, this threshold seems to describe an agreeable guideline. Further work was done to relate these concepts to dams and their risk assessment by the CIRIA (Construction and Industry Research and Information Association). Their work and findings were issued as a report in 2000—“CIRIA 568, Risks and Reservoirs” [7].
An interim guide to quantitative risk assessment for UK reservoir was published in 2004 by the Flood and Coastal Erosion Risk Management Research Development Program [8] which is run by the Environmental Agency and provides tools for management of reservoirs safety. An updated study was published in 2013 which recommended three-tiered structural procedures for identifying potential failure modes as a preliminary step in all risk evaluation [8].
4.2 France
In France, safety concerns are addressed as early as the preconstruction stage and for each new dam with a height more than 20 m and/or the size of the reservoir is 15 × 106 m3: a technical file must be submitted to government authorities for approval and it should be subject to emergency planning regulations. The repairs of old dams are normally overseen by a technical committee called the “Standing Committee”, which is
formed of members from the Ministry of Industry, Ministry of Environment and the Ministry of Transport.
Dams under construction are also subject to compulsory continuous safety surveys by the construction supervisor, who is also responsible for the safe first filling. From that point onwards, the owners must do periodical visual inspections and monitoring at agreed frequencies and should report the findings of any anomaly or defect. All these are considered as the first line of defense. Comprehensive safety checks should be carried out yearly during the first five years from the date of commissioning followed by similar checks at five years and ten years’ intervals. The dam owner is also responsible for preparing an EAP to meet unforeseen emergencies; but inundation maps in case of dam failure are prepared by the local authority of the county in which the dam is located. In France, the term risk assessment is taken to mean the process of checking whether a dam satisfies the standards defined by the regulation otherwise. The philosophy behind this is “not accepting risk on dams”. Dam owners in France, therefore, are not engaged in using QRA but some of them are using an FMECA type analysis to manage component safety and optimize resources in maintenance programs. One example is shown by the major utility owner EDF (Electricite de France), which operates about 450 hydro plants. Some of these plants date back to the 19th century with most recent dams completed in 2009. As a result of several incidents in 2005 and 2006 [9], plants showed the need of better tools to detect the progression of aging and to schedule suitable maintenance operations. In 2005, EDF introduced a risk analysis method intended to guarantee long-term generating efficiency at its hydro facilities. The method identifies the principal failure mechanisms, their probabilities, and potential consequences. From 2006 to 2008, every structure and piece of equipment was assessed. The resulting “risk maps” provide a roadmap for the maintenance program [9].
4.3 Sweden
Sweden owns about 10,000 dams of which 190 of them are classified as large dams, the Swedish law puts on the dam owners the full responsibility of the safety of their dams. Government permission is required for dams to be constructed, and such permission is only granted after a thorough examination of the adequacy and safety of the designs. Normally, individual dam owners have their internal safety guidelines and safety organizations to adhere to safety standards and requirements, which are found in many regulatory frameworks, most of which are in the Environmental Code and the Civil Protection Act. Dam safety is part of the “water activates” supervisory area in the Environmental Code, for which the Country Administrative Board is the supervisory authority [10].
Since 1998, the public authority (Svenska Kraftnät or the Swedish National Power Grid) has been responsible for promoting dam safety in Sweden and provides supervisory guidance to the Country Administrative Board. What needs to be mentioned here is that Vattenfall AB which owns 50% of Swedish dams and is one of the Europe’s leading power companies and was the first Swedish hydropower utility to formulate a Public Safety Guidelines (2007). In 2008, Swede Energy Power Solutions AB working in its consulting capacity in dam safety sector developed “Guidelines for the Safety of the General Public at Dam Farcicalities and Associated Water Courses” for all Swedish hydropower companies operating within this association. In these guidelines, risk assessment is being considered as a methodology to prioritize the remediation of dam safety deficiencies. In this regard, Vattenfall; with the consultant (Swede Energy Power Solutions AB), has been working with quantitative (FMECA) type analysis to evaluate what methodologies would be suitable for their purposes [6].
4.4 USA
shows that many dam failures occurred during the past causing immense property and environmental damages and taking thousands of lives [11]. As dams age and population increases, the potential for deadly dam failures grows. Following the death of 125 people as a consequence of the failure of Buffalo Creek dam in West Virginia in 1972, the Congress passed the National Dam Inspection Act in 1973 which prescribed rules for the inspection of US dam and stated the need to develop risk assessment procedures. Research on risk analysis and risk assessment began, with the failure of Teton Dam in June of 1976; but it was not until October, 1979 when President Carter directed Federal Agencies to adopt dam safety standards, which should be overseen and controlled by a newly created FEMA and work closely with the Federal Dam owners and other bodies concerned with the dam safety in the United States. The FEMA in turn adopted the procedures required by the US FERC (Federal Energy Regulatory Commission) which had been established since 1973. Although initial development work in this field began shortly thereafter, it was not until the mid-1990s that the USBR (Bureau of Reclamation) began using risk analysis tools as the primary support for dam safety decision-making in its 350 dams since then [12].
The USACE (U.S. Army Corps of Engineers) recognized the need to implement risk assessment procedures following levee failures that occurred in New Orleans during Hurricane Katrina in August of 2005, and soon after began implementing risk analysis and risk assessment procedures.
In this new framework of dam safety management, the PFMA (potential failure mode analysis) is considered as the first and the most important step in the risk assessment framework (see Fig. 3) developed mainly by the United State Bureau of Reclamation [13].
In the risk evaluation, which is the next stage of safety assessment, USBR developed together with USACE codes or guidelines to quantify the risks and established the necessary criteria; as tools to such
evaluation. These tools address both the level of the threats and their likelihood of occurrence together with the magnitude of consequences. A risk matrix was formulated to establish and portray both of these factors. Fig. 4 shows the format of such matrix, in which the level of likelihood of occurrence is plotted on the vertical axis against magnitude of the consequences on the horizontal axis. In this matrix, the cells indicate the category and magnitude of each of these two variables while the alert levels rank from green (no risk) to purple (high risk).
In quantifying the failure likelihood category level, it is recognized that the likelihood failure level is a function of both the critical loading conditions leading towards failure and the chance of its occurrence. The horizontal dashed line shown on the matrix form (Fig. 4) represents the dividing line of 1:10,000 chance of occurrence which separates moderate likelihood from high likelihood zones in the matrix format. The 1:10,000 chance of occurrence is what both USBR and USACE had adopted as the reasonable criterion for acceptable loss of life.
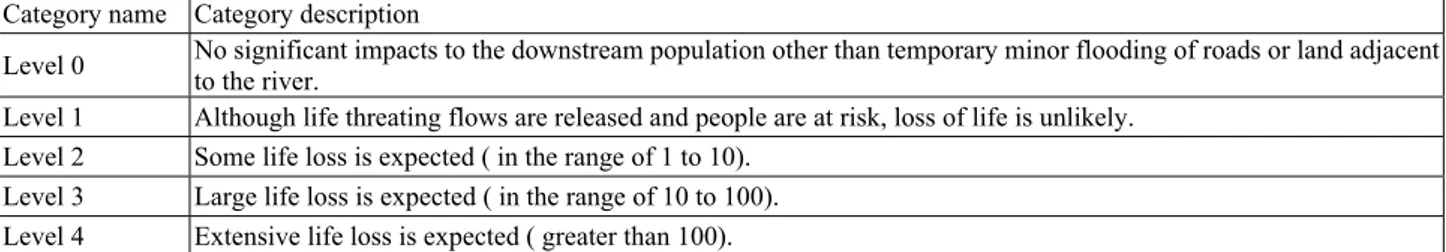
The descriptions of the failure likelihood categories are shown in Table 1, and the consequences’ categories are shown in Table 2. In the risk matrix format of Fig. 4, the first category indicated in Table 1 is eliminated following the description of this category as remote and describing its events as being “unlikely” to “very unlikely” to occur and failure potentials are negligible. Similarly, the description of the consequences categories is shown in Table 2. In this table, the magnitudes are quantified according to the significance of their impacts; if such failure occurs. Such impacts include loss of life, destruction of properties, loss of projects’ benefits, environmental damage and socio-economic impacts.
Level 0 in Table 2 is not represented in the matrix format of Fig. 4 as its consequences are not significant to downstream population and may result in minor damages to infra-structure. In describing the level of risk in any dam, its location on the format in Fig. 4 will
Fig. 4 Quantitative risk matrix format [14]. Table 1 Failure likelihood categories.
Category name Category description
Remote Several events must occur concurrently or in series to cause failure. Most, if not all the events are unlikely to very unlikely, and failure potential is negligible. Low The possibility cannot be ruled out, but there is no compelling evidence to suggest it has occurred or that a condition or flaw exists that could lead to its development (e.g., a flood or an earthquake with an annual exceedance probability
more remote than 1E-05/yr would likely cause failure). Moderate
The fundamental condition or defect is known to exist; indirect evidence suggests it is plausible; and key evidence is weighted more heavily toward unlikely than likely (e.g., a flood or an earthquake with an annual exceedance probability between 1E-05/yr and 1E-04/yr would likely cause failure).
High
The fundamental condition or defect is known to exist; indirect evidence suggests it is plausible; and key evidence is weighted more heavily toward likely than unlikely (e.g., a flood or an earthquake with an annual exceedance probability between 1E-04/yr and 1E-03/yr would likely cause failure).
Very high There is direct evidence or substantial indirect evidence to suggest it has occurred and/or is likely to occur (e.g., a flood or an earthquake with an annual exceedance probability more frequent (greater) than 1E-03/yr would likely cause failure).
Table 2 Consequences categories (numbers refer to casualties).
Category name Category description
Level 0 No significant impacts to the downstream population other than temporary minor flooding of roads or land adjacent to the river. Level 1 Although life threating flows are released and people are at risk, loss of life is unlikely.
Level 2 Some life loss is expected ( in the range of 1 to 10). Level 3 Large life loss is expected ( in the range of 10 to 100). Level 4 Extensive life loss is expected ( greater than 100). decide whether it falls in a red cell (high risk) or in a green cell (low or no risk).
The estimation of losses and damages may be derived from updated information and statistical data available at government departments or private sector enterprises. In this categorization process, loss of life is taken as the main priority, while other losses are given equal weight; the factors considered in its quantification are: the PAR (population at risk) in the inundated area, the severity of the flooding, the length of warning time given to the population concerned to evacuate and their level of understanding of the coming danger. The risk matrix in Tables 1 and 2 shows that loss of life is in the focus of the established concerns both of the USBR and USACE and it is being given prominence as it is considered in both the likelihood levels and the magnitude of consequences categorization.
Finally, the USACE summaries its use of this matrix for risk evaluation in the following statement:
“In this semi-quantitative risk evaluation, the estimated risk associated with each potential failure mode is plotted on a risk matrix format. Plotting potential failure modes in cells entirely below both the red dashed lines indicate that these potential failure modes should be kept under review and properly managed. This requires continuous monitoring and evaluation. Similarly, potential failure modes with risk plotting in cells above the red dashed lines represent risks that likely exceed risk guidelines and require action to reduce or better define risk.” In a portfolio of many dams, risk evaluation of each dam can be made in this way and an overall classification of all the dams is obtained in which they may be ranked according to the degree and severity of risks attached to them. In such
way, the prioritization scheme for the decision maker is presented in order to optimize actions and the allocation of resources.
5. PFMA (Potential Failure Mode Analysis)
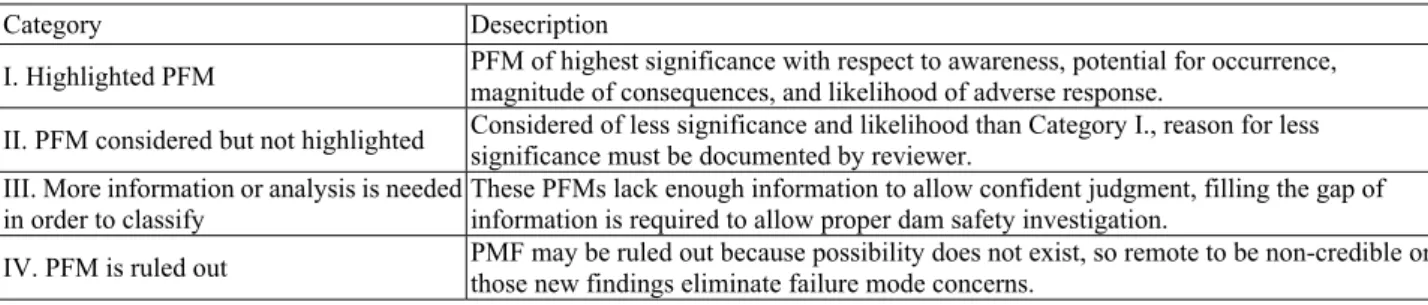
Potential failure modes analysis was adopted in 2002 by the FERC (Federal Energy Regulatory Commission) as a standard tool in reviewing a significant hazard in dams. Any PFM is defined as a specific chain of events leading to a dam failure. FERC defines such failure for dams as an uncontrolled release of water. Therefore, a failure does not need necessarily to be the complete and catastrophic failure. In any failure mode analysis, a well-defined sequence of steps has to be outlined and followed; the first is to get a thorough understanding of the dam history and its present conditions. A brainstorming should follow to visualize all possible drives that may be of any potential failure mode. These could be anything like reservoir load, deterioration of some component or overall aging, earthquake, upstream flood or an operational issue. What follows is a step by step definition of the progression of the mechanism leading to failure and then concluding with the impacts on the structure under consideration and whether it will lead to full or partial failure and the severity of the consequences of such failure. The categories of PFM according to their severity and their description are given in Table 3.
In 2005, Mosul Dam safety conditions were examined and risk management study was performed [15]. This study included identification of all potential failure modes and their categorization and found that the main concern was due to the foundation’s deteriorating conditions. The study went further to
Table 3 Categories of PFM according to FERC.
Category Desecription
I. Highlighted PFM PFM of highest significance with respect to awareness, potential for occurrence, magnitude of consequences, and likelihood of adverse response. II. PFM considered but not highlighted Considered of less significance and likelihood than Category I., reason for less significance must be documented by reviewer. III. More information or analysis is needed
in order to classify
These PFMs lack enough information to allow confident judgment, filling the gap of information is required to allow proper dam safety investigation.
IV. PFM is ruled out PMF may be ruled out because possibility does not exist, so remote to be non-credible or those new findings eliminate failure mode concerns. discuss and evaluate the dam’s safety risks and to
suggest actions for risk reduction measures. This case is presented here as a case study for such analysis.
6. Mosul Dam as Case Study
Mosul Dam which was completed in 1986 is an embankment dam with a height of 113 m that retains an accumulation of 11.1 billion m3 of water. It is located 500 km north of Baghdad on the river Tigris. The dam has been suffering from serious defects in the foundation resulting in grave safety concerns to the extent that it is been described as: “The most dangerous dam in the world [16, 17]”. The complex geology of the site and especially the severe historical karstification of the beddings are the main reasons for the problems, which started to appear during construction and continued till the present days. The impossibility to bring the deep grout curtain under the dam to the required design criteria in many locations was a warning sign of the coming troubles since many locations were left open before impounding the reservoir.
As the first filling was started in 1985, large flows of seepage water were observed coming from under the dam in the left bank and in the river channel. The water was heavily laden with salts, especially sulfates, which indicated serious dissolution of gypsum and anhydrite rocks. This was a sign a defective curtain and showed that severe dissolution process was taking place in the foundations of the dam, which eventually could lead to the dam collapse. The lithology of the foundation is characterized by heavily jointed and cavernous
limestone layers alternating with much-karstified gypsum and anhydrite beds and highly weathered marl strata. The depth of the karstification had reached a depth of 80-100 m in the river section. This was a result partly due to the continuous flow of the ground water over the geological ages and on the other hand due to the tectonic activity over the past geological time. Geological processes have also contributed to the formation of four distinct brecciated gypsum layers, which resulted from the enlargement of dissolution channels in anhydrite beds and the subsequent collapsing of the overlaying marl beds and being filled with gypsum fragments, blocks of various shapes and sizes of anhydrite and eroded limestone fragments and blocks. All these brecciated gypsum layers were weakly cemented by fine-grained clay matrix and are of such complex composition that they did not accept grouting materials, and when they did, the grouting material did not stay therein permanently and was washed away. Four of these brecciated gypsum beds were tagged as GB beds and were marked in the geological profile under the dam; these are GB0, GB1), (GB2, and GB3. The GB0 is the lowest one at about 80 m depth. The other beds followed in upward sequence. GB3 is the uppermost one and it was uncovered in the spillway chute and bucket foundations excavation and also in part of the powerhouse foundations. The reader is referred to the two references [18, 19], written by the authors for the full understanding of the complex geology of Mosul Dam. The presence of the brecciated gypsum beds led to considerable difficulties in constructing the deep grout curtain and caused repeated grouting to the same spots over and over again in what
was a maintenance grouting program, which has continued from 1987 up to now.
Quantities of injected solid grout materials reached astronomical figures. Total quantities injected in the period (1986~2004) were 93,000 tons. Additional quantities of approximately 35,000 tons were added during the period (2005~2014). But, in spite of this huge maintenance grouting works; as it has been called, grouting cannot be seen as a long-term safety improvement measure. On the contrary, studies have shown that a good part of the original rock has been replaced by friable grouting materials resulting in an overall weakening of the foundations [20]. Moreover, continuing grouting did not help in ceasing the dissolution of gypsum and anhydrite beds; but, has resulted in the progress of the dissolution front deeper into the foundations [20] and in the general dip direction of the bedding, which is NW-SE. The dissolution phenomenon was not confined to the dam foundations; but, its manifestations are evident around the site in the formation of many sinkholes downstream of the dam. Many other sinkholes along the rim of the reservoir close to its right abutment were observed, and numerous sinkholes mapped in the reservoir floor itself, in addition to many springs, dissolution caves and tunnels and ground surface cracking [21].
Mosul Dam is plagued with severe problems threatening its integrity and posing serious safety threats to the communities inhabiting the Tigris River flood plain downstream of the dam. This was made clear by the numerous studies performed so far on its potential failure and the catastrophic results of the generated flood wave. The last of these studies together with all the previous ones is discussed in Refs. [22, 23]. During 1987, concerns over the safety of Mosul Dam were building up as a result of the unsuccessful attempts to solve the grout curtain problems and the increasing dissolution in the foundations; such that governmental responsible authorities took the unusual step and drastic decision to build a protection dam
40 km downstream of Mosul Dam in a location called Badush. This dam if completed could retain the full volume of the flood wave resulting from Mosul Dam failure. The dam was designed in a great speed and construction started on the first of January, 1988 but construction was halted at the end of 1990 as a consequence of the war on Iraq in the aftermath of its occupation of Kuwait. Resumption of the work was never done due to the economic sanctions imposed on the country by the United Nations and the following war in 2003. More details are found on this dam in Ref. [23] cited before.
Mosul Dam safety conditions were thoroughly investigated in 2004~2005 by two American companies working in a joint venture and a comprehensive report was issued in August, 2005 [15]. The report investigated all deficiencies of the dam and its safety concerns and threats to downstream communities. A full safety management study was included by using risk management guidelines as stipulated by the FEMA. Definite and concrete recommendations to ensure reducing the risks and the required future actions were made. As a first step, the reviewers had to go through all designs, study reports, monitoring and instrumentation reports in addition to seepage measurement and chemical analysis results of these seepages. The foundation conditions were studied carefully and records of the maintenance grouting program over all the previous years were thoroughly examined. Equal weight was given to all the appurtenant structures and their design criteria. The objective was to possibly outline and define accurately all the potential failure modes as a first step in the risk management processes.
6.1 Categorization and Description of Failure Modes
A screening process was first performed in which all the less likely, likely, and more likely potential failure modes that could impinge on the dam safety and cause risk issues were established and categorized according to the loading condition under which they may occur.
Thirteen such failure modes were established and listed in Table 4.
This compilation did not list the internal seepage/piping and mass stability of embankment failure modes under unusual flood loading as the maximum increase in the hydrostatic head in this case at water level of 338 m.a.s.l is less than 10% of the actual head of 100 m in the usual loading case when the level is at 330 m.a.s.l. Seepage failure mode under earthquake loading was also eliminated as being considered not significantly affected by this type of loading.
6.2 Evaluation of Failure Modes
All the failure modes obtained and shown in Table 4 were studied one by one thoroughly in the next step. The sequence of events that could lead to dam failure in each of them was identified and lists of the expected adverse condition likely to result were also examined. Table 5 gives the final conclusions of this evaluation and ranking processes.
Potential failure modes (N1, N2, and N3) have the highest likelihood of occurrence and the possibility of taking place within limited or no warning time, adding
Table 4 Mosul Dam potential failure modes classification and description.
Description PFM designation
Type of loading
Shallow foundation seepage in the main valley PFM N1
Usual
(normal loading)
Intermediate foundation seepage in the main valley PFM N2
Deep foundation seepage in the main valley PFM N3
Right abutment foundation seepage PFM N4
Left abutment foundation seepage PFM N5
Internal seepage/piping through empanelment PFM N6
Static mass stability of the embankment PFM N7
Bottom outlet plunge pool erosion PFM N8
Seepage along the penstocks or bottom outlets conduits PFM N9
Embankment overtopping PFM F1
Unusual loading
(floods) PFM F2 Chute failure during spillway operation Earthquakes-induced embankment deformation PFM E1
Extreme loading
(earthquakes) PFM E2 Earthquake-induced damage to spillway headwork
Table 5 Evaluation results of failure modes for Mosul Dam.
PFM Description Category Basis for category assignment
N1 Usual loading—shallow foundation seepage in the main valley I Judged to be possible, and also judged to able to develop with limited or no warning of development. N2 Usual loading—intermediate foundation seepage in the main valley I Judged to be possible, and also judged to able to develop with limited or no warning of development. N3 Usual loading—deep foundation seepage in the main valley I Judged to be possible, and also judged to able to develop with limited or no warning of development. N4 Usual loading II Judged to be physically possible but unlikely to progress to failure.
N5 Usual loading II/IV
Judged to be physically possible but very unlikely to progress to failure, however not sufficiently unlikely to be classified as Category IV.
N6 Usual loading IV Judged to be very unlikely. N7 Usual loading IV Judged to be very unlikely. N8 Usual loading IV Judged to be very unlikely. N9 Usual loading IV Judged to be very unlikely. F1 Unusual loading IV Judged to be very unlikely.
F2 Unusual loading II Judged to be physically possible, but unlikely to progress to failure. E1 Extreme loading IV Judged to be very unlikely.
to this the fact that they could result in the full breach of the dam leading to the complete release of the reservoir with catastrophic results. These conclusions were achieved after careful and detailed study which defined the sequence of events leading to them step by step. The full analysis is too lengthy for the scope of this paper; therefore, it is summarized and condensed as shown in Table 6, which also gives required actions and risk reduction measures and more is said on this evaluation later.
6.3 Evaluation of Risk for All Failure Modes
In the assignment of the various potential failure modes to the FEMA categories, the two guiding principles in their evaluation were; their likelihood of occurrence and the magnitude of risk they presented. Risk itself was visualized as: (1) risk to loss-of-life for the downstream population; and (2) economic losses due to the loss of dam benefits in addition to damages
to downstream infrastructures, buildings, and facilities which would be substantial. This evaluation process resulted in assigning PFM (N1, N2, and N3) explained already to Category 1. Potential failure mode (PFN 4) which represents right abutment foundation failure and (PFM F2) depicting chute failure during spillway operation was judged physically possible but not likely to progress to uncontrolled release of the reservoir resulting in their assignment to Category II. The failure of Oroville Dam spillway in the United State in 2017 is seen as very similar to PFM F2 [24] Oroville Dam case.
The examination of PFM 5 which describes failure due to left abutment foundation seepage resulted in giving it a rating of II/IV. The judgment was based on the fact that this mode is physically possible which entitles it to Category II but it is believed to be significantly less likely than PFMs N4 and F2. All remaining PFM were judged as very unlikely.
Table 6 Evaluation of PMFs (N1, N2, N3).
PFM Description Required actions and risk reduction measure Category
N1
Cavity/cavern forms u/s at depth (0-10) m below foundation in GB1, GB2, GB3 and possible collapse of cavern and connecting directly to reservoir, flow velocity increase leading to increased dissolution and internal erosion, Embankment is compromised by core collapse, loss of upstream shell dam breaches. Adverse conditions are: GB1, GB2 had been repeatedly grouted, Sinkholes upstream had occurred, blanket grouting does not extend under shells and doubts on the effectiveness of consolidation grouting, dam could fail if erosion starts at dam/foundation interface. Effect of grout curtain temporary and needs repeated grouting.
Continue grouting, construct a shallow cutoff wall, construct more piezometers in downstream shell and improve piezometer monitoring, perform regular program of bathymetric surveys u/s and d/s, drill check holes for evidence of grouting. Study past sinkholes to better evaluate and understand conditions and causes, Build Badush Dam as a protection dam d/s to decrease risk to population but it does not reduce risk of Mosul Dam failure.
I
N2
A large (5 to 30) meters diameter cavern forms u/s at depth (10-60) meters below foundation in GB1 progressing to foundation/dam body interface connecting to reservoir. Increased inflow into foundation and increased dissolution and wash out of materials, embankment compromised, and collapse of section into cavity and dam breaches: adverse conditions: high grout takes were recorded in GB1, sinkholes upstream had occurred, blanket grouting does not extend to this depth and no blanket under u/s and d/s shells, effect of grout curtain temporary and needs repeated grouting.
Continue grouting, refine piezometers monitoring program, perform regular program of bathymetric surveys u/s and d/s, drill check holes for evidence of grouting, study past sinkholes to better evaluate and understand conditions and causes, build Badush Dam as a protection dam d/s to decrease risk to population but it does not reduce risk of Mosul Dam failure.
I
N3
A very large 30to 40 m diameter cavern forms u/s at depth 60-80 m below foundation in GB0, and possible collapse progresses to the foundation/dam body interface connecting to reservoir, leading to increased dissolution and internal erosion embankment
compromised by loss of critical components and collapse of a dam section and dam breaches. Adverse conditions: GBO unit has 15-20 m thickness with repeated high takes grouting, sinkholes have occurred u/s and d/s of dam, with only grouting works in the uncertain deep curtain there may not be visible warning signs of deterioration until too late, dam section may collapse leading to dam breach.
Continue grouting, refine piezometers monitoring program, perform regular program of bathymetric surveys u/s and d/s, drill check holes for evidence of grouting, study past sinkholes to better evaluate and understand conditions and causes, build Badush Dam as a protection dam d/s to decrease risk to population but it does not reduce risk of Mosul Dam failure.
In addressing the two guiding principles of risk evaluation, i.e., loss of life and economic damages, a previous study which was carried out by the Swiss Consultants Consortium (1985) [25] was utilized. The study had analyzed the hypothetical failure of Mosul Dam and the subsequent flood wave and had indicated the large extent of the flooded areas downstream the dam and the many cities and population centers impounded down to and including the Capital Baghdad. That study, however, lacked population statistics and detailed information on the structures and cultivated lands that would be destroyed and lost to the economy, Nevertheless, only by looking at the map of Iraq, it is apparent that almost 30% of the whole developed part of Iraq lies within the affected zone. A recent study completed by the Joint Research Center of the European Commission in 2016 showed that population statistics and possible human losses are staggering [26].
6.4 Evaluation of the Risk Reduction Alternatives
The final stage of this risk management study as applied to Mosul Dam case was to come up with the risk reduction measures for all failure modes. These were shown in Table 6 and may be summarized and highlighted in the following points:
(1) Construction of Badush Dam between Mosul Dam and the City of Mosul would address downstream loss-of-life risks for all PFMs;
(2) Construction of a diaphragm wall from the crest of the dam using current technology is an unproven alternative that could not, therefore, be relied upon to reduce loss-of-life risk sufficiently, considering the very large downstream affected area. In addition, this alternative would be much, much costlier than building Badush Dam;
(3) Construction of an upstream diaphragm cutoff wall and upstream impermeable face might possibly reduce loss-of-life risk sufficiently, however, it would require an extended reservoir lowering and it would be much costlier than building Badush Dam;
(4) Foundation grouting does not provide the acceptable long-term loss-of-life reduction measure, considering the very large downstream population at risk;
(5) Continued and improved foundation grouting and careful monitoring and visual inspection would be reasonable risk reduction measures to extend the economic benefits of Mosul Dam (power generation and irrigation) as long as practical.
The main conclusion one should infer is: “While grouting may be seen as an interim risk reduction measure; it does not insure the absolute safety neither to the dam itself nor to the downstream population. On the other hand, while Badush Dam guarantees such full safety to the population according to Washington Group International and Black and Veatch experts, it does not contribute to the safety of Mosul dam itself. The Badush Dam site, however, may need further geological investigation to make sure conditions similar to Mosul Dam foundation do not exist at depth.
The Mosul Dam now is in worse safety condition than in 2005. Resumption of construction of Badush Dam was not done but maintenance grouting continued over the years until the middle of August, 2014 when this activity was forced to stop for about 20 months due to the presence of ISIS around the area. The dam during this period showed real signs of excessive foundation deterioration following the progression of the potential failure modes of Category 1 predicted by this study. Signs of intensive gypsum dissolution indicating cavity formation and movement due to the settlement were clearly recorded by a study, which was performed by a United States interagency team led by the United State Army Corps of Engineers in 2015. The main conclusion of the study was that the dam was experiencing an unacceptable level of risk and safety condition, which was worse than anything that had been observed before. This conclusion was shown in a risk matrix format indicated in Fig. 5. This figure shows the probability of occurrence of breaching
Fig. 5 Mosul Dam relative risk in USACE portfolio of dams and levees.
scenario and the expected losses expressed in terms of loss of life only.
The full report of this study was not revealed for unknown reasons but parts of it were leaked [27]. As a result, from this study, grouting was continued in late 2016 on borrowed money from the World Bank. The decision maker, which in this case is the Iraqi Ministry of Water Resources, is facing the hard fact of what to do next. This situation led the ministry who appreciates now fully the gravity of the situation to organize a conference on Mosul Dam on March 22-24, 2017, to discuss the full problem. Two important resolutions came out from the conference in addition to other resolutions; the first one is to approach the international community for technical and financial support to solve the problem, and the second is to work towards allocating of funds needed to complete the studies on Badush Dam as a protection dam.
7. General Conclusion
Risk management as applied to dams is considered
as a very powerful tool in the field of safety evaluation processes and dam risk management. Compared to the traditional safety evaluation processes, it adds to the conventional technical analyses the concept of “risk” in viewing all possibilities of failure and the range of possible social and economic consequences. The importance of this new development has been emphasized by the increasing numbers of aging dams and their possible failure and the gravity of the consequences. Social values and their influence in estimating human and economic losses were catalysts in these processes, and in the decision-making policies. Risk management has become a dependable way for prioritizing actions and resources allocation.
Dam owners in different countries have applied always dam safety procedures within the technical standards and the legislative frameworks prescribed by the authorities in their countries, but the new awareness of the value of risk management is leading many of these owners to follow the new trends also. This is
driving governmental responsible authorities to introduce changes to their legislations to conform to the new trends. Risk assessment, which is at the base of risk management is the processes of tracking potential modes of failure and their progression leading to failure, and from that point, risk evaluation takes over to categorize the levels of consequences as a mean leading to decision making.
Taking the example of Mosul Dam, the risk management study indicated clearly not only the technical defects of which the dam is afflicted by, but also showed the most likely course leading to its failure, and judged the consequences of such failure prescribing at the same time possible solution to address them. In a country like Iraq, which owns a number of large dams and has the potential for constructing many future ones, the application of risk management policies is clearly needed. The fact that all these dams are located where they could pose great dangers to population and infrastructures makes this an urgent task. The limitation of recourses available to the government may drive towards a policy of scheduling necessary actions, but prioritization of these actions can only be made through a risk management approach and this process must be started now and not tomorrow.
References
[1] Federal Emergency Management Agency. 2011. Review
and Evaluation of the National Dam Safety Program-Executive Summary. Report. Accessed
December 1, 2011. https://www.fema.gov/media-library- data/20130726-1830-25045-3217/damsafetyreport.pdf. [2] UNISDR (United Nations Office for Disaster Risk
Reduction). 2013. Global Assessment Report on Disaster
Risk Reduction 2013. Accessed August 24, 2017.
http://www.preventionweb.net/english/hyogo/gar/2013/en /gar-pdf/GAR2013_EN.pdf.
[3] U.S. Bureau of Reclamation. 1985. Safety Evaluation of
Existing Dams. U.S. Government Printing Office.
Accessed August 24, 2017. https://www.usbr.gov/tsc/ techreferences/mands/mands-pdfs/SEED.pdf.
[4] Canadian Standards Association. 1997. Risk Management
Guideline for Decision Makers. CAN/CSA -Q850-97.
[5] FEMA (United State Federal Emergency Management
Agency). 2015. Federal Guidelines for Dam Safety Risk
Management. FEMA. P-2015. Accessed January 1, 2015.
https://www.fema.gov/media-library-data/142366105896 5-58dfcecc8d8d18b7e9b2a79ce1e83c96/FEMAP-1025.p df.
[6] MacGrath, S. 2000. To Study International Practice and
Use of Risk Assessment in Dam Management. Canberra:
Winston Churchill Memorial Trust of Australia. [7] Morris, M. H., and Elliott, R. 2002. Risks and Reservoirs
in the UK. HR Wallingford, RKL-Arup, CIRIA Water
Group.
[8] Flood and Coastal Erosion Risk Management Research Development Program. 2013. Guide to Risk Assessment
for Reservoirs Management. Vol. 1, Guide. Report of the
Environmental Agency, SC 090001/R1. March 2013. [9] Petitjean, A., and Denis, B. 2009. “Hydraulic Structures:
Dam Safety Progress and Challenges at Electricite de France, HydroWorld.” Accessed October 1, 2009. http://www.hydroworld.com/articles/print/volume-17/issu e-5/Articles/hydraulic-structures.html.
[10] Norstedt, U. 2013. Swedish Dams, Safety and Public
safety around Dams. Report, ICOLD European Club
Working Group. Venice.
[11] Association of State Dam Safety Officials. 2017. List of
Dam Failures Compiled by ASDOSD. http://www.dam
safety.org/news/?p=412f29c8-3fd8-4529-b5c9-8d47364c 1f3e.
[12] United States Bureau of Reclamation. 2011. Managing
Water in the West—Dam Safety. Accessed August 24,
2017. http://www.iwr.usace.army.mil/Portals/70/docs/ frmp/Flood_Risk_Char/Weghorst_-_Dam_Safety_Presen tation_to_Flood_Haz_Workshop_final_draft.pdf. [13] United States Army Corps of Engineers. 2014a. Safety of
Dams, Policy and Procedures. Appendix K. Observations on How Reclamation Uses Their Guidelines. Manual No:
ER-1110-2-1156. March 31, 2014.
[14] United States Army Corps of Engineers. 2014b. Safety of
Dams-Policy and Procedures. Appendix T. Periodic Assessment Procedures. ER 1110-2-1156. March, 2014.
[15] Washington Group International Black & Veatch. 2005.
Potential failure modes analysis of the Mosul Dam, Mosul Dam Study. Final report. Appendix J. August, 2005.
[16] AFP. 2014. Is Iraq’s Mosul Dam the Most Dangerous in
the World?. Accessed August 1, 2014. https://english.
alarabiya.net/en/perspective/features/2014/08/18/Is-Iraq-s -Mosul-dam-the-most-dangerous-in-the-world-.html. [17] Astorri, F. 2016. Mosul Battle May Cost the Most
Dangerous Dam in the World. Accessed October 1, 2016.
https://english.alarabiya.net/en/2016/10/20/Is-Mosul-host ing-one-of-most-dangerous-dams-in-the-world-.html. [18] Sissakian, V., Al-Ansari, N. A., Issa, I. E., Adamo, N., and
Dangerous Dam in the World: General Geology.” Journal
of Earth Sciences and Geotechnical Engineering 5 (3):
1-13.
[19] Al-Ansari, N. A., Adamo, N., Issa, I. E., Sissakian, V., and Knutsson, S. 2015. “Mystery of Mosul Dam: The Most Dangerous Dam in the World: Karstification and Sinkholes.” Journal of Earth Sciences and Geotechnical
Engineering 5 (3): 33-45.
[20] Kelly, J. R., Wakeley, L. D., Broadfoot, S. W., Pearson, M. L., MaGrth, C. J., McGill, M. T., Jorgeson, J. D., and Talbot, C. A. 2007. “Geologic Setting of Mosul Dam and Its Engineering Implications.” USACE-Engineer and Development Center. September, 2007.
[21] Adamo, N., and Al-Ansari, N. 2016. “Mosul Dam the Full story: Engineering Problem.” Journal of Earth Sciences
and Geotechnical Engineering 6 (3): 213-44.
[22] Adamo, N., and Al-Ansari, N. 2016. “Mosul Dam the Full Story: Safety Evaluation of Mosul Dam.” Journal of Earth
Sciences and Geotechnical Engineering 6 (3): 185-212.
[23] Adamo, N., and Al-Ansari, N. 2016. “Mosul Dam the Full Story: What If the Dam Fails?.” Journal of Earth Sciences
and Geotechnical Engineering 6 (3): 245-69.
[24] Kasler, D., Sabalow, R., and Reese, P. 2017. “Oroville Dam, Officials Find a New Damage after Water Releases, as Reservoir Level Climbs.” The Sacramento Bee. Accessed February 1, 2017. http://www.sacbee.com/ news/state/california/water-and-drought/article13157999 9.html.
[25] Swiss Consultants Consortium. 1985. Security Measures
II, Addendum 3 Flood Wave Studies. Task 2 Mosul Flood
Wave. Volumes 1, 2, 3. Baghdad, Iraq: Ministry of Irrigation.
[26] Al-Abayachi, S. 2016. Report on Mosul Dam. Iraqi House of Representatives, Agriculture, Water, and Marshes Sub-Committee. Accessed February 8, 2016. https://drive.google.com/file/d/0Byn0PFg9wZ5FNHNQU mxLb0JzenM/view. (in Arabic)
[27] Annunziato, A., Andredakis, I., and Probst, P. 2016.
Impact of Flood by a Possible Failure of the Mosul Dam.
Version 2. JRC technical reports. EU Commission. Accessed April 1, 2016. http://publications.jrc.ec.europa. eu/repository/bitstream/JRC101555/lbna27923enn.pdf.
![Fig. 1 Steps in risk management decision-making [4].](https://thumb-eu.123doks.com/thumbv2/5dokorg/4426699.106491/3.892.91.808.170.836/fig-steps-in-risk-management-decision-making.webp)
![Fig. 3 United State Federal Emergency Management Agency framework for risk management [5]](https://thumb-eu.123doks.com/thumbv2/5dokorg/4426699.106491/5.892.174.727.440.1060/united-state-federal-emergency-management-agency-framework-management.webp)
![Fig. 4 Quantitative risk matrix format [14].](https://thumb-eu.123doks.com/thumbv2/5dokorg/4426699.106491/9.892.177.718.167.730/fig-quantitative-risk-matrix-format.webp)