Technical Report TR09-06 September 2009
Ag
ricultural
Experiment Station
College of
Agricultural Sciences Soil and Crop SciencesDepartment of Extension
MAKING BETTER
DECISIONS
2009 Dry Bean Variety
http://www.csucrops.com
2
Acknowledgments
Colorado State University wishes to express its gratitude to the Colorado farmers who generously con-tributed the use of their land, equipment, and time to facilitate these trials for the benefit of all Colorado dry bean pro¬ducers and bean dealers: Yuma – Richard Wacker and Holyoke – Brent Adler. These trials would not be possible without the research support provided by The Colorado Dry Bean Administrative Committee, and publication of this report by The Colorado Bean Network. We are especially grateful to Bill Newth (Trinidad/Benham Bean Co. – Sterling, CO) for his assistance in identifying trial collabora-tors and hosting bean field days.
Trials conducted by Colorado State University Crops Testing, funded by the Colorado Dry Bean Admin-istrative Committee and reported by the Colorado Bean Network
Disclaimer
**Mention of a trademark proprietary product does not constitute endorsement by the Colorado Agricul-tural Experiment Station.
Colorado State University is an equal opportunity/affirmative action institution and complies with all Federal and Colorado State laws, regulations, and executive orders regarding affirmative action require-ments in all programs. The Office of Equal Opportunity is located in 101 Student Services. In order to assist Colorado State University in meeting its affirmative action responsibilities, ethnic minorities, women, and other protected class members are encouraged to apply and to so identify themselves.
Table of Contents
Acknowledgments...2
Table of Contents...3
Information Resources...4
2009 Colorado Dry Bean Performance Trial...5
Table 1. 2009 Pinto Bean Variety Performance Trial at Yuma...6
Table 2. 2009 Pinto Bean Variety Performance Trial at Holyoke...7
Table 3. 2-Year and 3-Year Summaries of Pinto Bean Variety
Performance in Colorado Variety Trials ...8
Summary of Pinto Bean Variety Performance in Colorado Variety Trials
from 2000-2009...9
Table 4. 10-Year Summary of Pinto Bean Variety Performance in Colorado
Variety Trials from 2000-2009. ...10
Pinto Bean Variety Descriptions:...11
COAGMET Monthly Summaries from 2007-2009 ...13
Effects of Weather on Dry Bean Irrigation Requirements...14
http://www.csucrops.com
4
Information Resources
Dr. Jerry Johnson - Associate Professor/Extension Specialist, Colorado State University, Department
of Soil and Crop Sciences, C11 Plant Science Building, Fort Collins, CO 80523-1170; telephone 970-491-1454; fax 970-491-2758; e-mail jerry.johnson@colostate.edu.
Dr. Mark A. Brick - Professor/Dry Bean Breeding Program, Colorado State University, Department of
Soil and Crop Sciences, Fort Collins, CO 80523-1170; telephone 6551; fax 970-491-0564; e-mail mark.brick@colostate.edu.
Dr. Howard F. Schwartz - Professor/Extension Specialist, Colorado State University, Department of
Bioagricultural Sciences & Pest Management, C205 Plant Science Building, Fort Collins, CO 80523-1177; telephone 970-491-6987; fax 970-491-3862; e-mail howard.schwartz@colostate. edu.
Dr. Allan Andales - Assistant Professor/Extension Specialist, Colorado State University, Department of
Soil and Crop Sciences, C03 Plant Science Building, Fort Collins, CO 80523-1170; telephone 970-491-6516; fax 970-491-0564; e-mail allan.andales@colostate.edu.
Jim Hain - Research Associate/Crops Testing Program, Colorado State University, Department of Soil
and Crop Sciences, Central Great Plains Research Station, 40335 County Road GG, Akron, CO 80720; telephone 970-554-0980; fax 970-345-2088.
Kierra Jewell - Administrative Assistant III, Colorado State University, Department of Soil and Crop
Sciences, C03 Plant Science Building, Fort Collins, CO 80523-1170; telephone 970-491-6201; fax 970-491-2758; e-mail kierra.jewell@colostate.edu.
Mark M. McMillan - Research Associate/Plant Pathology, Colorado State University, Department of
Bioagricultural Sciences & Pest Management, C205B Plant Science Building, Fort Collins, CO 80523-1177; telephone 970-491-7846; fax 970-491-3862; e-mail mark.mcmillan@colostate.edu.
J. Barry Ogg - Research Associate/Plant Breeding Program, Colorado State University, Department of
Soil and Crop Sciences, Fort Collins, CO 80523-1170; telephone 6354; fax 970-491-0564; e-mail barry.ogg@colostate.edu.
Kris Otto - Research Associate/Plant Pathology, Department of Bioagricultural Sciences & Pest
Management, E214 Plant Science Building, Fort Collins, CO 80523-1177; telephone 970-491-0256; fax 970-491-3862; e-mail kristen.otto@colostate.edu.
2009 Colorado Dry Bean Performance Trial
IntroductionColorado producers annually spend millions of dollars on pinto bean seed. Variety decisions can have a big effect on yields. Colorado State University Crops Testing, the bean breeding program, and the bean pathology research program collaborate to conduct uniform variety trials annually to provide unbiased and reliable performance results to help Colorado dry bean producers make more informed variety decisions. The uniform variety trial serves a dual purpose of screening experimental lines from CSU’s bean breeding program and to compare commercial variety performance for making variety recommendations to Colorado bean producers. The uniform variety trial is made possible by funding received from Colorado dry bean producers and handlers via the Colorado Dry Bean Administrative Committee. In 2009, two eastern Colorado trials were funded and planted at Yuma and Holyoke. Varieties tested in 2009 are described below. Seed yields, in pounds per acre, are adjusted to 14% moisture content.
http://www.csucrops.com
6
Table 1. 2009 Pinto Bean Variety Performance Trial at Yuma.
Variety Source Yield Moisture Test Wt Seeds/lb
lb/ac % lb/bu No.
Montrose Colorado State University 3818 8.2 62.1 1213
Windbreaker Seminis 3573 6.1 58.0 1300
Grand Mesa Colorado State University 3449 7.7 59.6 1320
Medicine Hat Seminis 3447 7.8 60.4 1220
Shoshone University of Idaho 3409 5.2 59.1 1360
Bill Z Colorado State University 3409 7.4 60.5 1330
6187 AmeriSeed 3345 6.7 59.6 1250
P239222 ADM Seedwest 3323 8.5 60.6 1217
99217 AmeriSeed 3296 6.7 59.2 1263
Durango AmeriSeed 3250 6.3 59.7 1250
6203 AmeriSeed 3228 9.2 60.2 1253
CO 55646 Colorado State University 3198 7.1 58.5 1157
Lariat North Dakota State University 3156 4.5 57.8 1290
P35161 ADM Seedwest 3146 6.7 59.7 1533
Croissant Colorado State University 3070 5.7 57.8 1260
Mariah Seminis 3055 6.9 60.9 1353
Stampede North Dakota State University 3047 6.2 58.2 1443
CO 29258 Colorado State University 2994 5.3 58.2 1193
CO 55119 Colorado State University 2968 7.2 56.2 1170
CO 34142 Colorado State University 2887 4.2 56.4 1300
7221 AmeriSeed 2866 7.4 55.4 1247
5200 AmeriSeed 2827 5.9 57.3 1310
CO 24972 Colorado State University 2810 6.7 58.4 1240
Kimberley University of Idaho 2721 6.6 59.2 1283
6189 AmeriSeed 2646 4.4 54.6 1350
CO 33875 Colorado State University 2560 8.7 56.5 1213
CO 55658 Colorado State University 2419 6.2 57.5 1100
CO 45308 Colorado State University 2410 6.6 57.5 1177
COB-2527-99 Gentec Inc 2331 7.4 59.5 1367
07220 AmeriSeed 2302 6.8 57.2 1273
ND-307 North Dakota State University 2299 6.2 56.2 1307
7218 AmeriSeed 2261 7.1 56.9 1373 GTS-904 Gentec Inc 2257 7.2 54.1 1300 6185 AmeriSeed 2156 7.4 57.0 1430 99195MR AmeriSeed 1989 6.4 56.3 1470 La Paz AmeriSeed 1784 6.4 55.8 1483 Average 2881 6.7 58.1 1294 LSD (0.30) 424 Site Information
Collaborator: Richard Wacker
Soil type: Platner loam
Previous crop: Corn
Planting date: 6/25/2009
Seeding rate: 85,000 seeds/ac
Irrigation: Sprinkler
Fertilization: N-P-K-S-Zn = 63-51-18-18-1 lb/ac
Herbicide: Dual, Outlook, and Select
Insecticide: Brigade for Western Bean Cutworm
Fungicide: Nu-Cop (2 times), Headline
Harvest date: 10/7/2009
Yields corrected to 14% moisture
Experimental Design: randomized complete block with 3 replications
Field plot size: 10' x 31'. Harvested plot size 25 ft2(due to late planting and wet field
Table 2. 2009 Pinto Bean Variety Performance Trial at Holyoke.
Variety Source Yield Test Weight Seeds per pound
lb/ac lb/bu number
Montrose Colorado State University 3320 61.9 1250
Shoshone University of Idaho 3265 61.6 1227
Windbreaker Seminis 3256 59.9 1243
ND-307 North Dakota State University 3171 59.0 1187
Kimberley University of Idaho 3157 62.0 1310
Stampede North Dakota State University 3153 60.1 1307
Bill Z Colorado State University 3137 60.6 1267
6185 AmeriSeed 3024 62.5 1370 Durango AmeriSeed 3022 61.9 1277 Mariah Seminis 3010 62.1 1307 GTS-904 Gentec Inc 3010 60.7 1247 P239222 ADM Seedwest 3001 61.0 1285 7220 AmeriSeed 2982 63.3 1333 6203 AmeriSeed 2978 62.6 1313 P35161 ADM Seedwest 2927 60.0 1377
CO 34142 Colorado State University 2894 61.3 1260
COB-2527-99 Gentec Inc 2868 61.8 1233
Lariat North Dakota State University 2865 61.6 1220
7221 AmeriSeed 2864 60.8 1255
CO 24972 Colorado State University 2850 60.5 1183
CO 55119 Colorado State University 2820 60.8 1223
Grand Mesa Colorado State University 2815 60.7 1317
99195MR AmeriSeed 2791 62.2 1367
CO 55646 Colorado State University 2748 61.1 1273
CO 55658 Colorado State University 2739 60.7 1093
5200 AmeriSeed 2727 61.9 1330
CO 45308 Colorado State University 2672 60.1 1143
Croissant Colorado State University 2639 60.7 1290
CO 33875 Colorado State University 2594 58.7 1273
La Paz AmeriSeed 2570 61.7 1467
6189 AmeriSeed 2519 61.8 1493
6187 AmeriSeed 2505 61.7 1265
CO 29258 Colorado State University 2400 58.9 1223
Medicine Hat Seminis 2358 60.6 1310
7218 AmeriSeed 2313 62.2 1443
Average 2856 61.1 1285
LSD 0.30 144
Plot size: 10' x 31
Site Information
Collaborator: Brent Adler
Soil Type: Balant sand
Previous Crop: Corn
Planting Date: 6/1/2009 (6" rain followed planting)
Seeding Rate: 85000 seeds/ac
Irrigation: Sprinkler
Fertilization: N-P-K-5 (90-40-15-15)
Herbicide: Sonalan, Dual, Eptam
Fungicide: Nu-Cop
Harvest Date: 9/7/2009
Note: trial recovered from a strong hail storm 7/14/09
http://www.csucrops.com
8
Table 3. 2-Y
ear
and 3-Y
ear
Summaries of Pinto Bean
Variety Performance in Colorado
Variety
Trials
2-Ye
ar
an
d
3-Ye
ar
S
um
m
ar
ie
s
of
P
in
to
B
ean
V
ar
ie
ty
Pe
rf
or
m
an
ce
in
C
ol
or
ad
o
Var
ie
ty
Tr
ial
s
2-Yr A ve ra ge 1 3-Yr A ve ra ge 1 20 08 -0 9 20 08 -0 9 20 07 -0 9 20 07 -0 9 So ur ce Va ri et y 2 Yi el d Se ed s/ lb So ur ce Va ri et y 2 Yi el d Se ed s/ lb lb /a c N o. lb /a c N o. Co lo ra do S ta te U ni ve rsi ty M on tr ose 39 97 11 79 Co lo ra do S ta te U ni ve rsi ty M on tr ose 36 70 12 33 A m er iS ee d 99 21 7* 38 89 11 51 Co lo ra do S ta te U ni ve rsi ty Bi ll Z 34 10 13 67 Co lo ra do S ta te U ni ve rsi ty Bi ll Z 38 19 12 60 A m er iS ee d 99 21 7* * 31 47 12 61 U ni ve rsi ty o f I da ho Sh osh on e 36 63 12 50 N or th D ak ot a St at e U ni ve rsi ty La ri at 31 33 12 68 A m er iS ee d D ur ra ng o 35 76 11 98 Co lo ra do S ta te U ni ve rsi ty G ra nd M esa 31 14 13 98 Co lo ra do S ta te U ni ve rsi ty G ra nd M esa 35 71 12 82 A m er iS ee d D ur an go 31 02 12 73 A D M -S ee dw est P3 51 61 35 46 13 66 A m er iS ee d 52 00 30 12 13 55 N or th D ak ot a St at e U ni ve rsi ty La ri at 34 98 11 78 N or th D ak ot a St at e U ni ve rsi ty St am pe de 30 11 14 26 N or th D ak ot a St at e U ni ve rsi ty St am pe de 34 05 12 78 G en te c In c G TS -9 04 30 03 12 52 U ni ve rsi ty o f I da ho Ki m be rl ey 33 92 12 92 A m er iS ee d 99 19 5 M R 29 68 14 65 A m er iS ee d 99 19 5M R 32 75 13 51 A m er iS ee d 61 85 28 66 14 02 Co lo ra do S ta te U ni ve rsi ty CO 3 41 42 32 61 12 15 Co lo ra do S ta te U ni ve rsi ty C O 34142 27 72 13 57 A m er iS ee d 52 00 32 45 12 72 A m er iS ee d La P az 26 66 14 37 A m er iS ee d 62 03 32 30 12 79 A ve ra ge 30 67 13 46 Co lo ra do S ta te U ni ve rsi ty Cr oi ssa nt 31 37 12 19 A m er iS ee d 61 89 31 19 13 57 A m er iS ee d 61 85 30 70 13 44 G en te c In c G TS -9 04 29 27 11 97 Co lo ra do S ta te U ni ve rsi ty CO 2 92 58 27 54 11 78 A m er iS ee d La P az 27 19 14 25 A ve ra ge 33 55 12 64 1 2 -y r an d 3-yr a ve ra ge y ie ld a nd te st w ei gh t a re b ase d on tw o 20 09 tr ia ls, on e 20 08 tr ia l, an d tw o 20 07 tr ia ls 2 V ar ie tie s ra nk ed a cc or di ng to a ve ra ge 2 -y r yi el d an d ac co rd in g to a ve ra ge 3 -y r yi el d. *D at a fr om Y um a 20 08 a nd 2 00 9 ** D at a fr om Y um a 20 08 a nd 2 00 9, Pr oc to r 20 07 , J oe s 20 07Summary of Pinto Bean Variety Performance in Colorado Variety Trials
from 2000-2009
Every year CSU personnel conduct pinto bean variety performance trials in different locations. Both varieties and locations change from year to year so this table summarizes varieties that have been tested over the years. In the table, yield performance by variety has been averaged over locations within each of ten years. Entries reported are public and commercial named varieties common to all trials for a year. Experimental lines are not included in this summary. The number of locations per year varied from two to six. The trial average at bottom of each year’s yield column is a simple average of the yields of reported varieties for that year. The second column is the yield for each reported variety expressed as a percent of the trial average for each year. Average yield over years and average percent of trial average are shown in the columns at the extreme right.
http://www.csucrops.com
10
Table 4. 10-Y
ear
Summary of Pinto Bean
Variety Performance in Colorado
Variety
Trials fr
om 2000-2009.
Ta bl e 3. 1 0-Y ea r Su m m ar y of Pi nto B ea n V ar ie ty P er fo rm an ce in C ol or ad o V ar ie ty Tr ia ls fr om 2 00 0-2 00 9. V ari et y Y ie ld lb /a c % a ve lb /a c % a ve lb /a c % a ve lb /a c % a ve lb /a c % a ve lb /a c % a ve lb /a c % a ve lb /a c % a ve lb /a c % a ve lb /a c % a ve lb /a c % a ve 99 21 7 30 80 96 24 06 92 44 82 10 4 32 96 11 1 33 16 11 1 99 19 5 M R 23 74 96 34 37 10 8 25 08 96 50 46 11 7 23 90 80 31 51 10 6 Ba ja 26 29 10 6 29 63 93 23 28 89 37 30 86 0 29 12 98 CO B-2 52 7-9 9 26 00 87 26 00 87 D ura ng o 31 70 99 23 90 92 44 57 10 3 31 36 10 5 32 88 11 1 Bi ll Z 32 12 10 4 26 21 10 0 26 13 11 0 24 63 95 22 53 10 5 24 54 99 36 89 11 5 27 96 10 7 49 10 11 4 32 73 11 0 30 28 10 2 Bu ck sk in 27 69 89 21 84 92 23 82 92 20 90 97 24 28 98 30 90 97 27 54 10 6 40 24 93 0 27 15 91 Bu st er 30 87 10 0 26 54 10 1 21 85 10 1 32 86 10 3 0 28 03 94 Cro is sa nt 28 55 96 28 55 96 G ra nd M es a 29 02 94 24 58 93 23 29 98 22 83 88 18 65 87 22 65 92 29 44 92 24 29 93 44 50 10 3 31 32 10 5 27 06 91 K im be rle y 29 39 99 29 39 99 La P az 24 90 10 1 31 64 99 25 86 99 38 04 88 21 77 73 28 44 96 M ari ah 30 33 10 2 30 33 10 2 M ed ic in e H at 29 02 98 29 02 98 M on tro se 32 13 10 4 27 05 10 3 25 86 10 9 29 56 11 4 25 62 11 9 24 49 99 34 66 10 8 25 87 99 48 54 11 2 35 69 12 0 30 95 10 4 N D -3 07 27 35 92 27 35 92 O th el lo 30 44 98 19 36 90 30 33 95 0 26 71 90 Po nc ho 33 32 10 8 28 62 10 9 23 71 10 0 28 26 10 9 23 98 11 1 26 76 10 8 30 33 95 31 79 12 2 44 32 10 2 0 30 12 10 1 Ra lly 23 12 88 21 34 90 19 35 90 0 21 27 72 U SP T-7 3 32 30 10 4 28 25 10 7 23 74 10 0 0 28 10 94 La ria t 25 28 97 44 72 10 3 30 10 10 1 33 37 11 2 G TS -9 04 31 18 11 9 35 13 81 26 34 89 30 88 10 4 Sh os ho ne 33 37 11 2 33 37 11 2 St am pe de 25 02 96 40 15 93 31 00 10 4 32 06 10 8 So no ra 24 21 93 43 56 10 1 0 33 89 11 4 W in db re ak er 34 15 11 5 34 15 11 5 Tr ia l A ve ra ge 30 99 26 34 23 70 25 82 21 53 24 71 31 96 26 09 43 25 29 74 29 74 *T he se v ari et ie s w ere e ac h on ly te st ed fo r f ew y ea rs d uri ng th e te n ye ar pe rio d an d are n ot in cl ud ed in th is p erf orm an ce su m m ary : 0 12 42 , 0 32 50 , 0 61 85 , 06 20 6, 0 32 61 , 0 52 00 , 6 I1 3, 6 I1 5, 6 I7 , 6 I9 , A pa ch e, Ca ny on , CO B-2 57 6-9 9, CO B-2 58 5-9 9, F ro nt ie r, G TS Co b 50 2-9 4, M av eri ck , RO G 2 14 , RO G 2 61 , U I 3 20 , U SP T 72 , U SP T 73 , U SP T 74 , W in ch es te r, P2 50 21 5, P 25 12 15 , P 13 14 23 , P 22 32 17 , G TS -9 05 , G TS -9 06 , 0 02 18 , 0 12 23 , Bu rk e, Ch as e, Ci sc o, E liz ab et h, K od ia k, a nd V is io n. 20 05 20 00 20 01 20 02 20 03 20 04 Y ie ld Y ie ld Y ie ld Y ie ld Y ie ld 20 06 20 07 20 08 20 09 Lo ng T erm Y ie ld Y ie ld Y ie ld Y ie ld Y ie ldPinto Bean Variety Descriptions:
99195 MR An AmeriSeed Inc. variety from ProVita, Inc. with intermediate resistance to rust and Bean common mosaic virus (BCMV). It is a late maturing variety with a 2B plant type. 99217 An AmeriSeed Inc. variety from ProVita, Inc. with intermediate resistance to rust and
BCMV. It is a late maturing variety with a 2B plant type.
Bill Z A medium maturity (95-96 days) pinto variety released by Colorado State University in 1985. It has a vine Type III growth habit with resistance to BCMV and moderate tolerance to bacterial brown spot. It is a very productive variety with good seed color. It is susceptible to white mold, common bacterial blight and strains of rust in the Hi-Plains region.
Croissant A new release from Colorado State University. It was formerly tested as CO23704 and Foundation seed was sold in 2008. It has semi-upright plant growth habit in most environments, bright pinto seed color, resistance to rust, field tolerance to common bacterial blight and resistance some strains of BCMV. Maturity is somewhat longer than Bill Z at 97-98 days.
Durango An AmeriSeed Inc. variety from ProVita, Inc. with intermediate resistance to rust and BCMV. It is a full season maturing variety with a 2B plant type.
Grand Mesa A medium maturity (94-96 day) pinto variety from Colorado State University released in
2001. Grand Mesa combines resistance to rust, BCMV, semi-upright Type II plant architecture and field tolerance to white mold, but is susceptible to common bacterial blight and bacterial brown spot. It has moderate yield potential and good seed color.
Kimberly Released in 2007 by the University of Idaho, Kimberly is a broadly adapted, and full-season pinto cultivar that has resistance or tolerance to BCMV, rust, Beet curly top virus (BCTV), and Fusarium root rot as well as tolerance to heat and drought. It has an indeter minate semi-prostrate Type III growth habit with medium to large vine. It is a full-season cultivar, 2 to 6 days longer maturity than Bill Z and 8 days longer maturity than Othello.
La Paz An AmeriSeed Inc. variety from ProVita, Inc. with intermediate resistance to rust and BCMV. It is a full season maturing variety with a 2B plant type.
Lariat A pinto line, tested as ND020069, was recently released by the North Dakota Agricultural Experiment Station in 2008. It has Type II upright, short vine, with good lodging
resistance. In Colorado, it is a full season variety at approximately 99-100 days. It is resistant to rust and BCMV.
Mariah A variety released by Seminis. It is a full season (96- 98 day) pinto bean with an erect, short vine growth habit and resistance to BCMV.
http://www.csucrops.com
12
Medicine Hat A variety released by Seminis. Medicine Hat is a medium to full season variety
(94 – 96 day) with short-vine growth habit. It is resistant to BCMV.
Montrose A medium maturity (96-97 day) pinto variety released by Colorado State
University in 1999. It has resistance to rust and BCMV. It has high yield potential and excellent seed quality. It is highly susceptible to white mold.
ND-307 Developed by North Dakota State University. It is a late season (>100 day) high yielding
variety with upright short-vine growth habit and has resistance to rust, and BCMV.
Shoshone Released in 2007 by the University of Idaho, Shoshone is a broadly adapted, and
medium maturing cultivar that has resistance or tolerance to BCMV, and rust. Shoshone is moderately tolerant to Fusarium root rot, BCTV, heat and drought. Shoshone has an indeterminate semi-prostrate growth habit Type III with small to medium length vine. Shoshone is a medium maturing cultivar, similar to Bill Z and about 4 days longer than Othello.
Stampede A pinto line, tested as ND0203 51, was recently released by the North Dakota
Agricultural Experiment Station in 2008. It has full season maturity in the Hi-Plains (96- 99 days), high yield capacity and excellent seed size, shape, and appearance. Stampede is an erect variety, with very good lodging resistance. It is resistant to rust and BCMV.
Windbreaker A variety released by Seminis. It is a full season (96 to 98 day) pinto bean with upright,
short-vine growth habit and has resistance to BCMV.
Pinto Bean Experimental lines:
5200 An AmeriSeed Inc. experimental line from ProVita, Inc.
6185 An AmeriSeed Inc. experimental line from ProVita, Inc.
6187 An AmeriSeed Inc. experimental line from ProVita, Inc.
6189 An AmeriSeed Inc. experimental line from ProVita, Inc.
6203 An AmeriSeed Inc. experimental line from ProVita, Inc.
7218 An AmeriSeed Inc. experimental line from ProVita, Inc.
7220 An AmeriSeed Inc. experimental line from ProVita, Inc.
7221 An AmeriSeed Inc. experimental line from ProVita, Inc.
CO24972 An experimental pinto line from Colorado State University.
CO29258 An experimental pinto line from Colorado State University.
CO33875 An experimental pinto line from Colorado State University.
CO34142 An experimental pinto line from Colorado State University.
CO45308 An experimental pinto line from Colorado State University.
CO55119 An experimental pinto line from Colorado State University.
CO55646 An experimental pinto line from Colorado State University.
CO55658 An experimental pinto line from Colorado State University.
GTS-904 An experimental pinto line from Gentec, Inc. COB-2527-99 An experimental pinto line from Gentec, Inc. P239222 An experimental pinto line from ADM-Seedwest P35161 n experimental pinto line from ADM-Seedwest
COAGMET
Monthly Summaries fr
om 2007-2009
C O A G M ET M on th ly S um m ar ie s fr om 2 00 7-20 09 C om pi le d by H . F . S ch w ar tz & M . S . M cM ill an , C ol or ad o S ta te U ni ve rs ity w w w .c oa gm et .c om 20 07 20 08 20 09 H ol yo ke B ur lin gt on R oc ky F or d H ol yo ke B ur lin gt on R oc ky F or d H ol yo ke B ur lin gt on R oc ky F or d M ay 85 .3 73 .5 77 .1 70 .5 73 .1 78 .1 72 .0 72 .3 78 .4 Ju ne 88 .6 83 .4 85 .5 81 .1 83 .8 88 .5 79 .3 80 .3 84 .7 Ju ly 88 .7 91 .1 91 .7 92 .2 91 .9 93 .1 84 .2 84 .6 89 .8 A ug 89 .7 88 .8 94 .0 83 .2 81 .9 86 .0 83 .3 83 .4 88 .2 S ep t 81 .7 81 .1 85 .0 76 .8 76 .3 79 .9 75 .9 73 .9 79 .2 av er ag e 86 .8 83 .6 86 .7 80 .8 81 .4 85 .1 79 .0 78 .9 84 .1 20 07 20 08 20 09 H ol yo ke B ur lin gt on R oc ky F or d H ol yo ke B ur lin gt on R oc ky F or d H ol yo ke B ur lin gt on R oc ky F or d M ay 0 0 0 0 0 0 0 0 1 Ju ne 4 3 2 0 3 7 0 1 3 Ju ly 5 8 8 10 11 14 1 1 10 A ug 6 5 16 4 4 5 0 1 4 S ep t 0 0 1 0 0 0 0 0 0 to ta l 15 16 27 14 18 26 1 3 18 20 07 20 08 20 09 H ol yo ke B ur lin gt on R oc ky F or d H ol yo ke B ur lin gt on R oc ky F or d H ol yo ke B ur lin gt on R oc ky F or d M ay 0. 2 1. 6 1. 4 2. 3 0. 9 0. 5 3. 1 3. 2 1. 1 Ju ne 0. 2 0. 9 3. 0 3. 2 1. 7 0. 4 5. 0 3. 3 1. 3 Ju ly 2. 9 3. 0 0. 3 1. 6 2. 6 0. 6 4. 4 5. 6 2. 6 A ug 1. 4 4. 4 1. 9 4. 9 8. 0 4. 4 4. 2 3. 0 0. 5 S ep t 1. 2 0. 5 0. 5 1. 4 1. 5 0. 0 1. 6 2. 8 0. 6 to ta l 5. 9 10 .4 7. 1 13 .3 14 .7 5. 9 18 .3 18 .0 6. 2 Su m m ar y: 2 00 9 ha d hi gh er d ai ly te m pe ra tu re s in s ou th er n C ol or ad o du rin g th e se as on D ay s ab ov e 95 F w er e lo w er in e as te rn C ol or ad o, a nd c ou ld h av e de la ye d m at ur ity fo r l at e-pl an te d be an s du rin g 20 09 R ai nf al l p at te rn s w er e hi gh in e as te rn C ol or ad o in 2 00 9, c on tri bu tin g to m or e ba ct er ia l d is ea se a nd c om m on ru st // C SU Ve g Pa th W eb S ite s: ht tp :// w w w .c ol os ta te .e du /O rg s/ V eg N et / ht tp :// le gu m e. ip m pi pe .o rg /c gi -b in /s br /p ub lic .c gi M on th ly R ai nf al l ( in ch es ) N um be r o f D ay s Ab ov e 95 F M on th ly D ai ly H ig h Te m pe ra tu re (F )http://www.csucrops.com
14
Effects of Weather on Dry Bean Irrigation Requirements
by Allan A. Andales
Assistant Professor and Extension Irrigation Specialist Department of Soil and Crop Sciences
The irrigation requirements of a crop are affected by weather variability. The amount and timing of precipitation (P) and evapotranspiration (ET) demand are the two main weather-related variables that determine irrigation requirements. The ET demand of a crop is a measure of how much water can be consumed via soil evaporation and plant transpiration assuming that plant-available water is adequate. The ET demand varies from day-to-day depending on crop growth stage and weather variables such as solar radiation, air temperature, humidity, and wind conditions. The daily ET demand of a crop can be estimated from daily measurements of the weather variables previously mentioned.
Assuming that all other growth factors are non-limiting – meaning conditions are such that these factors remain favorable to crop growth – a crop will attain its yield potential as long as its ET demand is satisfied throughout the growing season. Yield reductions occur when the ET demand is not satisfied, especially during critical growth stages (for example, reproductive and grain filling stages). The ET demand can be satisfied by precipitation, stored soil moisture in the root zone, and/or irrigation. Irrigation becomes necessary when natural precipitation and stored soil moisture are not adequate to satisfy all of the ET demand.
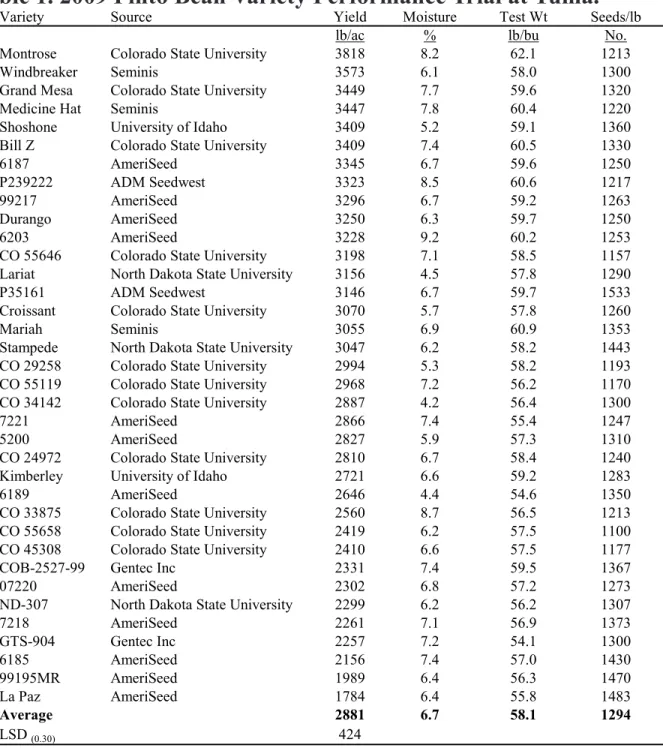
Examples of the seasonal variability of dry bean ET demand and precipitation are shown in Figures 1 and 2 for Yuma and Holyoke, respectively; both in north east Colorado. The dry bean ET demand and precipitation from June to September of each year was obtained from the Colorado
Agricultural Meteorological Network (CoAgMet) crop ET access page (http://ccc.atmos.colostate.edu/
cgi-bin/extended_etr_form.pl) for the available periods of record. Instructions for using this online tool are available on the main webpage given above. For these examples, dry bean ET demand was calculated assuming a May 31 planting date each year.
For the Yuma example (Figure 1), the average seasonal (June to September) dry bean ET demand was 25.6 inches while average precipitation for the same period was only 8.3 inches (only 32% of dry bean ET demand). This meant that the average shortfall (ET – P) was 17.3 inches, which would have had to be satisfied by stored soil moisture and/or irrigation. The quantity ET – P (that is, ET minus P) can also be used as a rough estimate of irrigation requirement. Actual stored soil moisture at planting must be subtracted from this quantity to get a better estimate of the seasonal irrigation requirement. It is also important to note that not all precipitation amounts are effectively available to the crop because of runoff and deep percolation losses from the root zone. Figures 1 and 2 show that ET demand, precipitation, and irrigation requirements can vary greatly from year-to-year. These figures show how the weather in each year (represented by ET and P) affects irrigation requirement (represented by ET – P). For example, the water shortfall at Yuma, Colorado was highest in 2003 (ET – P = 22.1 inches) and lowest in 1996 (ET – P = 6.0 inches).
Figure 1. Total dry bean evapotranspiration (ET) demand per season (June to September) at Yuma, Colorado from 1996 to 2008. Part of the ET demand can be satisfied by precipitation (P) while the remainder (ET - P) must be satisfied by stored soil moisture or irrigation.
Figure 2. Total dry bean evapotranspiration (ET) demand per season (June to September) at Holyoke, Colorado from 1992 to 2008. Data for 1996; 1999 to 2002 were missing (M). Part of the ET demand can be satisfied by precipitation (P) while the remainder (ET - P) must be satisfied by stored soil moisture or irrigation.
Probable Irrigation Requirements
It is difficult to say with certainty what a crop’s irrigation requirement will be for the coming season. This is because weather, specifically precipitation and ET demand, are difficult to predict. However, past records of P and ET can be used to estimate the probability (chance of occurrence) that certain amounts of P, ET, and corresponding shortfalls (P – ET) will occur at a location. Then, depending on the level of risk we are willing to take; we can select a level of probability (50% for example) and determine the corresponding crop ET demand that will likely occur. We can then plan ahead to ensure that we have enough water to supply the ET demand that will likely occur. Simple
http://www.csucrops.com
16
frequency analysis of P and ET can be performed to estimate the chances based on past weather records. For details on how to do simple frequency analysis, see CSU Extension fact sheet number 4.721 at
http://www.ext.colostate.edu/pubs/crops/04721.html .
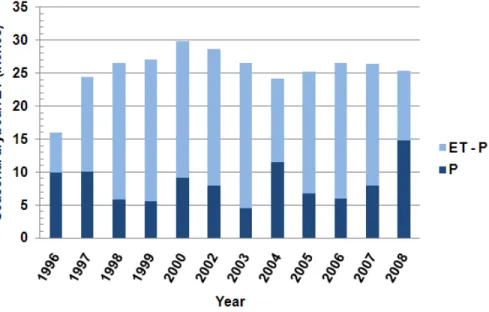
As an example, the dry bean ET, precipitation, and water shortfall (ET – P) for Yuma, Colorado (Figure 1) were each plotted versus their probabilities of exceedance. The probability of exceedance can be defined as the percentage of time that the value being considered will be exceeded.
Figure 3 shows that the relationship between dry bean ET demand and exceedance probability can be approximated by a straight line. The straight line accounts for about 67% of the variability of dry
bean ET demand depending on exceedance probability (r2 = 0.67). From the line, one can see that 50%
of the time, seasonal dry bean ET demand was equal to or greater than 25 inches of water. Seasonal dry bean ET demand was at least 22.5 inches 80% of the time while it was at least 28.5 inches 20% of the time. From the graph, one can get an estimate of how often a certain value of dry bean ET demand at Yuma was equaled or exceeded. Notice that the line greatly over-estimates probable dry bean ET at 92% exceedance probability. The observed dry bean ET of 16 inches at 92% exceedance probability was a rare occurrence and did not follow the general trend. This shows one of the limitations of using a fitted line to describe actual observations, especially when the number of observations is limited.
Figure 3. Probabilities (chances) of exceeding different values of seasonal dry bean ET (June to September) at Yuma, Colorado for the period 1996-2008.
As an example, if we want to be 80% sure that our water supply (stored soil moisture + irrigation water) will be enough to satisfy dry bean ET demand, then we should determine the seasonal dry bean ET that is exceeded only 20% of the time (Probability of exceedance = 100 – 80 = 20%). Dry bean ET with 20% exceedance probability means that it will not be exceeded 80% of the time. From Figure 3 at 20% probability of exceedance, the expected seasonal dry bean ET is 28.5 inches. Therefore, we should make plans to have a total of 28.5 inches of water available for the season (stored soil moisture and/or irrigation water). In this example, we are taking a 20% chance (risk) that our water supply will not be enough to satisfy dry bean ET demand. Producers who are willing to take more risks can select a higher probability of exceedance.
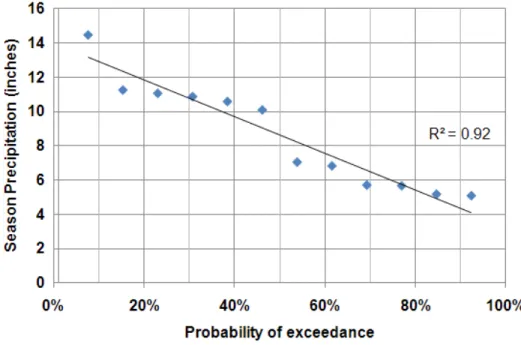
Likewise, seasonal precipitation (June to September) was plotted against probability (Figure 4). In this case, precipitation versus probability was not linear, so the horizontal axis was converted to a logarithmic scale (base 10 logarithmic scale in Microsoft Excel ®). This means that the probability changes rapidly as seasonal precipitation varies. In hydrology, a logarithmic scale is often used to make the probability graph appear linear. Sometimes, we are interested in unknown values between two adjacent observations. Interpolation is the process of estimating unknown values between actual
observations based on observed trends. Converting data to their logarithmic values makes interpolation easier, since a straight trend line is much simpler than a curved trend line. From Figure 4, it can be estimated that seasonal (June to September) precipitation at Yuma was at least 7.5 inches 50% of the time. The line shows that seasonal precipitation was at least 5.5 inches 80% of the time while it was at least 11 inches 20% of the time.
Figure 4. Probabilities (chances) of exceeding different values of seasonal precipitation (June to September) at Yuma, Colorado for the period 1996-2008.
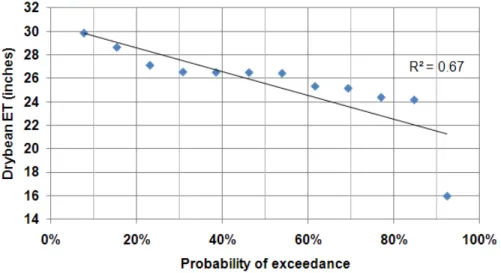
As mentioned earlier, the water shortfall represented by (ET – P) can be a rough estimate of irrigation requirements. The probability graph of this requirement for dry bean at Yuma is
approximately linear (Figure 5). Half of the time (50% probability), the water shortfall was at least 17.5 inches. The water shortfall was at least 12.5 inches, 80% of the time, while it was at least 22.5 inches 20% of the time.
Figure 5. Probabilities (chances) of exceeding different values of seasonal (June to September) water shortfalls for dry beans at Yuma, Colorado for the period 1996-2008.
http://www.csucrops.com
18
A set of probability graphs for Holyoke, Colorado is also given below (Figures 6, 7, 8). They can be used in the same way described above, to estimate probable ET, P, or ET – P amounts at selected probabilities of exceedance.
Figure 6. Probabilities (chances) of exceeding different values of seasonal dry bean ET (June to September) at Holyoke, Colorado for the period 1992-2008. The years 1996, 1999, 2000, 2001, and 2002 were missing from the record.
Figure 7. Probabilities (chances) of exceeding different values of seasonal precipitation (June to September) at Holyoke, Colorado for the period 1992-2008. The years 1996, 1999, 2000, 2001, and 2002 were missing from the record.
Figure 8. Probabilities (chances) of exceeding different values of seasonal (June to September) water shortfalls for dry beans at Holyoke, Colorado for the period 1992-2008. The years 1996, 1999, 2000, 2001, and 2002 were missing from the record. From Figure 8 for Holyoke, half of the time (50% probability) the water shortfall for dry beans was at least 17.0 inches. The water shortfall was at least 15 inches, 80% of the time, while it was at least 21 inches 20% of the time.
Caution Needed in Interpreting Probabilities
Probability graphs, like the ones given above, are only as reliable as the individual data points used to make them. At times, there may be outliers – data points that are extremely high or low because of errors in data collection (a malfunctioning rain gauge, for example). Outliers may need to be
excluded from the data series to get a more reliable probability plot. Also, having more data points in time gives more credibility to the probability graph. In the above examples, the years 1996, 1999, 2000, 2001, and 2002 were excluded from the Holyoke analyses because too many days of data were missing due to malfunctioning weather sensors. As more years are added to the historical record of ET and P at Yuma and Holyoke (and all other CoAgMet stations), these can be included in updated versions of the probability graphs.
There is a danger in estimating probabilities outside of the available data range (extrapolation). For example, estimating the probability of 20 inches of seasonal precipitation from Figure 4 would not be a good idea. Probability plots are most reliable in the middle of the data range, where more data have been recorded or observed. That is why longer periods of record are better, because more extreme (very high or very low) values would have been recorded.
Statisticians use statistical tests of the data to improve the reliability of probability plots and to fit appropriate lines through the data points. Only a simplistic approach is given here to illustrate how weather variability can affect irrigation water requirements.
http://www.csucrops.com
20
2009 Common Bean Disease Scouting Summary
[Excerpts from the Legume ipmPIPE Report @ http://legume.ipmpipe.org/cgi-bin/sbr/public.cgi]
Rusts (soybean, common)
Common rust was noted in various fields of susceptible varieties in eastern Colorado during August to mid September. Some later fields sustained moderate infection before harvest.
Other Fungal Diseases (root rots, white mold)
Root rots were widespread during June and July, resulting in poor stands, reduced root vigor, and early maturity in some fields during August; as a result of the cool, wet spring conditions in many production areas. White mold has occurred in some fields with a history of the disease and in varieties with more dense plant canopies.
Bacterial Diseases (common blight, halo blight, brown spot, wilt)
The bacterial disease complex (primarily bacterial brown spot and common bacterial blight) was widespread in eastern Colorado as a result of the cool to moderate conditions with frequent storm activity.
Virus Diseases (AMV, BCTV, BCMV, BYMV, CMV, other)
Viruses like Bean common mosaic virus were widespread in susceptible varieties like yellow beans in eastern and southern Colorado.
Legume Specialist Howard Schwartz
Professor of Plant Pathology Colorado State University