Faculty of Computing, Blekinge Institute of Technology, 371 79 Karlskrona, Sweden
Master of Science in Mechanical Engineering
June 2019
Digital models of manufacturing
with emphasis on titanium welding for early product development
Yousef Al Choueyri
Mojtaba Fayazi
iii This thesis is submitted to the Faculty of Mechanical Engineering at Blekinge Institute of Technology in partial fulfilment of the requirements for the degree of Master of Science in Mechanical
Engineering. The thesis is equivalent to 20 weeks of full-time studies.
The authors declare that they are the sole authors of this thesis and that they have not used any sources other than those listed in the bibliography and identified as references. They further declare that they have not submitted this thesis at any other institution to obtain a degree.
Contact Information: Author(s): Yousef Al Choueyri E-mail: yoal13@student.bth.se Mojtaba Fayazi E-mail: mofb14@student.bth.se University advisor: Alessandro Bertoni Mechanical Engineering
Faculty of Mechanical Engineering Blekinge Institute of Technology SE-371 79 Karlskrona, Sweden
Internet : www.bth.se Phone : +46 455 38 50 00 Fax : +46 455 38 50 57
v
A
BSTRACT
This thesis work is part of the BTH research lab, focusing on developing early product development, by analyzing how to integrate the manufacturing process with the early design process. A known problem in the manufacturing industry is the knowledge gap between the designers and the
manufacturing process. Where in the early stages of the product development a knowledge regarding the manufacturing process is needed. This is in many cases ignored by the designers because it is commonly thought that the responsibility of selecting the manufacturing processes for a product falls upon the manufacturers, despite the fact that the manufacturing processes, in reality, is highly dependent upon the design choices such as materials, size, shape, finishing and tolerances of the product. To mitigate this problem, a variation of product ‘team’ approaches have been used where the idea is to involve a multitude of people with the necessary experience to produce a ‘production-friendly product’. Those approaches have a few drawbacks mainly the problem of finding people with the relevant experiences or that the expertise only covers the manufacturing processes already used in the organization, losing the opportunity to benefit from any alternative manufacturing process. This thesis focuses on how the welding manufacturing technique, analysis can be integrated into the design process with the help of a digital model.
To improve the communications between the manufacturers and designers, two excel files were developed. The first excel file aimed at the manufacturers where they can present the specific machines used in the workshop. Focusing on specific machine and workshops instead of on the general welding method will give the designers a better understanding of the feasibility of producing their design in a specific workshop instead of focusing on a specific manufacturing method.
The second excel file is aimed at calculating and comparing the weld methods where the cost and requirements are derived for general welding methods and compared with the machine specifications gathered from the manufacturers using the first excel file. To assess the excel files, a parametrized CAD model of the rear engine turbine structure was developed, and three different cases were used to evaluate the developed excel files.
The values used are presented in Appendix A: Table 11–15, and were gathered from public sources. Values were also approximated using regression analysis.
vi
S
AMMANFATTNING
Avhandlingen är en del av BTH research lab och fokuserar på det tidiga
produktutvecklingsstadiet. Närmare kontrolleras hur produkttillverkningsprocessen kan
integreras in i det tidiga produktutvecklingsstadiet. Ett känt problem för detta område är
skillnaden på kunskapen som designer och tillverkaren besitter under det tidiga
produktutvecklingsstadiet, då kunskapen om tillverkningsprocessen inte existerar. Vanligtvis
tar inte produktutvecklare hänsyn till detta, eftersom ansvaret för valet av
tillverkningsprocessen bedöms falla på tillverkaren. Trots att tillverkningsprocessen beror på
många aspekter som bestäms under designprocessen som till exempel materialval, geometrin,
efterbehandlingar och toleranser på produkten. För att minimera problemet involverar
industrin en stor variation av människor med kompetens och erfarenhet, som sedan kan
tillverka en produkt rätt anpassad för tillverkningsprocessen. Dock har denna lösning några
nackdelar, då det kan vara svårt att hitta människor med rätt erfarenhet, men då man fokuserar
på ett tillverkningssätt så kan företaget gå miste om fördelarna med alternativa
tillverkningsprocesser.
Denna avhandling fokuserar på hur analysen av svetstillverkningstekniken kan integreras in i
designprocessen med hjälp av en digital modell.
För att förbättra kommunikationen mellan tillverkare och designer har 2 Excel filer utvecklats.
Den första Excel filen är riktat mot tillverkarna där dem kan nämna maskinerna som finns
tillgängliga i deras verkstad. Den andra Excel filen är till för att kunna göra en kostnadskalkyl
och jämföra dem olika tillverkningsmetoderna med hjälp av maskinspecifikationerna som
fanns presenterade i den första Excel filen.
För att utvärdera Excel filerna, har en parametrisk CAD modell skapats och 3 fall har använts
för att testa de utvecklade CAD modellera. Värdena som använts i detta examensarbete finns i
Appendix A: Table 11–15
och är hämtade från allmänt tillgängliga källor. Värden uppskattades
också med hjälp av regressionsanalyser.
viii
Contents
Abstract ... v
Sammanfattning ... vi
1 Introduction ... 1
1.1 Aim, objectives and research question ... 2
1.2 Limitations... 2
2 Theoretical background ... 3
2.1 Resistance spot welding (RSW) ... 3
2.2 Electron Beam Welding (EBW) ... 4
2.3 Tungsten Inert Gas (TIG) Welding ... 5
2.4 Laser Beam Welding (LBW)... 7
2.5 Background and theory of welding calculations ... 9
2.6 Cost variable terminology ... 10
2.7 Equation used for cost calculation ... 11
3 Methodology ... 12
3.1 Literature study & Comprehension of the thesis ... 12
3.2 Quality, Validity and Generalization ... 12
3.3 Ideation ... 13
3.3.1 Brainwriting ... 13
3.3.2 Prototyping ... 14
3.3.3 CAD model ... 14
3.4 Cost and feasibility comparison method... 14
4 Results ... 15
4.1 Idea generation ... 15
4.2 Prototyping and testing ... 15
4.2.1 First-generation of the CAD model ... 15
4.2.2 Latest generation of the CAD model ... 17
4.3 Excel program for manufacturers ... 19
4.4 Example of welding cost calculation by hand ... 31
4.4.1 TIG calculation ... 31
4.4.2 LBW calculation ... 33
4.4.3 EBW calculation ... 35
4.4.4 RSW calculation ... 37
4.5 Excel program for calculation ... 39
4.6 Welding cost and time calculations for rear engine turbine structure test model ... 46
ix
4.6.2 Test two ... 50
4.6.3 Test three ... 52
5 Conclusions and discussions ... 54
5.1 Discussion of the excel files ... 54
5.2 Discussion of parametrized CAD model ... 55
5.3 Conclusion and discussion of the welding calculations done by hand... 56
6 Future work ... 57
References ... 58
APPENDICIES ... 59
Appendix A: Table 11–15 ... 60
Appendix B: Test one ... 62
Appendix C: Test two ... 71
Appendix D: Test three... 80
x
Abbreviations
Term Description Units
TIG Tungsten inert gas
RSW Resistance spot welding
LSW Laser beam welding
EBW Electrode beam welding
Ww Welding Wight Kg
Awc Cross-sectional area of the weld mm2
L Welding length mm
Ρ Density kg/mm3
Wf Welding factor Kg/h
C Travel speed mm/h
OC Operation cost SEK/h
AT Arc time %
LC Labor cost SEK
EC Filler electrode cost SEK/kg
ECtot Total electrode price SEK
Uf Utilization factor
GF Gas flow L/h
GP Gas price SEK/L
Gasc Gas cost SEK
EqCh Equipment cost per hour SEK/h
EqC Equipment cost SEK
El Electricity SEK
PCon Power consumption kWh
EP Energy price SEK/kWh
T Material thickness mm
CAD Computer-aided design
DCEN Direct Current Electrode Negative
DCEP Direct Current Electrode Positive
AC Alternate current
xi
List of tables
Table 1. Represents the desired service requirements.
Table 2. Shows values used, sources for the values and the results for TIG calculation of a 3.2 mm thick 0.5 m long titanium sheets.
Table 3. Shows values used, sources for the values and the results for LBW calculation of a 3.2 mm thick 0.5 m long titanium sheets.
Table 4. Shows values used, sources for the values and the results for EBW calculation of a 3.2 mm thick 0.5 m long titanium sheets.
Table 5. Shows values used, sources for the values and the results for RSW calculation of a 3.2 mm thick 0.5 m long titanium sheets.
Table 6. Shows the total welding cost calculation for test one. Table 7. Shows the total ARC time in hours for test one. Table 8. Shows the total welding cost calculation for test two. Table 9. Shows the total ARC time in hours for test two.
Table 10. Shows the total welding cost calculation for test three. Table 11. Shows the total ARC time in hours for test three.
Table 12 Ti-6Al-4V: Typical parameters and conditions for tungsten-arc welding. Table 13 Ti-6Al-4V: Typical parameters and conditions for laser beam welding. Table 14 Ti-6Al-4V: Typical parameters and conditions for electron beam welding. Table 15 Ti-6Al-4V: Typical parameters and conditions for resistance spot welding. Table 16. Dimensions of typical joints for welding titanium and titanium alloys. Table 17. Parameters used in test one.
Table 18. Parameters used in test two. Table 19. Parameters used in test three. Table 20. Description of CAD parameters.
xii
List of figures
Figure 1. The picture shows the different stages of the resistance spot welding method. Figure 2. The figure shows how an electron beam gun works.
Figure 3. The figure shows a schematic of the tungsten inert gas welding process.
Figure 4. The figure shows: a) Direct Current Electrode Negative (DCEN) weld, b) Direct Current Electrode Positive (DCEP) Weld, c) Alternate Current (AC) weld and some of their properties on the workpiece.
Figure 5. The figure shows a simple schematic of the different parts for a robotic-driven laser beam welder. The tube between the flash lamps can either be a crystal making it a solid-state laser or a gas making it a gas-based laser.
Figure 6. Shows a comparison of a butt weld made using three welding technologies. Figure 7. Shows methodology used in the thesis work.
Figure 8. Shows an artistic representation of the idea generation process used. Figure 9. Shows the first generation of the CAD model.
Figure 10. Shows the first generation of the CAD model and its parametric table. Figure 11. Shows the latest generation of the CAD model.
Figure 12. Shows the latest generation of the CAD model and its parametric table. Figure 13. Cover page for the Digital models of manufacturing process Excel file. Figure 14. Manufacturing page.
Figure 15. Welding page.
Figure 16. Template of RSW welding machine with example values. Figure 17. Template of EBW machine with example values.
Figure 18. Template of TIG machine with example values. Figure 19. Template of LBW machine with example values. Figure 20. Window for editing specifications.
Figure 21. Comparing the RSW template chart with an example modification of it.
Figure 22. Shows two lists with the possible items to remove, list 1 shows user-added specifications and list two shows the DOF.
Figure 23. Shows the evolution of compare page.
Figure 24. Alternatives for the subsections in the compare sheet. Figure 25. (b) shows (a) after deleting RSW (1) and TIG (1) from (a). Figure 26. Showing the root opening
Figure 27. Showing the weld length
Figure 28. Shows the relationship between thickness and angle for TIG on a 3.2mm thick titanium sheet.
Figure 29. Shows a picture of laser beam welding.
Figure 30. Shows the relationship between thickness and angle for LBW on a 3.2mm thick titanium sheet.
Figure 31. Shows a picture of electron beam welding.
Figure 32. Shows the relationship between thickness and angle for EBW on a 3.2mm thick titanium sheet.
Figure 33. Shows a picture of resistance spot welding. Figure 34. Shows the weld bead width.
Figure 35. Shows the relationship between thickness and angle for RSW on a 3.2 mm thick titanium sheet.
Figure 36. Cover page for the excel calculations program. Figure 37. Manufacturing page.
Figure 38. Welding page.
Figure 39. TIG calculations page.
Figure 40. Shows welding calculations page. Figure 41. Shows machine page.
Figure 42. Shows the compare page.
Figure 43. Shows a rear-engine turbine structure used in test one, marked with welding spots. Figure 44. Shows a rear-engine turbine structure used in test two.
xiii Figure 45. Shows a rear-engine turbine structure used in test three.
Figure 46. Shows the welding cost calculations for the blade in test one. Figure 47. Machines capable of welding the blade in test one.
Figure 48. Shows the welding cost calculations for the inner cylinder in test one. Figure 49. Machines capable of welding the inner cylinder in test one.
Figure 50. Shows the welding cost calculations for the outer cylinder in test one. Figure 51. Machines capable of welding the outer cylinder in test one.
Figure 52. Shows the welding cost calculations for the rim in test one. Figure 53. Machines capable of welding the rim in test one.
Figure 54. Shows the welding cost calculations for the blade in test two. Figure 55. Machines capable of welding the blade in test two.
Figure 56. Shows the welding cost calculations for the inner cylinder in test two. Figure 57. Machines capable of welding the inner cylinder in test two.
Figure 58. Shows the welding cost calculations for the outer cylinder in test two. Figure 59. Machines capable of welding the outer cylinder in test two.
Figure 60. Shows the welding cost calculations for the rim in test two. Figure 61. Machines capable of welding the rim in test two.
Figure 62. Shows the welding cost calculations for the blade in test three. Figure 63. Machines capable of welding the blade in test three.
Figure 64. Shows the welding cost calculations for the inner cylinder in test three. Figure 65. Machines capable of welding the inner cylinder in test three.
Figure 66. Shows the welding cost calculations for the outer cylinder in test three. Figure 67. Machines capable of welding the outer cylinder in test three.
Figure 68. Shows the welding cost calculations for the rim in test three. Figure 69. Machines capable of welding the rim in test three.
1
1
Introduction
This thesis work is part of the BTH research lab, focusing on developing early product development, by analyzing how to integrate the manufacturing process with the early design process.
It is widely thought that the responsibility of selecting the manufacturing processes for a product falls upon the manufacturers, but in reality, the manufacturing process can also be highly dependent upon the design chooses, such as materials, size, shape, finishing and tolerances of the product. This gives the designers the responsibility to select the most competitive design in terms of quality and cost, which include a ‘production-friendly design’, while still keeping the functional requirements of the design [1, p. 1].
A known problem in the manufacturing industry is the knowledge gap between the designers and the manufacturing process. Where in the early stages of the product development a knowledge regarding the manufacturing process is needed. Despite the fact that this problem has been known for many years, there is relatively little work published in this area and the available texts on design rarely include relevant data. The available data tends to be inconsistent where some processes are described in great details and others may be neglected, which can give a misleading impression on the processes and their availability. This also contributes to the problem of how the manufacturing data is applied to the manufacturing process selection. Manufacturing data can be found in manufacturing catalogues, but this information tends to be sales-oriented and presented in different formats with varying levels of detail, rarely providing information on process capability and design considerations [2, pp. 4-5]. A solution that companies have used to mitigate this problem is to use a variation of a product ‘team’ approaches, where the idea is to involve a multitude of people with the necessary experience to produce a ‘production-friendly product’. There are a number of difficulties with this approach. The problems include the difficulties in gathering people with relevant expertise. Especially considering the possibility that the designers and manufacturers can be, not only located in different departments but also on different sites and even in different countries and in the case of subcontractors the
necessary personnel are even located in different companies. In addition to this, there is a high chance that the expertise in the team only covers the manufacturing processes already used in the company, losing the opportunity to benefit from any alternative manufacturing process [2, p. 5].
The classical product development consists of sequential phases, where each phase produces the input for the next one and the information exchange is carried out at the end of each phase. The possible errors discovered using this method are only at the end of each phase, which leads to time and cost-intensive loops between two phases [1, p. 2].
The phases in the design process start with the design specifications given by either a customer or the product planning team. The specifications are used to produce requirement lists in order to design a new product or develop an existing product. The primary function of the product can be defined from the requirement lists and secondary functions can be identified. The primary and secondary functions are further broken down into sub-functions and working principles are defined based on physical effects, material characteristics and geometric specifications [3] [4].
To speed up this process a parallelization of the phases is suggested by Andreasen and Hein, Ehrlenspiel and Ponn and Lindemann which allows early information exchange between the phases, this leads to a reduction in the number of iterations between the different phases [1, p. 2].
Companies who do not consider the conformability and cost of the product, until the product is at the end of the line, risks not being competitive. The need for companies to consider the consequences of design decisions has never been greater since almost a third of the effort spent on product development can be wasted on reworking the development of the product [1, p. 1]
2
1.1 Aim, objectives and research question
The goal of this thesis is to develop a digital model of the welding process which can be used during the development and design process to compare different welding machines. A program aimed at the manufacturer will also be developed which will be used to gather machine-specific data that can be used in the digital model of the welding process. To test the digital model of the welding process a product will be developed in CAD.
To tackle this problem, we have divided the thesis work into a few sub-goals: Studying different welding techniques and cost calculations.
Finding a way to integrate the digital model into the design process Test the found solution using a CAD model
The research questions that this thesis focused on, is how can the welding manufacturing technique analysis be integrated into the early design process with the help of a digital model?
1.2 Limitations
The problem with integrating the manufacturing technique analysis into the design prosses is too broad to tackle in this thesis so some limitations have been made. The demonstration of the method is limited to four different welding methods (RSW, EBW, TIG and LBW) and one material (TI-6Al-4V)
identified from the need of a partner company. The test of the digital model was limited to three variations of one product (turbine rear jet engine). The values used for the manufacturing cost analysis are limited to publicly available data and simple regression analysis of this data to interpolate the values in-between.
3
2
Theoretical background
This section explains the background and theory that describes the welding methods which are used in this thesis. This section also explains the background and theory for the manufacturing cost
calculation.
2.1 Resistance spot welding (RSW)
RSW is a welding technique that can be fully automated and is widely used in many industries, such as the automotive industry, where a modern vehicle contains 2000 to 5000 spot welds [5]
.
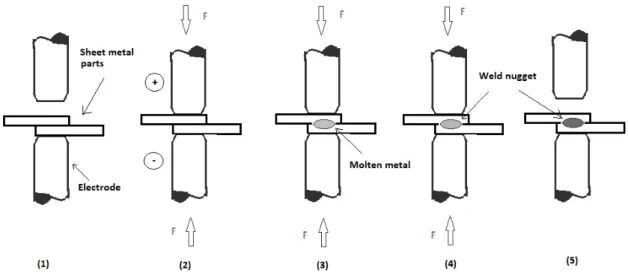
RSW is a type of resistance welding used to weld overlapping pieces of sheet metal by pressing them together and applying a current through the material until it melts, which merges the two pieces together seeFigure 1. Making this RSW different from other welding techniques like arc welding, since RSW
does not require the use of filler materials or flux added to the welding zone during the welding process [6].
Figure 1. The picture shows the different stages of the resistance spot welding method.
RSW is usually used on thin sheets of metals with a starting from a sheet thickness of 0.3 mm to a sheet thickness of 6 mm but thicker sheets of metal can be spot welded. Sheets of metal up to a thickness of 20 mm have been spot welded. It is even possible to spot weld sheet of metal with unequal thicknesses, up to a thickness ratio of 3:1 [1, p. 316]. The ideal material used for RSW is a material which has a low heat conductivity and high electrical resistance in comparison to the electrodes used, like carbon steel sheets welded together using copper electrodes. The quality of the weld using resistance RSW is determined by among other things pressure on the worksheet, contact area of the electrode, currently used during welding and the time it takes to weld.
4
2.2 Electron Beam Welding (EBW)
EBW is a welding method which fuses elements together, using electrons as an energy source. EBW works by detaching electrons from the outer shell of the atom and creating a beam. The electrons are negatively charged, which makes it possible to accelerate the electrons using an electric filed. EBW is usually carried out in a vacuum chamber to prevent the electrons from colliding with heavy gas particles in the atmosphere, which could cause a beam to defocus and the electrons in the beam to scatter and lose their kinetic energy [7].
EBW is a highly efficient welding process, which is sought after in a constantly growing industry, looking for a new technological solution, in hope of reducing production costs, improving production quality and increase production versatility. EBW is a highly sought after welding method because of the range of thicknesses possible to weld using EBW, ranging from 0.025 mm to 300 mm and the possibility to weld three-dimensional components using programmed welding parameters as well as workpiece manipulation [8].
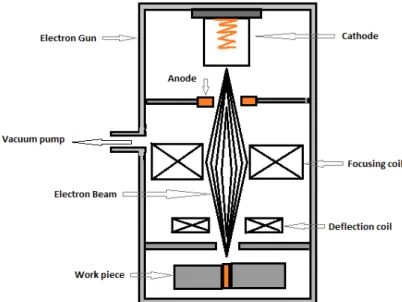
Figure 2. The figure shows how an electron beam gun works.
Figure 2 shows a simplified representation of an electron beam gun which works by using the cathode
to generate the electrons which get attracted to the anode where they are released through an opening after getting accelerated and focused into a beam. To focus the beam to a small point on the working area, a magnetic focusing lens is used. The deflection coil is used to get different weld shapes as well as improve weld quality or increase penetration depth [9].
EBW outputs a high-power density of approximately 5 ∗ 108𝑊 𝑐𝑚⁄ 2 , in a very small area of
approximately 10−7𝑐𝑚2. Depending on their speed, electrons can penetrate a materials external layer
at a depth of about 10−2𝑚𝑚. Even though the penetration depth of electrons is small, the fusion zone
of the EBW is much deeper. One explanation for this is that when the electrons penetrate the first layer of the workpiece, energy of the beam goes towards heating the material and vaporizing the work area creating a cavitation, exposing the next layer which makes it possible for the electrons to penetrate the next layer and repeating the cycle to create a thin deep weld [7].
5
2.3 Tungsten Inert Gas (TIG) Welding
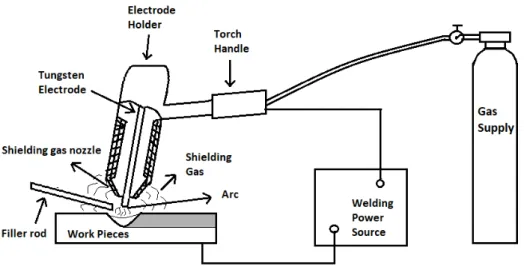
TIG welding is a welding method used to join most nonferrous such as aluminium, nickel, copper, titanium and stainless steel. Metals like carbon steel, low alloy steels, precious metals and refractory alloys can also be welded using TIG. Two different metals are hard to weld using TIG [2, p. 291]. TIG welding is a metal joining process that uses a tungsten non-consumable electrode to establish an arc between the tungsten electrode and the metal. The arc is then used to heat the workpiece metals until they melt and join together. To protect the tungsten electrode, filler rod and workpiece from the atmosphere, inert gas like argon or helium is led through the torch body to the weld pool by a nozzle. TIG welding sometimes also require a filler rod, for instance when welding thicker materials. This rod can be feed into the arc either manually or automatically. Which can be seen in Figure 3.
Figure 3. The figure shows a schematic of the tungsten inert gas welding process.
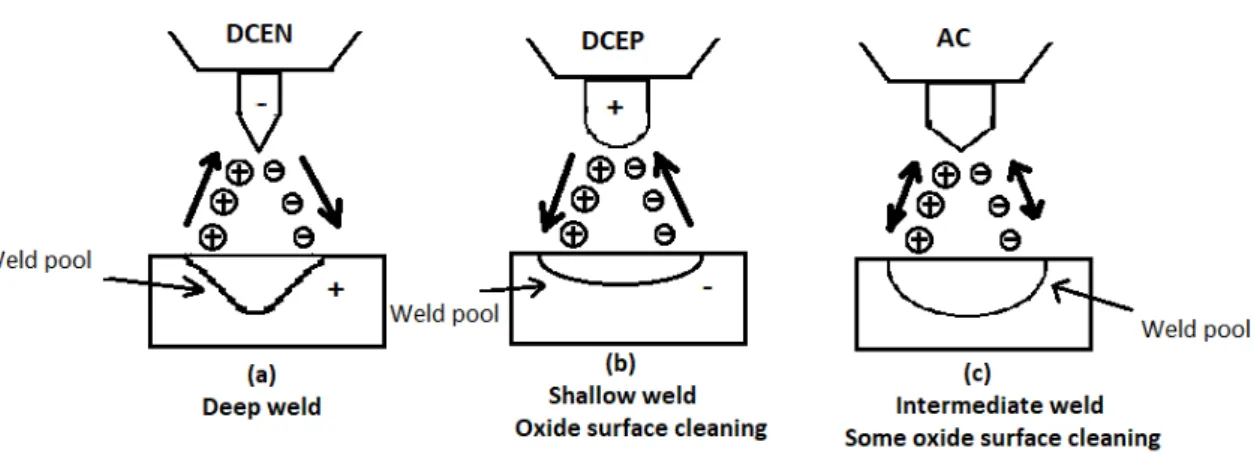
TIG welding can be done using three different polarities. The first one is called, Direct Current Electrode Negative (DCEN) or straight polarity, where the electrode is connected to the negative terminal of the power supply. This makes the electrons accelerate through the arc and requires a lot of energy to break the electrons from the electrode but energy equal to the one needed to free the electrons is released when the electrons hit the workpiece. By using DCEN more energy is located at the workpiece (about two-thirds) compared to the electrode (about one-third), which produces a relatively deep and narrow weld.
The second one is called Direct Current Electrode Positive (DCEP) or reverse polarity, where the electrode is instead connected to the positive terminal of the power supply, which reverses the heating effect of the DCEN, and the majority of the energy is now located at the electrode. Unlike DCEN, DCEP requires a water-cooled, larger diameter electrode to prevent it from melting. But in return when using DCEP a shallow weld is produced and because the argon gas is positively charged, it gets attracted to the negatively charged workpiece, where it knocks of the oxide layer creating a cleaning effect. This makes it possible for the DCEP to be used on thin sheets of strong oxide-forming materials like aluminium and magnesium.
The last option is when an alternate current (AC) is used which gives the advantages of using both DCEN and DCEP to some degree, meaning that it gives good penetration with some oxide cleaning action. AC is often used for welding aluminium alloys [10, pp. 13-16].
6
Figure 4 compares the three different polarities used in TIG welding.
Figure 4. The figure shows: a) Direct Current Electrode Negative (DCEN) weld, b) Direct Current Electrode Positive (DCEP) Weld, c) Alternate Current (AC) weld and some of their properties on the workpiece.
7
2.4 Laser Beam Welding (LBW)
LBW is a welding process that uses a laser beam to melt and join metals together. There are different ways of producing the laser beam. A few examples are solid-state laser-like Yttrium Aluminum Garnet (YAG) base lasers, gas laser-like CO2 lasers and semiconductor-based lasers like laser diode
lasers. Similar to TIG welding, a shielding gas can be used to protect the welding area. In LBW the protection of the welding area with the shielding gas is because high power lasers produce a plasma in the air which can absorb and scatter the laser beam, significantly reducing the penetration depth of the laser beam [10, pp. 29-32].
Figure 5. The figure shows a simple schematic of the different parts for a robotic-driven laser beam welder. The tube between the flash lamps can either be a crystal making it a solid-state laser or a gas making it a gas-based laser.
CO2 lasers are high beam quality, high power lasers with a maximum laser power of up to 50 kW, but
CO2 lasers of 1-15kW power are typically used in welding automotive, aviation, marine and steel
components.
YAG lasers can be transported using optical fibers and operate in both pulsating wave mode or continues wave mode where pulsating wave lasers are used in welding small parts like electric
components and battery cases while continues wave lasers with a higher laser power than the pulsating wave lasers are used for welding aluminium cars, zinc-coated steel sheets and stainless steel pipes. The drawback of some YAG lasers is the low electrical efficiency (the ratio between their laser output compared to the electrical input), which is less than 4%. Therefore, other alternative solid-state lasers have been developed like laser diode-pumped disk and fibre lasers because of the high electrical efficiency of the laser diodes, which has between 30 and 60% electrical efficiency. Laser diodes can be directly used to weld things like stainless steels, plastics, thin sheets of aluminium alloys and steels. Even though laser diodes have a high electrical efficiency they also produce a poor laser beam quality. To get a better laser-quality while still keeping a relatively high electrical efficiency disk and fibre lasers are used which have an electrical efficiency of 25% with a maximum laser power of 16kW for the disk lasers and 100kW for the fibre lasers [11, pp. 4-7].
8
LBW has a problem with the reflection of the laser beam reflecting off the metallic surface. This reflectivity can be as high as 95% of the beam power from a CO2 laser-focused on a polished metallic
surface. To mitigate this, surface modifications such as surface coatings or roughening up the surface of the material are used to significantly reduce the reflectivity of the surface and allow the energy from the laser beam to be absorbed by the material. Internal reflectivity of the laser beam increases the energy absorption of the material because, once the beam has penetrated the material it becomes trapped inside the hole by the internal reflection [10, p. 31].
9
2.5 Background and theory of welding calculations
The values used in this subsection can be found in Appendix A: Table 11–15 and focuses on the data which are used in this thesis. For general information about the welding methods see the previous subsection that describes the welding methods broader terms.
Welding methods are difficult to rank in cost order. There are many possible factors, for example, the thickness of materials chosen, labour cost, maintenance of machines necessary etc. Therefore, there is no perfect method that can use in all scenarios, it depends on the individual cases.
TIG is normally an expensive welding method because the price of tungsten is high. The TIG method can be used for titanium with a thickness between 0.610 mm to 17,70 mm. From 0.610 mm to 4.775 mm, Square groove and fillet welds are used, from 6.35 mm to 12.70 mm, V groove and fillet welds should be used. The quality of the weldments from the TIG method can be compromised and crack when used to weld titanium alloys. This occurs due to contamination which cannot be prevented by preheating the alloy. What preheating can be used for is to eliminate surface moisture from the workpiece [12, pp. 73-74].
EBW is good for welding titanium with a thickness between 3,17 mm to 88,9 mm. The cost of direct labour for the welding of titanium with a thickness of more than 24.4 mm is less for EBW than arc methods. The benefits of EBW is that there is no need for multiple-pass welds. This causes the time needed for each weld to be less than that of the other welding methods, which will decrease labour costs relative to the other welding methods. Another benefit is that EBW is used in low temperatures, which is beneficial for the workplace environment [12, pp. 71,75-76].
The LBW method is good for titanium with a thickness between 3.5 mm and 12.7 mm. LBW is a special method, sought after especially in the aerospace and chemical industries. This method needs a special environment that is extremely clean. If there is contamination near the welding area, the welds can become comprised. Strict criteria on the environment will cause the prices of this method to be higher in comparison to other methods since access to this method will be limited. It will also not be an ideal method to use in most cases [12, pp. 71,75-76].
Resistance spot welding is good for thin titanium with a thickness of 0.9 mm to 2.36 mm. In the case of thicker materials, it is possible, but generally not economically viable [12, pp. 71,75]. The reason for the high cost when using RSW to weld thicker materials is probably due to the increases in energy or the longer period of time needed for the thicker material.
The shape and dimensions of the weld highly depend on how much energy per unit area is absorbed by the workpiece during the welding process. The more energy is absorbed by the workpiece the larger the shape and dimensions of the weld becomes. Figure 6 shows a comparison of a butt weld made
using three welding technologies [13, p. 75].
10
2.6 Cost variable terminology
L is the welding length of a welding section on the workpiece.
ρ is the density of the welding section on a workpiece.
AWc is the cross-sectional area of the weld section on the workpiece.
WW is the welding area, the weight of the welding section on the workpiece.
c is the welding speed/ travel speed of the welding method.
Wf is a welding factor corresponding to the weld weight melted in the joint. OC is the operation cost and includes primarily the salary of the worker.
AT is the arc time factor which is a ratio between the total time for the work and the effective
time used during welding.
LC is the labour cost for the welding operation. EC is the price of the electrode.
Uf is a factor corresponding to the weight from the electrode added to the welding area. ECtot is the cost of the electrode used during the welding operation.
0.06 is a conversion factor.
GF is the gas flow during the welding operation.
GP is the price of the used gas.
GasC is the total cost for the gas used during the welding operation.
EqCh is the equipment cost per hour and includes the cost for the welding equipment,
automatization cost, maintenance and more. By approximating the time, the equipment is used an hourly cost for equipment can be calculated.
EqC is the equipment cost for a welding operation. PCon is power consumption during the welding operation.
EP is the energy price.
11
2.7 Equation used for cost calculation
The equations used are primarily from “Svetshandbok” written by Klas Weman [14, p. 320].
Labour cost 𝑊𝑊 = 𝐴𝑊𝑐∗ 𝐿 ∗ 𝜌 1 𝑊𝑓 = 𝐴𝑊𝑐∗ 𝜌 ∗ 𝑐 2 𝐿𝐶 =𝑊𝑤∗ 𝑂𝐶 𝑊𝑓 ∗ 𝐴𝑇 3 𝐸𝐶𝑡𝑜𝑡= 𝑊𝑊∗ 𝐸𝐶 𝑈𝑓 4 Gas cost 𝐺𝑎𝑠𝐶 = 𝑊𝑊∗ 0.06 ∗ 𝐺𝐹∗ 𝐺𝑃 𝑊𝑓 5 Equipment cost 𝐸𝑞𝐶 =𝑊𝑊∗ 𝐸𝑞𝐶ℎ 𝑊𝑓 ∗ 𝐴𝑇 6 Energy Cost 𝐸𝑙 = 𝑃𝐶𝑜𝑛∗ 𝐸𝑃 7
12
3
Methodology
In this section, the reader will get insight into what and how the work is done. There are several parts in this section that explain the work process. Figure 7 shows the procedure for the thesis work.
Figure 7. Shows methodology used in the thesis work.
3.1 Literature study & Comprehension of the thesis
This thesis was a part of the Blekinge Institute of Technology research lab. To better understand the problem, a literature study was carried out. The literature study was carried out to research previous work done in this area. It was also done to understand how the manufacturing process is integrated into the design phase which in turn helps in avoiding reinventing the wheel. The cost of designing and producing a product was also investigated to find a way to compare different manufacturing methods in the early stages of the design process. It was also important to find background information about RSW, TIG, EBW and LBW such as how they work, what limitations they have and pros and cons in using them. The information gathered from the literature study was incorporated in section 1 “Introduction” and section 2 “Theoretical background”. The majority of the literature was gathered from BTH library website which is available for all BTH students and includes a comprehensive collection of scientific articles and literature.
3.2 Quality, Validity and Generalization
Table 1. Represents the desired service requirements.Requirement 1 Requirement 2 Requirement 3 Service Usability Multiple manufacturing methods Comparison of multiple manufacturing methods The excel model is tested in three CAD models which represent the rear turbine structure for the jet engine. The number of manufacturing methods can be easily increased to include new methods that are not currently implemented in the models. The model parameters will be variable so that a wide array of cases can be tested. In addition to testing different cases, a cost comparison will also have to be performed for different manufacturing methods using the developed models. By providing clear instructions and minimizing ambiguous custom variables, individual users will have minimal effect on the final result.
13
3.3 Ideation
Before the idea generation phase, the information gathered from the literature studies was used to find a suitable area for this thesis to focus on. After a suitable area for the thesis work was found, the idea generation phase could begin.
3.3.1 Brainwriting
A variant of the idea-generating tool developed by Bernd Rohrbach, called brainwriting was used to find a way of solving the problem found in this area. The brainwriting tool starts by each group member write down three ideas to solve the problem in the allocated time of three minutes. When the first three ideas are generated the paper is sent to the other group member and a new round of writing down 3 ideas to solve the problem per group member in under 3 minutes begins. By sending the paper to each other the group members have the opportunity to build on the other group members ideas. This was iterated five times, generating 15 ideas per group member for a total of 30 ideas [15].
After the idea generation round was finished, the generated ideas were discussed and ranked according to their ability to solving the current problem. By elimination voting the least useful or feasible idea was eliminated, the last remaining idea was chosen.
14
3.3.2 Prototyping
When a satisfactory idea to solve the problem was found using brainwriting, the prototyping phase began. Several prototypes of the excel and CAD models were created. Prototyping of excel and CAD were done in parallel to save time since developing a parametrized CAD model takes a long time. The first generation of prototypes was simple and used to learn how the programs worked and how to improve them. The prototyping phase was also used to learn which functions needed to be added for the next generation. The latest versions of the prototypes were more sophisticated but still used some of the same principles learned while developing the early prototypes.
3.3.3 CAD model
The CAD model was developed iteratively and started as simple prototypes to test how best to
parametrize the parts. The more complicated prototypes were developed to make the CAD model more realistic after a web conference was held with three experts from GKN aerospace engine systems Sweden. GKN is a multinational first tear supplier of aerospace components. During the meeting, some advice about how to improve the CAD model was given. Some of the ideas given during the meeting about the CAD model were implemented and can be seen in section 4.2.2 “Latest generation of the CAD model”.
3.4 Cost and feasibility comparison method
To calculate the cost for the different welding methods, Appendix A: Table 11–15 were used. The cost was calculated for each welding section separately. If it was possible to weld all the welding section using the same welding method, then the cost would be added up to derive the total welding cost for the product. By comparing the cost for each method, either for each welding section separately or if there is more than one welding method capable of welding the whole product, the total welding cost would be compared giving the cheapest method for each welding section separately or the cheapest method for welding the whole product with the same method. The feasibility of producing the product was checked by comparing the machine specifications from the information gathered from the
manufacturers with the specification calculated using Appendix A: Table 11–15 for each welding method separately.
15
4
Results
4.1 Idea generation
One of the eliminated ideas from the brainwriting sessions was to create an application where manufacturers and designers could input their respective data and were the most suitable method to produce the design would automatically be chosen. This idea was dropped sense nether of the group members has experience in creating this kind of application. The final idea was inspired by the application but instead of creating a program from the bottom up, an excel file could be created and if possible, the excel file could be programmed using macros. The excel file was chosen since it was the most feasible idea left and could be used to automate the needed calculations even without using any programming. Figure 8 shows a representation of the idea generation process used.
Using the same method as the one that was used to find the idea for the excel file, another idea to test the solution was also found. It was decided that the most feasible way to test the excel file was to create a parametrized CAD model and automatically test several configurations of the model using the excel file.
Figure 8. Shows an artistic representation of the idea generation process used.
4.2 Prototyping and testing
4.2.1 First-generation of the CAD model
The first generation of the cad model is a simple model of a rear-engine turbine with four parts, the inner circle, outer circle, turbine blade and a cone see Figure 9. The parameters that were
parametrized were the inner and outer radius and their respective thickness, the extrusion length of the circles and the number of blades. For the parameters see Figure 10. The benefit of this was that some
parameters could change without the need of creating a new CAD model, which means that a program can be written to automatically change the cad model and implemented into the excel file.
16
Figure 9. Shows the first generation of the CAD model.
17
4.2.2 Latest generation of the CAD model
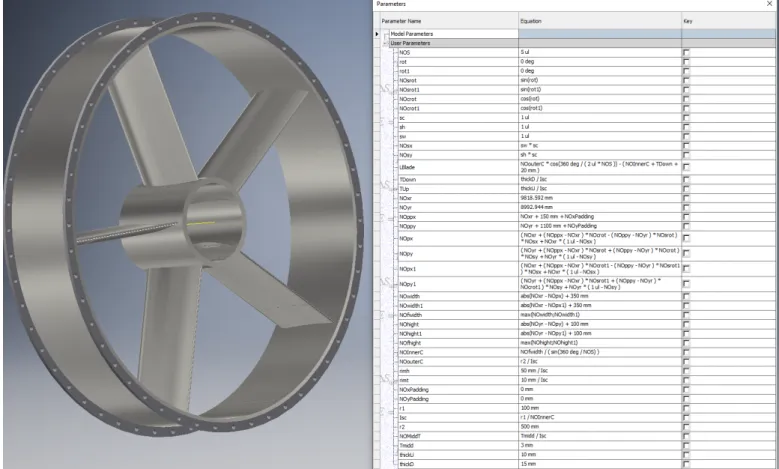
In the latest model, a NACA four-digit airfoil generator was used to generate 20 points for the blade shape. The NACA airfoil generator is a tool to generate airfoil shapes using four parameters for a four-digit NACA airfoil generator. When the generated points were imported to the inventor with the spline option, they could be assigned parameters to change the scaling, rotation and translation of the blade. the blade is hollow with an access hole for the quality control for the welds in the inner cylinder. The origin of the part was also moved from the global origin, to cope with negative numbers and geometric scaling parameters were used on the part. In this generation, more parameters were parametrized see
Figure 12. Some of the parameters that where parametrized are, number of blades, inner and outer
radius and their respective thickness, height and width of the rim. There are some parametrizations that are specific to the blade which includes the thickness of the blade, the angle of rotation for both the upper and lower part attached to the upper and lower cylinders which can rotate independently and lastly there are three scaling factors that affects the width and base length of the part. The first scaling factor is for a uniform scaling, the second one is for stretching the blade width and the last one is for stretching the base length of the blade. This CAD model was used to test the excel file, more details are under section 4.6 “Welding cost and time calculations for rear engine turbine structure test model”.
18
Figure 11. Shows the latest generation of the CAD model.
19
4.3 Excel program for manufacturers
Two excel file were developed, one for the manufacturers to input machine-specific data and one for the product-specific calculations and machine comparisons. The idée with the prototype is for the manufacturers to specify the type and limits of the machines, they are using in the first excel file. Using the data from the first excel file, the feasibility and specific machines in the workshop capable of manufacturing the product can be determined by the second excel file.
The first excel file for the machine specifications was developed with an intuitive graphical layout to simplify the process of inputting individual manufacturing machine properties, with the ability to input the same manufacturing process using different machines. The excel file was developed using VBA coding, user forms and excel shapes.
The process and functions of the excel file for the manufacturing process are described below. The first page is a cover page with a start button as seen in Figure 13, sending you to the
manufacturing page when pressed.
Figure 13. Cover page for the Digital models of manufacturing process Excel file.
The manufacturing page includes the manufacturing methods that are used in the workshop. As of now this prototype only looks at the welding process, but in the future, this section can be expanded to include more manufacturing methods. This will be further discussed in the future works section of this thesis. On this page, a button for each implemented manufacturing method is visible and linking to their respective pages, where the welding button in Figure 14 sends the user to the welding page. The
button also adds the welding section on the comparison page which can be seen in Figure 23. Lastly,
there are three buttons in the lower right hand corner that are used for navigating through the pages in the excel file. The three buttons will appear in multiple pages with the same function and will only be referenced in this page description.
20
Figure 14. Manufacturing page.
The welding page includes the welding methods used in the workshop see Figure 15. This thesis
focuses on four different welding methods. This section can be expanded to include more welding methods, which will be discussed in the future works section of this thesis. There are buttons for each implemented welding method, in this case, four. The buttons links to their respective pages which include data sheets that can be edited for the specific machines in the workshop. Similar pages will be implemented to the other manufacturing methods, which will be discussed in the future works section of this thesis.
21
By pressing one of the buttons in Figure 15, a corresponding numbered welding section will be added
to the compare page as seen in Figure 22. The numbering depends on how many machines with the
same welding method already exists in the compare page. A new worksheet copied from the templates seen in Figure 16, Figure 17, Figure 18 or Figure 19 will be created. The specific template chosen
depends on the selected welding method and the name of the new worksheet is the same as the corresponding section name in the compare page.
During normal use access to the templates is restricted and only some sections in the copied worksheet are supposed to be edited. The sections that are meant to be edited are the values except for the Axes which are automatically determined. The name for the robot and the names, values and units of the user-added robot specification are also meant to be manually edited.
22
23
24
25
After a welding method has been chosen, it is possible to change specifications for the robotic arms by changing the values next to the desired specification, which are the only cells that are intended to be accessible from the imported template during normal use. For more customization the button ADD/Remove is available. This button brings up a selection window with three options as seen in
Figure 20. The first one makes it possible to add a costume robot specification underneath the last
existing robot specification. The name and unit of the new robot specification can be changed with the values in the corresponding cells which are accessible for the added robot specifications but are meant to be restricted for the original robot specifications. This is useful in cases where designers need further information about the specific machine. The second option is to add an extra degree of freedom, in case the specific machine can move in more degrees of freedom than the one in the template. By adding one direction of freedom the number of axes will increase by one. A “J” Will be added and numbered under the robot motion and robot speed section. For a comparison of the modified chart compared to the template chart see Figure 21 which shows a modified RSW chart.
26
Figure 21. Comparing the RSW template chart with an example modification of it.
The last option for the ADD/Remove button is the remove option. The remove option opens a new window with two lists see Figure 21. The first list only shows the user added specifications and the
second list shows the degrees of freedom. Figure 21 is how the sheet looks like when no changes to
the copy of the template have been made. Multiple selections can be made and when the remove selected button is pressed all the selected specifications will be removed. When a DOF is removed the remaining DOF will change their number while still keeping the same values as before.
27
Figure 22. Shows two lists with the possible items to remove, list 1 shows user-added specifications and list two shows the DOF.
The last button on the machine specification page is the DONE button. By pressing this button, a copy of the edited specifications is placed in the compare page underneath the corresponding section.
Figure 22 shows how each section is added to the compare page and the changes in the compare sheet
28
Figure 23. Shows the evolution of compare page.
The lists below describe the numbers in Figure 23.
(1) Shows how the sheet looks before any action that affects the compare page is taken. The home
button on the top left corner of the page brings the user back to the cover page.
(2) When the manufacturing method is chosen, in this case, the welding method, the
corresponding section is added to the sheet.
(3) After a welding method is chosen a subsection is added to the weld section, in this case, the
Resistance Spot Welding method was chosen. Notice also that the RSW subsection is also numbered since more than one RSW subsection can be added to the weld section.
(4) After changes to the copy of the RSW template for this subsection has been completed and the
done button has been pressed. The chart from the relevant sheet is inserted under the corresponding subsection on the compare page.
(5) By adding an additional welding method, in this case, the LBW method, a new subsection is
created underneath the weld section. Notice also that the position of the weld section is re-centred above its subsections. In addition to this, the visible columns in the compare sheet are adjusted.
(6) After finishing the changes of the copied template and the done button in the relevant
subsection sheet have been pressed, the chart from that sheet is inserted in the compare page under the corresponding subsection. If necessary the visible rows in the compare sheet are adjusted, in this case, it is not necessary since the RSW (1) chart is longer then the LBW(1) chart.
29
In the compare page, there are two more functions, which are triggered by pressing the subsection labels. By pressing the labels of the subsection, a window with two alternatives appear as seen in
Figure 24.
Figure 24. Alternatives for the subsections in the compare sheet.
The first alternative is a delete button which removes the chosen subsection and its chart from the compare sheet. It also sorts the remaining subsections and renumbers the remaining subsections which were added after the removed one and used the same welding method. It also adjusts the visible work area in the compare sheet if needed. An example of this can be seen in Figure 25. The second option
30
31
4.4 Example of welding cost calculation by hand
The four subsections to this section 0 are an example of welding cost calculations for half a meter-long titanium sheet with a thickness of 3.2 mm. Some of the values are not real values and taken from different publicly available sources with a reference to the source in the chart next to the used value. Values without any references are assumptions based on either multiple reference with differing values and a guess hade to be made or they were based on a guess without any references, like EC where the electrode cost was assumed to be 30 SEK/kg for TIG based on different companies selling tungsten electrodes.
4.4.1 TIG calculation
Formulas 1-7, appendix A Table 12 and Table 16 were used for the TIG welding method calculations.
When calculating the angle of the weld, the equation found in Figure 28 is used. The value found in Figure 28 were taken from appendix A Table 16. The relationship between the thickness and angle is
plotted as a graph in excel and an equation for the relationship is also found for the graph in Figure 28.
Figure 26. Showing the root opening
Figure 27. Showing the weld length
32
Table 2. Shows values used, sources for the values and the results for TIG calculation of a 3.2 mm thick 0.5 m long titanium sheets.
Symbols Data Units Equation Reference
root opening 8,128 Mm Table 16
Α 46,6 Deg Figure 28 𝑡 3,2 Mm 𝐿 500 Mm 𝜌 4,5*10-5 kg/mm3 [12] 𝐴𝑊𝑐 30,416 mm2 𝑐 12192 mm/h Table 12 𝑂𝐶 280 SEK/h [16] 𝐴𝑇 41 % 𝐸𝐶 30 SEK/kg 𝑈𝑓 0,95 [17, p. 360] 𝐺𝐹 708 l/h 𝐺𝑃 400 SEK/l 𝐸𝑞𝐶ℎ 450 SEK/h 𝐸𝑃 0,5633 SEK/kWh [18] 𝑃𝐶𝑜𝑛 1,5 kWh [19] 𝑊𝑊 0,068 Kg 1 𝑤𝑓 1,67 kg/h 2 Result 𝐿𝐶 27,8 SEK 3 𝐸𝐶𝑡𝑜𝑡 2,14 SEK 4 𝐺𝑎𝑠𝐶 11,53 SEK 5 𝐸𝑞𝐶 44,7 SEK 6 𝐸𝑙 0,85 SEK 7
33
4.4.2 LBW calculation
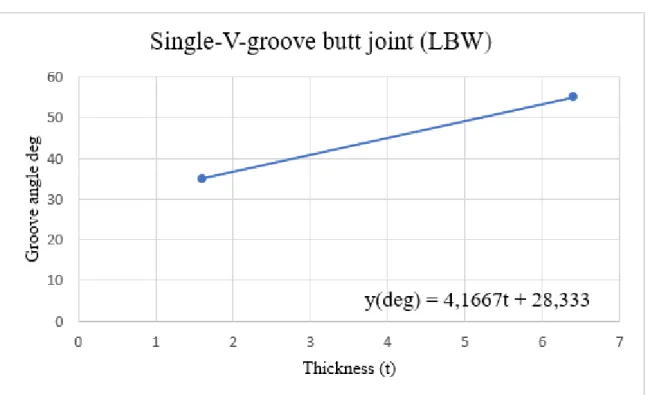
Welding cost calculation for laser beam welding was made with the same formulas used to calculate the welding cost for TIG. The equipment cost for LBW was changed from 450 SEK/ h used in TIG to 800 SEK/ h. This was due to the cost of the extremely clean environment needed for LBW. The welding angle was been calculated using the equations in Figure 30.
Figure 29. Shows a picture of laser beam welding.
34
Table 3. Shows values used, sources for the values and the results for LBW calculation of a 3.2 mm thick 0.5 m long titanium sheets.
Symbols Data Units Equation Reference
α 41,67 Deg Figure 30 𝑡 3,2 Mm 𝐿 500 Mm 𝜌 4,5*10-5 kg/mm3 [12] 𝐴𝑊𝑐 3,9 mm2 𝑐 91440 mm/h Table 13 𝑂𝐶 280 SEK/h [16] 𝐴𝑇 50 % 𝐺𝐹 300 l/h [20] 𝐺𝑃 400 SEK/l 𝐸𝑞𝐶ℎ 800 SEK/h 𝐸𝑃 0,5633 SEK/kWh [18] 𝑃𝐶𝑜𝑛 1,5 kWh [19] 𝑊𝑊 0,0088 Kg 1 𝑤𝑓 1,60 kg/h 2 Result 𝐿𝐶 3 SEK 3 𝐺𝑎𝑠𝐶 6,6 SEK 5 𝐸𝑞𝐶 8,8 SEK 6 𝐸𝑙 0,85 SEK 7
35
4.4.3 EBW calculation
The welding cost calculation for electrode beam welding uses the same formulas as before.
Unlike LBW and TIG welding EBW does not use a protective gas. The equation in Figure 32 is used
to calculate the weld angle.
Figure 31. Shows a picture of electron beam welding.
36
Table 4. Shows values used, sources for the values and the results for EBW calculation of a 3.2 mm thick 0.5 m long titanium sheets.
Symbols Data Units Equation Reference
α 36,67 ° Figure 32 𝑡 3,2 mm 𝐿 500 mm 𝜌 4,5*10-5 kg/mm3 [12] 𝐴𝑊𝑐 3,39 mm2 𝑐 45720 mm/h Table 14 𝑂𝐶 280 SEK/h [16] 𝐴𝑇 44 % 𝐸𝑞𝐶ℎ 950 SEK/h 𝐸𝑃 0,5633 SEK/kWh [18] 𝑃𝐶𝑜𝑛 2,5 kWh [21] 𝑊𝑊 0,0076 kg 1 𝑤𝑓 0,698 kg/h 2 Result 𝐿𝐶 6,93 SEK 3 𝐸𝑞𝐶 23,5 SEK 6 𝐸𝑙 1,4 SEK 7
37
4.4.4 RSW calculation
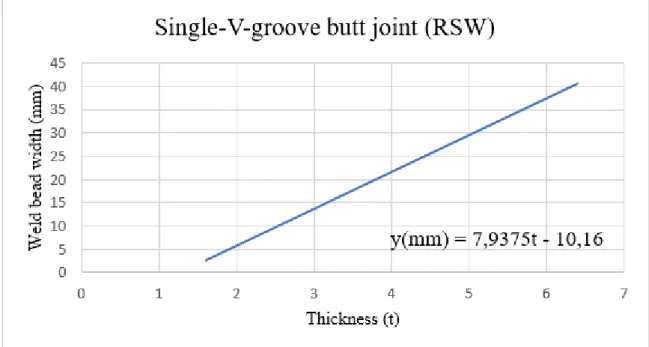
The welding cost calculation for resistance spot welding uses the same formulas as before. Resistance spot welding does not create any root opening or welding angles (see Figure 26). To be able to
calculate the weld area, the weld bead width was used (see Figure 34). The weld bead width was
calculated using the equation in Figure 35. The weld bead was assumed to be circular. For calculating
the travel speed a 50% overlap of the weld bead was used.
Figure 33. Shows a picture of resistance spot welding.
Figure 34. Shows the weld bead width.
38
Table 5. Shows values used, sources for the values and the results for RSW calculation of a 3.2 mm thick 0.5 m long titanium sheets.
Symbols Data Units Equation Reference
Weld bead width 15,24 mm Figure 35 𝑡 3,2 mm 𝐿 500 mm 𝜌 4,5*10-5 kg/mm3 [12] 𝐴𝑊𝑐 182 mm2 𝑐 36000 mm/h Table 15 Table 16 𝑂𝐶 280 SEK/h [16] 𝐴𝑇 55,2 % 𝐸𝑞𝐶ℎ 900 SEK/h 𝐸𝑃 0,5633 SEK/kWh [18] 𝑃𝐶𝑜𝑛 2,5 kWh [21] 𝑊𝑊 0,41 kg 1 𝑤𝑓 29,5 kg/h 2 Result 𝐿𝐶 7,1 SEK 3 𝐸𝑞𝐶 22 SEK 6 𝐸𝑙 1,4 SEK 7
39
4.5 Excel program for calculation
To make the welding calculation cost easier an excel program was created. The excel program contains all the formulas needed to calculate the welding cost for the data available in this thesis.
Formulas 1-7, Appendix A: Table 11–15 are used in this program. Some of the values must be selected
by the user of the excel program. The process and functions of the excel file are described below.
Figure 36. Cover page for the excel calculations program.
The first page is a cover page with a start button (1) as seen in Figure 36, sending the user to the
manufacturing page when pressed.
Figure 37. Manufacturing page.
Figure 37 shows the manufacturing page which includes all the implemented manufacturing methods.
As of now, only the welding method is implemented (2). The rest of the buttons (3) on this page
40
Figure 38. Welding page.
Figure 38 shows the welding page which includes all the implemented welding methods. The
implemented welding methods are TIG, LBW, EBW and RSW. By pressing one of button
representing a welding method, the user is sent to their respective pages where the necessary input values for the specific welding method can be edited. The compare weld button (4) sends the user to
the welding calculations page shown in Figure 40 where an overviewed of the previously saved
41
42
After a specific welding method have been chosen, which in Figure 39 is the TIG method. It is time
for the user to input workplace and product-specific data in the numbers column for the green rows indicated by (6). After the user-specific data have been entered, the values for all automatically
calculated cells which are salmon-coloured and (5) can be computed. The exception to this is the TIG
welding method page where the welding length is doubled or tripled of the originally inputted value depending on how many passes the TIG welding method needs for each weld, indicated in Table 12. The equations and data for the automatically calculated cells were derived in a similar way to how they were calculated in section 4.4 “Example of welding cost calculation by hand”. If the user inputs a value outside the data used in this thesis, then a warning message will appear and most of the values will be set to zero in the welding calculations page for that specific welding method. To save the chart and compare it to the rest of the saved welding method calculations, the save button (7) can be
pressed. The save button copies the chart from the specific welding methods calculation page to the welding calculations page as seen in Figure 40. The home button (8) sends the user back to the
coverage page. The calculation pages for RSW, EBW and LBW is set up in a similar way to the TIG calculation page.
43
44
Figure 40 shows the welding calculations page before any welding method calculation has been
saved. When a welding method is chosen and the calculations for that method preformed and saved, a copy of the chart from the calculation page is copied over to the corresponding welding method subsection in the welding calculations page. As mentioned under the welding calculation page if the user inputted data is outside the values used in this thesis a warning message will appear and most of the copied values in the chart will be set to zero as seen in Figure 40. All data used in this thesis can
be found in Appendix A: Table 11–15.
.
Figure 41. Shows machine page.
The last page in this excel file is the machine page as seen in Figure 41. In this page, there are four
essential buttons that help the user find which of the manufacturer-specific machines can be used to manufacture this specific product according to the available data in this thesis.
Button (1) is the import button. It is used to import the machine-specific data from the excel program
for manufacturers specifically the compare page which can be seen in Figure 25. The
machine-specific data is imported to a new page in this excel file called compare as seen in Figure 42. Button
(3) is the compare calculations button. It uses the newly imported compare page to check if the values
from the welding calculations page are inside the ranges for the imported machine specifications. If it finds that the values for a specific welding method from the welding calculations page are inside the range for a specific machine corresponding to that specific welding method, then that specific machine is copied from the imported compare page onto the machine page as seen in Figure 51. Button (2) is
the delete button which is used to delete the imported compare page and the copied machines that are in the machine page, if any changes were made in the 4.3 “Excel program for manufacturers” then the old imported compare page, must be deleted before the newly updated compare page can be imported again. Button (4) is the home button used to send the user back to the cover page.
45
46
4.6 Welding cost and time calculations for rear engine turbine
structure test model
Three tests were constructed to test the excel file and determine which welding method/ methods were most feasible. The test part is the cad model of a rear-engine turbine structure described in section 4.2.2 “Latest generation of the CAD model”. The parameters were changed between the tests and can be seen in Appendix B Table 17, appendix C Table 18 and appendix D Table 19 for each test. The parameters were chosen so that the dimensions from the CAD model were inside the range of at least one of the welding methods data available in this thesis. The machine specification ranges were the same for all three tests and were set to the maximum and minimum values available in Appendix A:
Table 11–15. The results for the test are presented in section 4.6 “Welding cost and time calculations
for rear engine turbine structure test model” which calculates the total cost and time needed for completing the manufacturing process for each test model. A five-second delay was added as dead time primary for moving to the next weld spot. This time was added to the total welding time, equally for all four welding methods and covers any time in the welding process used aside from the arc time. Since deadtime is highly variable, it was decided to make this parameter equal for all welding
47
4.6.1 Test one
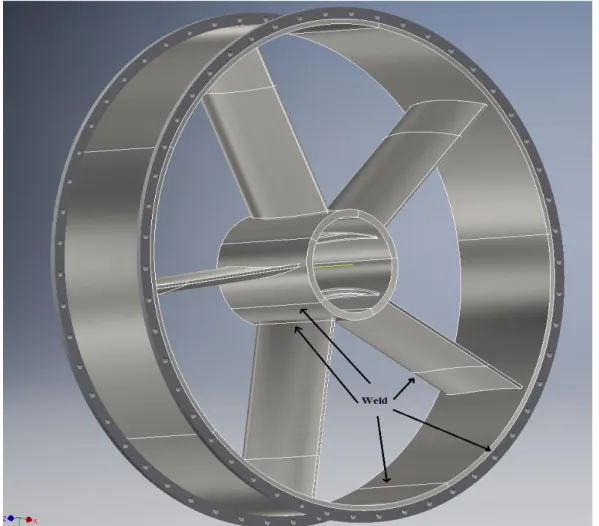
The arrows in Figure 43 mark the welding spots for one section and the rim. In test one there are two
rim section and five of each of the remaining sections marked by arrows. This gives a total of 2 rim sections, ten blade sections as the upper and lower welding spot for the blade are identical, five inner cylinder sections and five outer cylinder sections needed to be welded. The parameters used for the CAD model in test one can be found in Table 17.
Figure 43. Shows a rear-engine turbine structure used in test one, marked with welding spots. Table 6 shows the total welding cost for all section of each part in test one using the four welding
methods studied in this thesis. As can be seen in Table 6 EBW and TIG are the only methods capable of welding all the parts of the rear engine turbine structure model in test one using the data available in this thesis. The cheapest method to use for welding the whole structure is EBW but it might be more economically feasible to weld the rims and the outer cylinder using LBW and the rest of the structure using EBW assuming no additional costs are added by changing the welding method.
Another important comparison when deciding which welding method to use is the welding time. In
Table 7 the arc time is compared for the four different welding methods, since as discussed earlier the
deadtime included in the weld time is highly variable. The fastest of the two welding methods capable of welding all the parts are the EBW with a time of 0,1518 hours or approximately 9 minutes. Another interesting fact is that even though the LBW method was cheaper to use for welding the rims and the outer cylinder than the EBW method was, the EBW method compared to the LBW method was faster. The EBW method was also the fastest method to uses for all parts individually.