Technical Report
TR19-11 November, 2019
Ag
ricultural
Experiment Station
College ofAgricultural Sciences Bioagricultural Sciences and Department of Pest Management
2017 Colorado Field Crop
Insect Management Research
and Demonstration Trials
2017 Colorado Field Crop
Insect Management Research
and Demonstration Trials
1 Frank B. Peairs2 Darren Cockrell2 Jeff Rudolph2 Laura Newhard2 1Mention of a trademark or proprietary product does not constitute endorsement by the Colorado Agricultural Experiment Station. 2Department of Bioagricultural Sciences and Pest Management, Colorado State UniversityColorado State University is an equal opportunity/affirmative action institution and complies
with all Federal and Colorado State laws, regulations, and executive orders regarding
affirmative action requirements in all programs. The Office of Equal Opportunity is located in
101 Student Services. In order to assist Colorado State University in meeting its affirmative
action responsibilities, ethnic minorities, women, and other protected class members are
TABLE OF CONTENTS CONTROL OF ALFALFA INSECTS IN ALFALFA WITH HAND‐APPLIED INSECTICIDES, ARDEC, FORT COLLINS, CO, 2017 . . . 3 CONTROL OF ALFALFA INSECTS IN ALFALFA WITH HAND‐APPLIED INSECTICIDES, FORT COLLINS, FORT LUPTON, LONGMONT AND NIWOT, CO, 2016‐17 . . . 8 CONTROL OF BIOTYPE 2 RUSSIAN WHEAT APHID IN WINTER WHEAT WITH HAND‐APPLIED INSECTICIDES, ARDEC, FORT COLLINS, CO, 2017 . . . 14 CONTROL OF BIOTYPE 2 RUSSIAN WHEAT APHID IN SPRING MALT BARLEY WITH HAND‐APPLIED INSECTICIDES, ARDEC, FORT COLLINS, CO, 2017 . . . 16 CONTROL OF WESTERN CORN ROOTWORM IN FIELD CORN WITH PLANTING‐TIME SOIL INSECTICIDES, SEED TREATMENTS, AND PLANT‐INCORPORATED PROTECTANTS, WINDSOR, CO, 2017 . . . 18 CONTROL OF SPIDER MITES IN CORN WITH HAND‐APPLIED INSECTICIDES AND MITICIDES, ARDEC, FORT COLLINS, CO, 2017. . . 21 2017 PEST SURVEY RESULTS. . . 26 INSECTICIDE PERFORMANCE SUMMARIES . . . 30 ACKNOWLEDGMENTS . . . 34 PRODUCT INDEX . . . 35
CONTROL OF ALFALFA INSECTS IN ALFALFA WITH HAND‐APPLIED INSECTICIDES, ARDEC, FORT COLLINS, CO, 2017 Frank Peairs, Darren Cockrell, Jeff Rudolph, Laura Newhard, Camden James, Bruce Gammonley, and Sam Wheeler, Department of Bioagricultural Sciences and Pest Management CONTROL OF ALFALFA INSECTS IN ALFALFA WITH HAND‐APPLIED INSECTICIDES, ARDEC, FORT COLLINS, CO, 2017: Early treatments were applied on 12 April 2017 with a ‘rickshaw‐type’ CO2 powered sprayer calibrated to apply 20 gal/acre at 3 mph and 30 psi through six XR8002VS nozzles mounted on a 10.0 ft boom. Early treatments were made approximately when army cutworm treatments are applied in the region. This was done to determine the effect of army cutworm treatment in alfalfa on subsequent alfalfa weevil larval densities. All other treatments were applied in the same manner on 16 May 2017. Conditions for the early treatments were clear skies with calm winds and 64EF, and for the later
treatments, clear, winds 10 mph from the southwest and 70EF. No precipitation was recorded
during the 24 h period following the early treatment date, and 0.1 inches fell 12 h after the late
treatments. Plots were 10.0 ft by 25.0 ft and arranged in six replicates of a randomized,
complete block design. The untreated control and Warrior II, 1.92 oz./acre, plots were
replicated 12 times for a more accurate comparison of treatment effects on yield (insect counts
from six reps of each treatment were included in the analyses described below). The crop was
6 inches in height at the time of early treatments and 8‐10 inches at the time of the later
treatments.
Treatments were evaluated by taking ten 180
Nsweeps per plot with a standard 15 inch
diameter insect net 8, 15 and 21 days after the later treatments (DAT). Alfalfa weevil larvae,
alfalfa weevil adults and pea aphids were counted. A pretreatment sample was taken on 16
May 2016 by taking 60, 180
Nsweeps across the experimental area. A total of 3,132 alfalfa
weevil larvae, 6 alfalfa weevil adults, and 4,964 pea aphids was collected in this sample. Counts
were transformed by the log +1 method to correct for nonadditivity. Transformed counts were
subjected to analysis of variance and mean separation by Tukey’s Honestly Significant
Difference (HSD) procedure (α=0.05). Original means are presented in Tables 1‐3. Yields were
measured on 7 June 2017 by hand harvesting a 0.5 m
2area per plot. Samples were weighed
wet and dry and converted to lbs of dry hay per acre prior to comparing yields of treated plots
to those of untreated plots using analysis of variance.
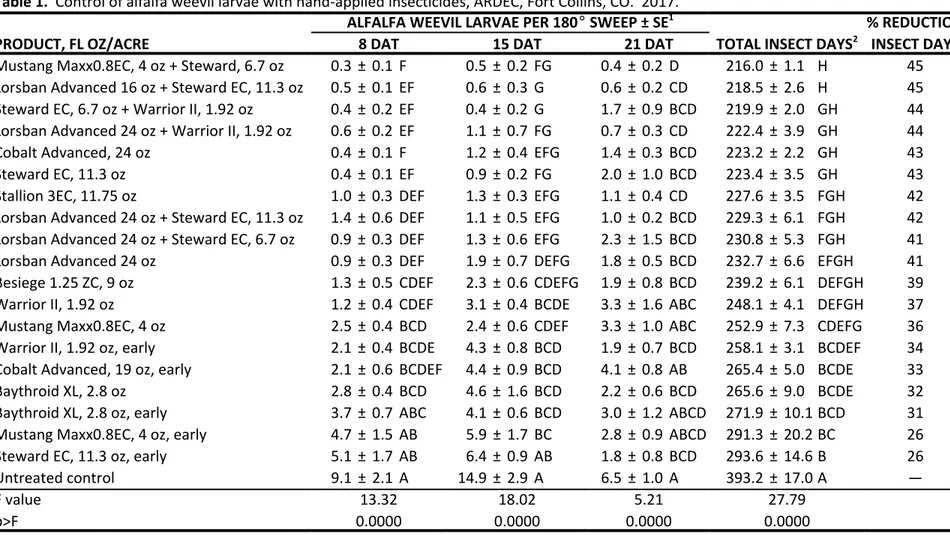
Alfalfa weevil larval densities were higher than those observed in 2016, averaging 8.6 and 14.9
larvae per sweep 14 DAT in 2016 and 15 DAT in 2017, respectively. Pea aphid densities were
much higher than those observed in 2016, averaging 3.8 and 31.5 aphids per sweep at 14 DAT
in 2016 and 15 DAT in 2017, respectively. All treatments had fewer alfalfa weevil days than the
untreated control (Table 1). Pea aphid days were similar for all treatments except Cobalt
Advanced, 19 oz, early, Mustang Maxx0.8EC, 4 oz, early and Steward EC, 11.3 oz, early, which hadmore (Table 3). No phytotoxicity was observed with any treatment. Yield were 35.5% lower in
the untreated plots (df=11,23; F=8.45; p>F=0.0143). Yield reductions have been measured at
ARDEC since 1996 and in 12 of those years the differences have been statistically significant.
Losses in years with statistical differences have averaged 11.1%, with a range of ‐14.3 to 35.5%.
Field History
Pests:
Alfalfa weevil, Hypera postica (Gyllenhal)
Pea aphid, Acyrthosiphon pisum (Harris)
Cultivar:
PGI 447RR
Plant Stand:
Good
Irrigation:
Overhead sprinkler
Crop History:
Alfalfa since August 2016
Herbicide:
None
Insecticide:
None prior to experiment
Fertilization:
None
Soil Type:
Sandy clay loam
Location:
Agricultural Research, Development and Education Center (ARDEC), 4616
North Frontage Road, Fort Collins, CO, 80524 (Field 1080: N40.655857,
W104.996424)
Table 1. Control of alfalfa weevil larvae with hand‐applied insecticides, ARDEC, Fort Collins, CO. 2017.
ALFALFA WEEVIL LARVAE PER 180E SWEEP ± SE1 % REDUCTION
PRODUCT, FL OZ/ACRE 8 DAT 15 DAT 21 DAT TOTAL INSECT DAYS2 INSECT DAYS
Mustang Maxx0.8EC, 4 oz + Steward, 6.7 oz 0.3 ± 0.1 F 0.5 ± 0.2 FG 0.4 ± 0.2 D 216.0 ± 1.1 H 45 Lorsban Advanced 16 oz + Steward EC, 11.3 oz 0.5 ± 0.1 EF 0.6 ± 0.3 G 0.6 ± 0.2 CD 218.5 ± 2.6 H 45 Steward EC, 6.7 oz + Warrior II, 1.92 oz 0.4 ± 0.2 EF 0.4 ± 0.2 G 1.7 ± 0.9 BCD 219.9 ± 2.0 GH 44 Lorsban Advanced 24 oz + Warrior II, 1.92 oz 0.6 ± 0.2 EF 1.1 ± 0.7 FG 0.7 ± 0.3 CD 222.4 ± 3.9 GH 44 Cobalt Advanced, 24 oz 0.4 ± 0.1 F 1.2 ± 0.4 EFG 1.4 ± 0.3 BCD 223.2 ± 2.2 GH 43 Steward EC, 11.3 oz 0.4 ± 0.1 EF 0.9 ± 0.2 FG 2.0 ± 1.0 BCD 223.4 ± 3.5 GH 43
Stallion 3EC, 11.75 oz 1.0 ± 0.3 DEF 1.3 ± 0.3 EFG 1.1 ± 0.4 CD 227.6 ± 3.5 FGH 42
Lorsban Advanced 24 oz + Steward EC, 11.3 oz 1.4 ± 0.6 DEF 1.1 ± 0.5 EFG 1.0 ± 0.2 BCD 229.3 ± 6.1 FGH 42
Lorsban Advanced 24 oz + Steward EC, 6.7 oz 0.9 ± 0.3 DEF 1.3 ± 0.6 EFG 2.3 ± 1.5 BCD 230.8 ± 5.3 FGH 41
Lorsban Advanced 24 oz 0.9 ± 0.3 DEF 1.9 ± 0.7 DEFG 1.8 ± 0.5 BCD 232.7 ± 6.6 EFGH 41
Besiege 1.25 ZC, 9 oz 1.3 ± 0.5 CDEF 2.3 ± 0.6 CDEFG 1.9 ± 0.8 BCD 239.2 ± 6.1 DEFGH 39
Warrior II, 1.92 oz 1.2 ± 0.4 CDEF 3.1 ± 0.4 BCDE 3.3 ± 1.6 ABC 248.1 ± 4.1 DEFGH 37
Mustang Maxx0.8EC, 4 oz 2.5 ± 0.4 BCD 2.4 ± 0.6 CDEF 3.3 ± 1.0 ABC 252.9 ± 7.3 CDEFG 36
Warrior II, 1.92 oz, early 2.1 ± 0.4 BCDE 4.3 ± 0.8 BCD 1.9 ± 0.7 BCD 258.1 ± 3.1 BCDEF 34
Cobalt Advanced, 19 oz, early 2.1 ± 0.6 BCDEF 4.4 ± 0.9 BCD 4.1 ± 0.8 AB 265.4 ± 5.0 BCDE 33
Baythroid XL, 2.8 oz 2.8 ± 0.4 BCD 4.6 ± 1.6 BCD 2.2 ± 0.6 BCD 265.6 ± 9.0 BCDE 32
Baythroid XL, 2.8 oz, early 3.7 ± 0.7 ABC 4.1 ± 0.6 BCD 3.0 ± 1.2 ABCD 271.9 ± 10.1 BCD 31
Mustang Maxx0.8EC, 4 oz, early 4.7 ± 1.5 AB 5.9 ± 1.7 BC 2.8 ± 0.9 ABCD 291.3 ± 20.2 BC 26 Steward EC, 11.3 oz, early 5.1 ± 1.7 AB 6.4 ± 0.9 AB 1.8 ± 0.8 BCD 293.6 ± 14.6 B 26 Untreated control 9.1 ± 2.1 A 14.9 ± 2.9 A 6.5 ± 1.0 A 393.2 ± 17.0 A — F value 13.32 18.02 5.21 27.79 p>F 0.0000 0.0000 0.0000 0.0000 1 SE, standard error of the mean. Means in the same column followed by the same letter(s) are not statistically different, Tukey’s HSD (%=0.05). 2 Calculated by the method of Ruppel (Journal of Economic Entomology 76: 375‐7, 1983). The table is sorted by the means in this column.
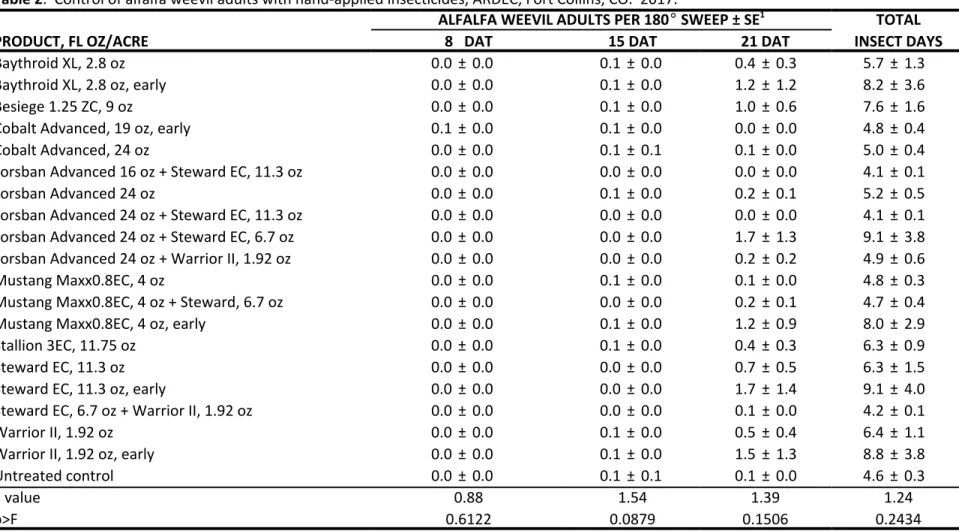
Table 2. Control of alfalfa weevil adults with hand‐applied insecticides, ARDEC, Fort Collins, CO. 2017.
ALFALFA WEEVIL ADULTS PER 180E SWEEP ± SE1 TOTAL
PRODUCT, FL OZ/ACRE 8 DAT 15 DAT 21 DAT INSECT DAYS
Baythroid XL, 2.8 oz 0.0 ± 0.0 0.1 ± 0.0 0.4 ± 0.3 5.7 ± 1.3 Baythroid XL, 2.8 oz, early 0.0 ± 0.0 0.1 ± 0.0 1.2 ± 1.2 8.2 ± 3.6 Besiege 1.25 ZC, 9 oz 0.0 ± 0.0 0.1 ± 0.0 1.0 ± 0.6 7.6 ± 1.6 Cobalt Advanced, 19 oz, early 0.1 ± 0.0 0.1 ± 0.0 0.0 ± 0.0 4.8 ± 0.4 Cobalt Advanced, 24 oz 0.0 ± 0.0 0.1 ± 0.1 0.1 ± 0.0 5.0 ± 0.4 Lorsban Advanced 16 oz + Steward EC, 11.3 oz 0.0 ± 0.0 0.0 ± 0.0 0.0 ± 0.0 4.1 ± 0.1 Lorsban Advanced 24 oz 0.0 ± 0.0 0.1 ± 0.0 0.2 ± 0.1 5.2 ± 0.5 Lorsban Advanced 24 oz + Steward EC, 11.3 oz 0.0 ± 0.0 0.0 ± 0.0 0.0 ± 0.0 4.1 ± 0.1 Lorsban Advanced 24 oz + Steward EC, 6.7 oz 0.0 ± 0.0 0.0 ± 0.0 1.7 ± 1.3 9.1 ± 3.8 Lorsban Advanced 24 oz + Warrior II, 1.92 oz 0.0 ± 0.0 0.0 ± 0.0 0.2 ± 0.2 4.9 ± 0.6 Mustang Maxx0.8EC, 4 oz 0.0 ± 0.0 0.1 ± 0.0 0.1 ± 0.0 4.8 ± 0.3 Mustang Maxx0.8EC, 4 oz + Steward, 6.7 oz 0.0 ± 0.0 0.0 ± 0.0 0.2 ± 0.1 4.7 ± 0.4 Mustang Maxx0.8EC, 4 oz, early 0.0 ± 0.0 0.1 ± 0.0 1.2 ± 0.9 8.0 ± 2.9 Stallion 3EC, 11.75 oz 0.0 ± 0.0 0.1 ± 0.0 0.4 ± 0.3 6.3 ± 0.9 Steward EC, 11.3 oz 0.0 ± 0.0 0.0 ± 0.0 0.7 ± 0.5 6.3 ± 1.5 Steward EC, 11.3 oz, early 0.0 ± 0.0 0.0 ± 0.0 1.7 ± 1.4 9.1 ± 4.0 Steward EC, 6.7 oz + Warrior II, 1.92 oz 0.0 ± 0.0 0.0 ± 0.0 0.1 ± 0.0 4.2 ± 0.1 Warrior II, 1.92 oz 0.0 ± 0.0 0.1 ± 0.0 0.5 ± 0.4 6.4 ± 1.1 Warrior II, 1.92 oz, early 0.0 ± 0.0 0.1 ± 0.0 1.5 ± 1.3 8.8 ± 3.8 Untreated control 0.0 ± 0.0 0.1 ± 0.1 0.1 ± 0.0 4.6 ± 0.3 F value 0.88 1.54 1.39 1.24 p>F 0.6122 0.0879 0.1506 0.2434 1 SE, standard error of the mean. Treatments listed in alphabetical order.
Table 3. Control of pea aphids with hand‐applied insecticides, ARDEC, Fort Collins, CO. 2017.
PEA APHIDS PER 180E SWEEP ± SE1 % REDUCTION
PRODUCT, FL OZ/ACRE 8 DAT 15 DAT 21 DAT TOTAL INSECT DAYS2 INSECT DAYS
Warrior II, 1.92 oz 1.2 ± 0.6 CD 5.1 ± 0.6 F 30.3 ± 5.9 BC 465.3 ± 20.4 F 11
Besiege 1.25 ZC, 9 oz 1.0 ± 0.4 CD 5.3 ± 0.6 F 41.1 ± 8.3 ABC 496.8 ± 24.5 EF 5
Lorsban Advanced 16 oz + Steward EC, 11.3 oz 1.1 ± 0.2 CD 10.4 ± 2.2 BCDEF 32.7 ± 7.1 BC 506.0 ± 29.8 EF 3
Stallion 3EC, 11.75 oz 0.4 ± 0.1 D 8.2 ± 1.7 DEF 40.9 ± 7.8 ABC 510.4 ± 30.7 EF 2
Lorsban Advanced 24 oz + Warrior II, 1.92 oz 0.4 ± 0.2 D 9.5 ± 5.9 F 39.0 ± 7.7 ABC 513.4 ± 61.4 EF 2
Lorsban Advanced 24 oz + Steward EC, 6.7 oz 1.2 ± 0.3 CD 7.0 ± 1.2 EF 43.1 ± 5.6 ABC 516.0 ± 21.8 DEF 1
Cobalt Advanced, 24 oz 0.2 ± 0.1 D 7.6 ± 1.5 EF 46.7 ± 9.5 ABC 522.8 ± 34.3 DEF 0
Untreated control 4.6 ± 0.8 ABC 11.4 ± 2.5 BCDEF 27.6 ± 3.6 BC 523.3 ± 19.7 DEF —
Steward EC, 6.7 oz + Warrior II, 1.92 oz 0.4 ± 0.1 D 6.5 ± 1.1 EF 49.2 ± 7.5 AB 525.2 ± 24.5 DEF 0
Lorsban Advanced 24 oz 0.7 ± 0.2 CD 9.5 ± 1.8 CDEF 43.2 ± 6.2 ABC 528.7 ± 21.9 DEF ‐1
Mustang Maxx0.8EC, 4 oz + Steward, 6.7 oz 1.3 ± 0.2 CD 9.4 ± 2.2 CDEF 42.6 ± 8.2 ABC 530.1 ± 31.9 DEF ‐1
Mustang Maxx0.8EC, 4 oz 1.2 ± 0.4 CD 9.3 ± 2.8 DEF 46.3 ± 8.7 ABC 540.4 ± 41.4 DEF ‐3
Lorsban Advanced 24 oz + Steward EC, 11.3 oz 4.7 ± 4.1 BCD 7.0 ± 1.8 EF 44.7 ± 10.9 ABC 546.6 ± 70.2 DEF ‐5
Baythroid XL, 2.8 oz 3.5 ± 2.8 BCD 10.4 ± 2.4 BCDEF 51.9 ± 11.7 AB 581.4 ± 60.8 CDEF ‐11
Baythroid XL, 2.8 oz, early 9.6 ± 3.5 AB 16.3 ± 4.9 ABCDE 35.5 ± 5.3 ABC 616.0 ± 49.9 BCDE ‐18
Warrior II, 1.92 oz, early 11.3 ± 3.3 A 17.6 ± 2.7 ABC 37.9 ± 6.9 ABC 645.3 ± 38.9 ABCD ‐23
Steward EC, 11.3 oz 9.7 ± 2.0 A 17.8 ± 4.3 ABCD 42.5 ± 6.9 ABC 647.7 ± 52.7 ABCD ‐23
Steward EC, 11.3 oz, early 17.3 ± 4.1 A 22.3 ± 6.2 AB 28.8 ± 7.0 C 693.2 ± 42.7 ABC ‐32 Mustang Maxx0.8EC, 4 oz, early 14.5 ± 3.9 A 30.8 ± 7.8 A 32.4 ± 6.5 ABC 737.6 ± 73.8 AB ‐41 Cobalt Advanced, 19 oz, early 12.7 ± 4.1 A 31.5 ± 11.1 A 52.9 ± 4.4 A 790.8 ± 102.7 A ‐51 F value 14.46 11.25 3.11 10.55 — p>F 0.0000 0.0000 0.0001 0.0000 — 1 SE, standard error of the mean. Means in the same column followed by the same letter(s) are not statistically different, Tukey’s HSD (%=0.05). 2 Calculated by the method of Ruppel (Journal of Economic Entomology 76: 375‐7, 1983). The table is sorted by the means in this column.
CONTROL OF ALFALFA INSECTS IN ALFALFA WITH HAND‐APPLIED INSECTICIDES, FORT
COLLINS, FORT LUPTON, LONGMONT AND NIWOT, CO, 2016‐17
Frank Peairs, Darren Cockrell, Laura Newhard, Jeff Rudolph, Camden James, Bruce Gammonley,
and Elana Bernholtz, Department of Bioagricultural Sciences and Pest Management
CONTROL OF ALFALFA INSECTS IN ALFALFA WITH HAND‐APPLIED INSECTICIDES, FORT
COLLINS, FORT LUPTON, LONGMONT AND NIWOT CO, 2016‐17: Studies were established at
three on‐farm locations and ARDEC in 2016 and at two on‐farm locations and ARDEC in 2017.
These experiments were intended to assess variability in alfalfa weevil, Hypera postica
(Gyllenhal), treatment response at several locations and possibly confirm reports of insecticide
resistance in alfalfa weevil populations along the northern Front Range. Sites are summarized
in Table 4.
Treatments were applied in 2016 on 4 May and 12 May in 2017 using an ATV‐mounted sprayer
calibrated to deliver 12.3 gallons per acre at 5 mph and 32 psi through ten 8004 nozzles. Plots
were 15.0 ft by 30.0 ft and arranged in six replicates of a randomized, complete block design.
Treatments in 2016 were selected from three mode of action groups and included Lorsban
Advanced (Group 1B), Warrior II (Group 3), and Steward (Group 22). These, as well as a
combination of Lorsban Advanced and Warrior II, were tested in 2017. The combination
treatment was added because it is commonly used locally when control difficulties are
experienced.
Treatments were evaluated by taking ten 180
Nsweeps per plot with a standard 15 inch
diameter insect net 6 and 14 days after treatment (DAT) in 2016 and 6 and 12 DAT in 2017.
Alfalfa weevil larvae, alfalfa weevil adults and pea aphids, Acyrthosiphon pisum (Harris), were
counted. A pretreatment sample was taken on 4 May 2016 and on 12 May 2017 by taking 60,
180
Nsweeps across the experimental area. The pretreatment counts were used in the
calculation of total insect days using the method of Ruppel (J. Econ. Entomol. 76: 375‐377).
Alfalfa weevil counts from Lisco 1 and ARDEC in 2016 and ARDEC in 2017 were transformed by
the log +1 method to correct for nonadditivity. Pea aphid counts from Lisco 2, Johnston, and
ARDEC in 2016 and ARDEC in 2017 were transformed in the same manner. Transformed or
original post treatment counts were subjected to analysis of variance and mean separation by
Tukey’s Honestly Significant Difference procedure (α=0.05). Alfalfa weevil adult counts were
very low and, consequently, not analyzed. Original means are presented in Tables 5‐8.
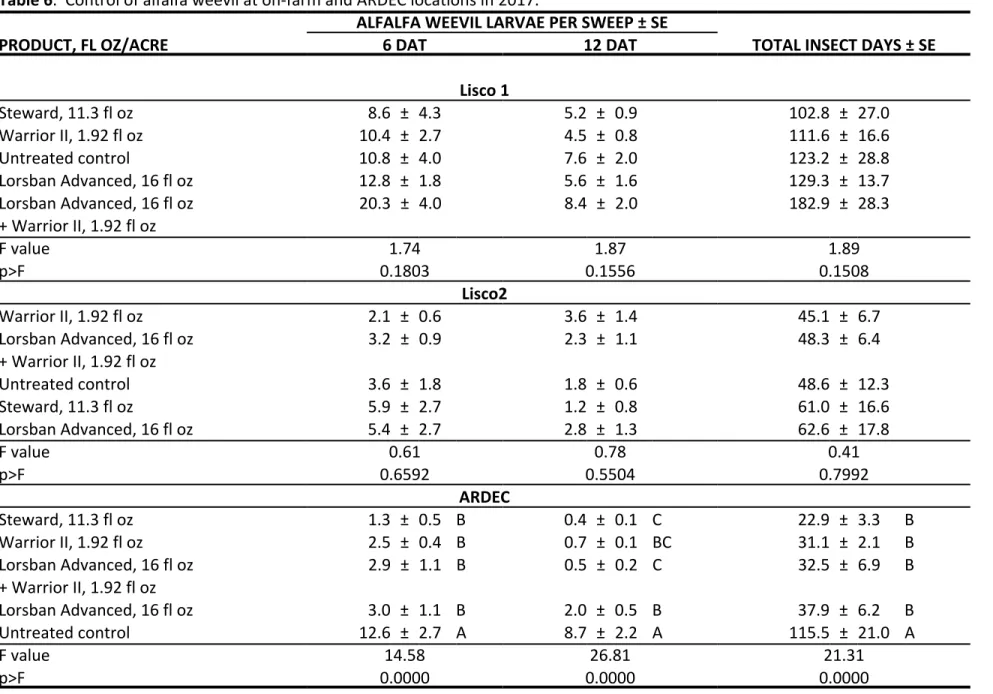
There was no treatment by location interaction for alfalfa weevil control in 2016 (F=1.55,
p>F=0.1447, df=9,75), indicating that treatments performed equally well at all four locations. In
2017, however, there was a treatment by location interaction (F=3.35, p>F=0.0027, df=8,70)
because treatments provided effective alfalfa weevil control only at the ARDEC location (Table
4). This indicates the possibility of insecticide resistant alfalfa weevil populations at the other
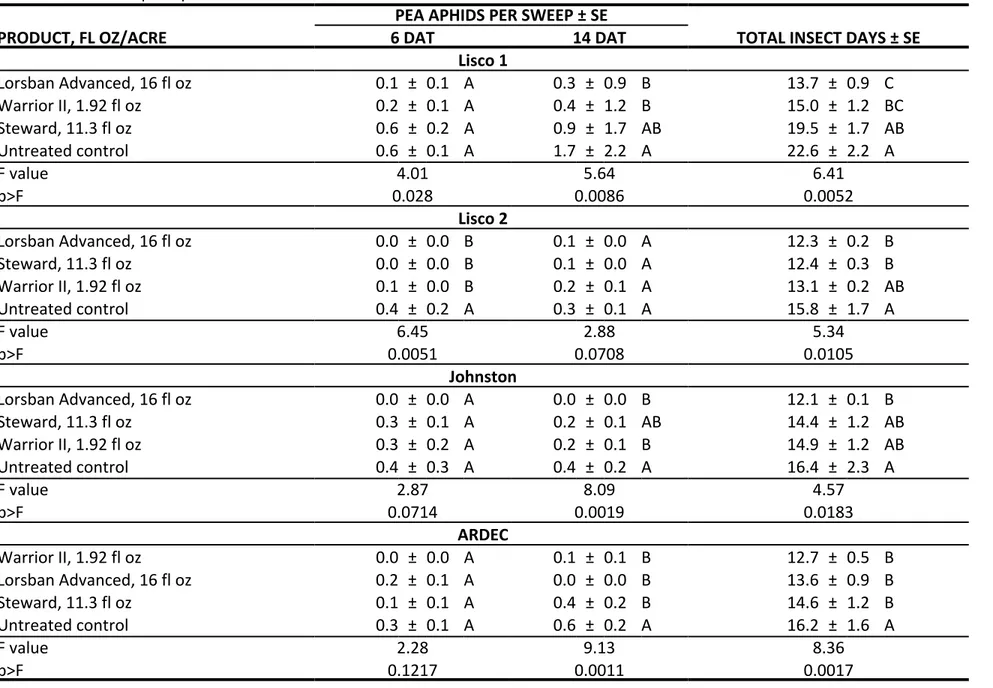
two locations. There were no treatment by location interactions for pea aphid in either year
(2016 F=1.47, p>F=0.1741, df=9,75 and 2017 F=0.79, p>F=0.6141, df=8,70).
Table 4. 2016 and 2017 alfalfa weevil control experiment locations.
Site name
Coordinates
Treatment date
Treatment conditions
Crop condition
2016
ARDEC
(Fort Collins)
N40.669086,
W104.999865
5 May 2016
Clear skies with 0‐5 mph SE
winds, and 70EF.
Established crop, patchy,
with weed problems
Johnston Farm
(Fort Lupton)
N40.074542,
W104.905142
4 May 2016
Clear skies with 0‐10 mph SE
winds, and 80EF.
Established crop, slightly
patchy stand
Lisco 1
(Longmont)
N40.125660,
W105.102786
4 May 2016
Clear skies with 0‐10 mph SW
winds, and 73EF.
Established crop, excellent
Lisco 2
(Longmont)
N40.116129,
W105.131107
4 May 2016
Clear skies with 0‐10 mph SW
winds, and 80EF.
Established crop, excellent
2017
ARDEC
(Fort Collins)
N40.665804,
W104.996544
12 May 2017
Clear skies with 0‐5 mph NE
winds, and 83EF.
Established crop, slightly
patchy stand, 6 inches in
height
Lisco 1
(Longmont)
N40.125094,
W105.103559
12 May 2017
Clear skies with 0‐5 mph NE
winds, and 82EF.
Established crop, uniform
stand, 6 inches in height
Lisco 2
(Longmont)
N40.115840,
W105.132162
12 May 2017
Clear skies with 0‐5 mph NE
winds, and 75EF.
Established crop, uniform
stand, 6 inches in height
Table 5. Control of alfalfa weevil at on‐farm and ARDEC locations in 2016.
ALFALFA WEEVIL LARVAE PER SWEEP ± SE
PRODUCT, FL OZ/ACRE
6 DAT
14 DAT
TOTAL INSECT DAYS ± SE
Lisco 1
Warrior II, 1.92 fl oz
1.3 ± 0.2
4.3 ± 0.7 BC
38.2 ± 2.7
B
Steward, 11.3 fl oz
2.9 ± 1.0
2.9 ± 0.6 C
43.8 ± 8.0
B
Lorsban Advanced, 16 fl oz
3.2 ± 0.7
7.3 ± 1.1 B
63.7 ± 7.0
AB
Untreated control
6.5 ± 1.9
17.5 ± 2.7 A
127.0 ± 22.4
A
F value
2.29
20.02
10.23
p>F
0.1198
0.0000
0.0006
Lisco 2
Steward, 11.3 fl oz
1.1 ± 0.3
0.7 ± 0.1 C
22.3 ± 2.0
B
Warrior II, 1.92 fl oz
1.1 ± 0.4
3.1 ± 1.2 BC
32.3 ± 7.8
B
Lorsban Advanced, 16 fl oz
1.1 ± 0.3
3.3 ± 0.4 B
32.9 ± 2.5
B
Untreated control
2.2 ± 0.4
10.7 ± 0.6 A
69.9 ± 4.2
A
F value
2.24
46.2
20.88
p>F
0.1260
0.0000
0.0000
Johnston
Steward, 11.3 fl oz
0.4 ± 0.1
B
0.3 ± 0.1 B
16.3 ± 0.8
B
Lorsban Advanced, 16 fl oz
0.7 ± 0.1
B
0.9 ± 0.3 AB
20.2 ± 0.8
B
Warrior II, 1.92 fl oz
0.9 ± 0.4
B
0.8 ± 0.3 B
21.8 ± 3.1
B
Untreated control
2.2 ± 0.4
A
2.3 ± 0.6 A
36.1 ± 3.3
A
F value
7.35
5.89
0.0024
11.97
0.0003
p>F
0.0030
ARDEC
Steward, 11.3 fl
0.0 ± 0.0
B
0.3 ± 0.1 B
13.4 ± 0.4
B
Lorsban Advanced, 16 fl oz
0.1 ± 0.1
B
0.4 ± 0.1 B
14.3 ± 0.4
B
Warrior II, 1.92 fl oz
0.1 ± 0.0
B
1.0 ± 0.5 B
16.9 ± 2.1
B
Untreated control
1.2 ± 0.3
A
4.0 ± 0.9 A
36.6 ± 4.8
A
F value
24.58
19.36
32.36
p>F
0.0000
0.0000
0.0000
Table 6. Control of alfalfa weevil at on‐farm and ARDEC locations in 2017.
ALFALFA WEEVIL LARVAE PER SWEEP ± SE
PRODUCT, FL OZ/ACRE
6 DAT
12 DAT
TOTAL INSECT DAYS ± SE
Lisco 1
Steward, 11.3 fl oz
8.6 ± 4.3
5.2 ± 0.9
102.8 ± 27.0
Warrior II, 1.92 fl oz
10.4 ± 2.7
4.5 ± 0.8
111.6 ± 16.6
Untreated control
10.8 ± 4.0
7.6 ± 2.0
123.2 ± 28.8
Lorsban Advanced, 16 fl oz
12.8 ± 1.8
5.6 ± 1.6
129.3 ± 13.7
Lorsban Advanced, 16 fl oz
+ Warrior II, 1.92 fl oz
20.3 ± 4.0
8.4 ± 2.0
182.9 ± 28.3
F value
1.74
1.87
1.89
p>F
0.1803
0.1556
0.1508
Lisco2
Warrior II, 1.92 fl oz
2.1 ± 0.6
3.6 ± 1.4
45.1 ± 6.7
Lorsban Advanced, 16 fl oz
+ Warrior II, 1.92 fl oz
3.2 ± 0.9
2.3 ± 1.1
48.3 ± 6.4
Untreated control
3.6 ± 1.8
1.8 ± 0.6
48.6 ± 12.3
Steward, 11.3 fl oz
5.9 ± 2.7
1.2 ± 0.8
61.0 ± 16.6
Lorsban Advanced, 16 fl oz
5.4 ± 2.7
2.8 ± 1.3
62.6 ± 17.8
F value
0.61
0.78
0.41
p>F
0.6592
0.5504
0.7992
ARDEC
Steward, 11.3 fl oz
1.3 ± 0.5 B
0.4 ± 0.1 C
22.9 ± 3.3
B
Warrior II, 1.92 fl oz
2.5 ± 0.4 B
0.7 ± 0.1 BC
31.1 ± 2.1
B
Lorsban Advanced, 16 fl oz
+ Warrior II, 1.92 fl oz
2.9 ± 1.1 B
0.5 ± 0.2 C
32.5 ± 6.9
B
Lorsban Advanced, 16 fl oz
3.0 ± 1.1 B
2.0 ± 0.5 B
37.9 ± 6.2
B
Untreated control
12.6 ± 2.7 A
8.7 ± 2.2 A
115.5 ± 21.0 A
F value
14.58
26.81
21.31
p>F
0.0000
0.0000
0.0000
Table 7. Control of pea aphid at on‐farm and ARDEC locations in 2016.
PEA APHIDS PER SWEEP ± SE
PRODUCT, FL OZ/ACRE
6 DAT
14 DAT
TOTAL INSECT DAYS ± SE
Lisco 1
Lorsban Advanced, 16 fl oz
0.1 ± 0.1 A
0.3 ± 0.9 B
13.7 ± 0.9 C
Warrior II, 1.92 fl oz
0.2 ± 0.1 A
0.4 ± 1.2 B
15.0 ± 1.2 BC
Steward, 11.3 fl oz
0.6 ± 0.2 A
0.9 ± 1.7 AB
19.5 ± 1.7 AB
Untreated control
0.6 ± 0.1 A
1.7 ± 2.2 A
22.6 ± 2.2 A
F value
4.01
5.64
6.41
p>F
0.028
0.0086
0.0052
Lisco 2
Lorsban Advanced, 16 fl oz
0.0 ± 0.0 B
0.1 ± 0.0 A
12.3 ± 0.2 B
Steward, 11.3 fl oz
0.0 ± 0.0 B
0.1 ± 0.0 A
12.4 ± 0.3 B
Warrior II, 1.92 fl oz
0.1 ± 0.0 B
0.2 ± 0.1 A
13.1 ± 0.2 AB
Untreated control
0.4 ± 0.2 A
0.3 ± 0.1 A
15.8 ± 1.7 A
F value
6.45
2.88
5.34
p>F
0.0051
0.0708
0.0105
Johnston
Lorsban Advanced, 16 fl oz
0.0 ± 0.0 A
0.0 ± 0.0 B
12.1 ± 0.1 B
Steward, 11.3 fl oz
0.3 ± 0.1 A
0.2 ± 0.1 AB
14.4 ± 1.2 AB
Warrior II, 1.92 fl oz
0.3 ± 0.2 A
0.2 ± 0.1 B
14.9 ± 1.2 AB
Untreated control
0.4 ± 0.3 A
0.4 ± 0.2 A
16.4 ± 2.3 A
F value
2.87
8.09
4.57
p>F
0.0714
0.0019
0.0183
ARDEC
Warrior II, 1.92 fl oz
0.0 ± 0.0 A
0.1 ± 0.1 B
12.7 ± 0.5 B
Lorsban Advanced, 16 fl oz
0.2 ± 0.1 A
0.0 ± 0.0 B
13.6 ± 0.9 B
Steward, 11.3 fl oz
0.1 ± 0.1 A
0.4 ± 0.2 B
14.6 ± 1.2 B
Untreated control
0.3 ± 0.1 A
0.6 ± 0.2 A
16.2 ± 1.6 A
F value
2.28
9.13
8.36
p>F
0.1217
0.0011
0.0017
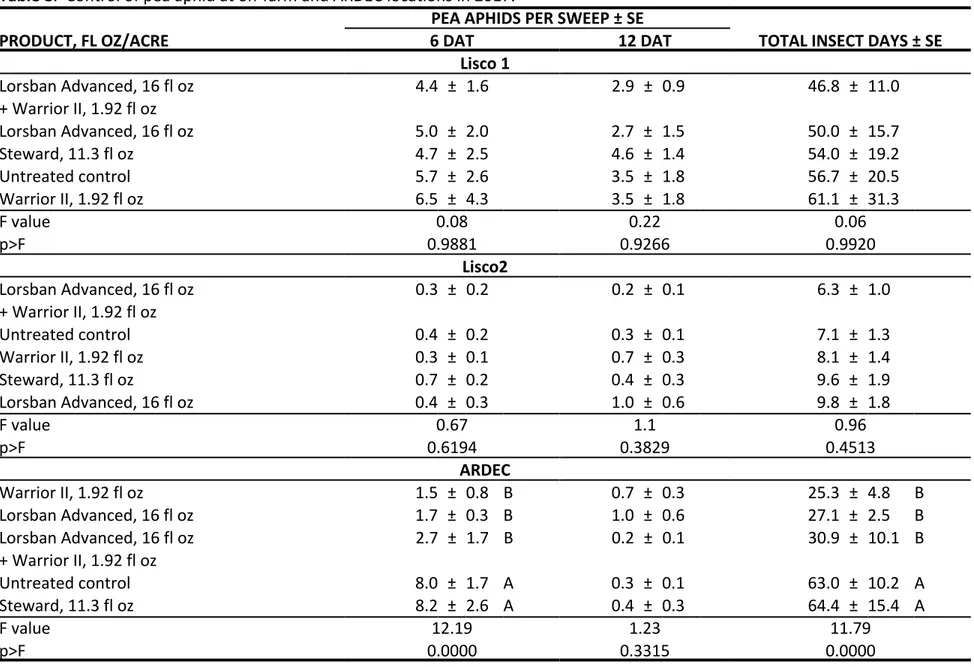
Table 8. Control of pea aphid at on‐farm and ARDEC locations in 2017.
PEA APHIDS PER SWEEP ± SE
PRODUCT, FL OZ/ACRE
6 DAT
12 DAT
TOTAL INSECT DAYS ± SE
Lisco 1
Lorsban Advanced, 16 fl oz
+ Warrior II, 1.92 fl oz
4.4 ± 1.6
2.9 ± 0.9
46.8 ± 11.0
Lorsban Advanced, 16 fl oz
5.0 ± 2.0
2.7 ± 1.5
50.0 ± 15.7
Steward, 11.3 fl oz
4.7 ± 2.5
4.6 ± 1.4
54.0 ± 19.2
Untreated control
5.7 ± 2.6
3.5 ± 1.8
56.7 ± 20.5
Warrior II, 1.92 fl oz
6.5 ± 4.3
3.5 ± 1.8
61.1 ± 31.3
F value
0.08
0.22
0.06
p>F
0.9881
0.9266
0.9920
Lisco2
Lorsban Advanced, 16 fl oz
+ Warrior II, 1.92 fl oz
0.3 ± 0.2
0.2 ± 0.1
6.3 ± 1.0
Untreated control
0.4 ± 0.2
0.3 ± 0.1
7.1 ± 1.3
Warrior II, 1.92 fl oz
0.3 ± 0.1
0.7 ± 0.3
8.1 ± 1.4
Steward, 11.3 fl oz
0.7 ± 0.2
0.4 ± 0.3
9.6 ± 1.9
Lorsban Advanced, 16 fl oz
0.4 ± 0.3
1.0 ± 0.6
9.8 ± 1.8
F value
0.67
1.1
0.96
p>F
0.6194
0.3829
0.4513
ARDEC
Warrior II, 1.92 fl oz
1.5 ± 0.8 B
0.7 ± 0.3
25.3 ± 4.8
B
Lorsban Advanced, 16 fl oz
1.7 ± 0.3 B
1.0 ± 0.6
27.1 ± 2.5
B
Lorsban Advanced, 16 fl oz
+ Warrior II, 1.92 fl oz
2.7 ± 1.7 B
0.2 ± 0.1
30.9 ± 10.1 B
Untreated control
8.0 ± 1.7 A
0.3 ± 0.1
63.0 ± 10.2 A
Steward, 11.3 fl oz
8.2 ± 2.6 A
0.4 ± 0.3
64.4 ± 15.4 A
F value
12.19
1.23
11.79
p>F
0.0000
0.3315
0.0000
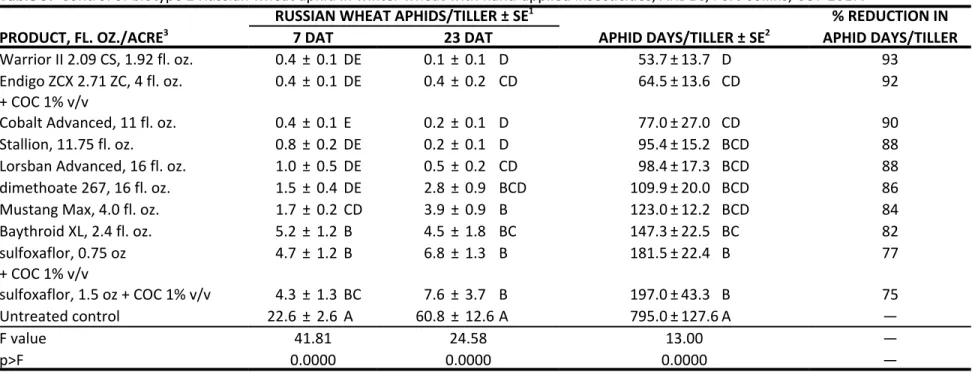
CONTROL OF BIOTYPE 2 RUSSIAN WHEAT APHID IN WINTER WHEAT WITH HAND‐APPLIED INSECTICIDES, ARDEC, FORT COLLINS, CO, 2017 Frank Peairs, Darren Cockrell, Laura Newhard, Jeff Rudolph, Camden James, and Elana Bernholtz, Department of Bioagricultural Sciences and Pest Management CONTROL OF RUSSIAN WHEAT APHID IN WINTER WHEAT WITH HAND‐APPLIED INSECTICIDES, ARDEC, FORT COLLINS, CO, 2017: Treatments were applied on 19 April 2017 with a 'rickshaw‐type' CO2 powered sprayer calibrated to apply 20 gal/acre at 3 mph and 32 psi through three 8002 (LF2) nozzles mounted on a 5.0 ft boom. Conditions at the time of treatment were cloudy and 62EF with 0‐5 mph winds from the north. Plots were 6 rows (5.0 ft) by 25.0 ft and were arranged in six replicates of a randomized, complete block design. Wheat growth stage at application was jointing (Zadoks 32). The wheat had been infested with greenhouse‐reared aphids on 20 February 2017. Treatments were evaluated for Russian wheat aphid control by collecting 20 symptomatic tillers along the middle four rows of each plot 7 and 23 days after treatment (DAT). Tiller samples were placed in Berlese funnels for 24 hours to extract aphids into alcohol for counting. Symptomatic tiller samples taken the day of treatment averaged 19.3 Russian wheat aphids per tiller. Aphid and counts were transformed by the log + 1 method to correct for nonadditivity, and transformed counts were used for analysis of variance and mean separation by Tukey’s Honestly Significant Difference test (α=0.05). Original means are presented in Table 9. Total aphid days per tiller were calculated according the method of Ruppel (Journal of Economic Entomology 76: 375‐7, 1983), transformed by the log + 1 method, and analyzed in the same manner, with original means presented in Table 1. Aphid abundance was higher in 2017 than in 2016, with approximately 60.8 aphids per tiller in the untreated control 23 DAT (Table 9) compared to 29.9 aphids per tiller 25 DAT in 2016. Crop condition was very good. All treatments had fewer aphid days than the untreated control. The Warrior II 2.09
CS, 1.92 fl. oz., Endigo ZCX 2.71 ZC, 4 fl. oz., and Cobalt Advanced, 11 fl. oz. treatments reduced
aphid days per tiller by 90% or more, the level of performance observed by the more effective treatments in past experiments. Field History Pest: Russian wheat aphid, Diuraphis noxia (Kurdjumov) Cultivar: 'Byrd' Planting Date: 30 September 2016 Irrigation: Pre‐plant irrigation with linear move sprinkler Crop History: Fallow in 2016 crop year, no tillage Herbicide: Touchdown 10 fl oz and 2,4‐D LV4 5 fl oz/acre on 9 June 2016, Roundup Power Max 32 fl oz/acre on 10 Aug 2016 Insecticide: None prior to experiment Fertilization: 13 fl oz/acre 28‐0‐0‐5S on 11 April 2017 Soil Type: Sandy clay loam Location: ARDEC, 4616 North Frontage Road, Fort Collins, CO 80524, Field 1030S, N40.653, W104.998Table 9. Control of biotype 2 Russian wheat aphid in winter wheat with hand‐applied insecticides, ARDEC, Fort Collins, CO. 2017.
RUSSIAN WHEAT APHIDS/TILLER ± SE1 % REDUCTION IN
PRODUCT, FL. OZ./ACRE3 7 DAT 23 DAT APHID DAYS/TILLER ± SE2 APHID DAYS/TILLER
Warrior II 2.09 CS, 1.92 fl. oz. 0.4 ± 0.1 DE 0.1 ± 0.1 D 53.7 ± 13.7 D 93 Endigo ZCX 2.71 ZC, 4 fl. oz. + COC 1% v/v 0.4 ± 0.1 DE 0.4 ± 0.2 CD 64.5 ± 13.6 CD 92 Cobalt Advanced, 11 fl. oz. 0.4 ± 0.1 E 0.2 ± 0.1 D 77.0 ± 27.0 CD 90 Stallion, 11.75 fl. oz. 0.8 ± 0.2 DE 0.2 ± 0.1 D 95.4 ± 15.2 BCD 88 Lorsban Advanced, 16 fl. oz. 1.0 ± 0.5 DE 0.5 ± 0.2 CD 98.4 ± 17.3 BCD 88 dimethoate 267, 16 fl. oz. 1.5 ± 0.4 DE 2.8 ± 0.9 BCD 109.9 ± 20.0 BCD 86 Mustang Max, 4.0 fl. oz. 1.7 ± 0.2 CD 3.9 ± 0.9 B 123.0 ± 12.2 BCD 84 Baythroid XL, 2.4 fl. oz. 5.2 ± 1.2 B 4.5 ± 1.8 BC 147.3 ± 22.5 BC 82 sulfoxaflor, 0.75 oz + COC 1% v/v 4.7 ± 1.2 B 6.8 ± 1.3 B 181.5 ± 22.4 B 77 sulfoxaflor, 1.5 oz + COC 1% v/v 4.3 ± 1.3 BC 7.6 ± 3.7 B 197.0 ± 43.3 B 75 Untreated control 22.6 ± 2.6 A 60.8 ± 12.6 A 795.0 ± 127.6 A — F value 41.81 24.58 13.00 — p>F 0.0000 0.0000 0.0000 — 1SE=standard error of the mean, DAT=days after treatment, Means in the same column followed by the same letter(s) are not statistically different, Tukey’s HSD (%=0.05). 2Calculated by the method of Ruppel (Journal of Economic Entomology 76: 375‐7, 1983). The table is sorted by the means in this column. 3 COC=crop oil concentrate.
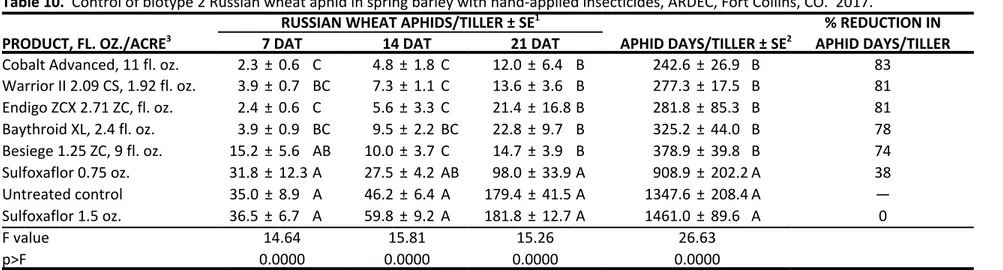
CONTROL OF BIOTYPE 2 RUSSIAN WHEAT APHID IN SPRING MALT BARLEY WITH HAND‐APPLIED INSECTICIDES, ARDEC, FORT COLLINS, CO, 2017 Frank Peairs, Darren Cockrell, Jeff Rudolph, Laura Newhard, Camden James, Elana Bernholtz, Bruce Gammonley, and Erika Peirce, Department of Bioagricultural Sciences and Pest Management CONTROL OF RUSSIAN WHEAT APHID IN SPRING MALT BARLEY WITH HAND‐APPLIED INSECTICIDES, ARDEC, FORT COLLINS, CO, 2017: Treatments were applied on 16 May 2017 with a 'rickshaw‐type' CO2 powered sprayer calibrated to apply 20 gal/acre at 3 mph and 32 psi through three 8002 (LF2) nozzles mounted on a 5.0 ft boom. All treatments except Cobalt Advanced, 11 fl. oz., included crop oil concentrate 1% v/v. Conditions at the time of treatment were clear, 70EF and winds 0‐5 mph from the southwest. Plots were 6 rows (5.0 ft) by 25.0 ft and were arranged in six replicates of a randomized, complete block design. The barley had three unfolded leaves at the time of application (Zadoks 13). The barley had been infested with greenhouse‐reared aphids on 17 April 2017. Treatments were evaluated for Russian wheat aphid control by collecting 20 symptomatic tillers along the middle four rows of each plot 7, 14 and 21 days after treatment (DAT). Tiller samples were placed in Berlese funnels for 24 hours to extract aphids into alcohol for counting. Symptomatic tiller samples taken the day of treatment averaged 43.2 Russian wheat aphids per tiller. Aphid and counts were transformed by the log +1 method to correct for nonadditivity, and transformed counts were used for analysis of variance and mean separation by Tukey’s Honestly Significant Difference test (α=0.05). Original means are presented in Table 10. Total aphid days per tiller were calculated according the method of Ruppel (Journal of Economic Entomology 76: 375‐7, 1983), transformed by the log + 1 method prior to analysis, with original means presented in Table 10. Aphid abundance was much greater in 2017 than was observed in 2016, with approximately 179.2 aphids per tiller in the untreated control 21 DAT (Table 10) compared to 8.7 aphids per tiller 21 DAT in 2016. Crop condition was very good. All treatments, except those containing sulfoxaflor, had fewer aphid days than the untreated control. No treatment reduced aphid days per tiller at three weeks by 90% or more, the level of performance observed by the more effective treatments in past experiments. Field History Pest: Russian wheat aphid, Diuraphis noxia (Kurdjumov) Cultivar: Moravian 69 Planting Date: 21 Feb 2017 Irrigation: Overhead linear, no water applied. Crop History: Canola in 2016 Herbicide:
Huskie 13.0 fl oz/acre, AccuQuest WM 12.8 fl oz/acre, AD‐MAX 90 4.4 fl oz/acre
on 11 May 2017 Insecticide: None prior to experiment Fertilization: None Soil Type: Sandy clay loam Location: ARDEC, 4616 North Frontage Road, Fort Collins, CO 80524, Field 1060, N40.655733, W104.998294Table 10. Control of biotype 2 Russian wheat aphid in spring barley with hand‐applied insecticides, ARDEC, Fort Collins, CO. 2017.
RUSSIAN WHEAT APHIDS/TILLER ± SE1 % REDUCTION IN
PRODUCT, FL. OZ./ACRE3 7 DAT 14 DAT 21 DAT APHID DAYS/TILLER ± SE2 APHID DAYS/TILLER
Cobalt Advanced, 11 fl. oz. 2.3 ± 0.6 C 4.8 ± 1.8 C 12.0 ± 6.4 B 242.6 ± 26.9 B 83 Warrior II 2.09 CS, 1.92 fl. oz. 3.9 ± 0.7 BC 7.3 ± 1.1 C 13.6 ± 3.6 B 277.3 ± 17.5 B 81 Endigo ZCX 2.71 ZC, fl. oz. 2.4 ± 0.6 C 5.6 ± 3.3 C 21.4 ± 16.8 B 281.8 ± 85.3 B 81 Baythroid XL, 2.4 fl. oz. 3.9 ± 0.9 BC 9.5 ± 2.2 BC 22.8 ± 9.7 B 325.2 ± 44.0 B 78 Besiege 1.25 ZC, 9 fl. oz. 15.2 ± 5.6 AB 10.0 ± 3.7 C 14.7 ± 3.9 B 378.9 ± 39.8 B 74 Sulfoxaflor 0.75 oz. 31.8 ± 12.3 A 27.5 ± 4.2 AB 98.0 ± 33.9 A 908.9 ± 202.2 A 38 Untreated control 35.0 ± 8.9 A 46.2 ± 6.4 A 179.4 ± 41.5 A 1347.6 ± 208.4 A — Sulfoxaflor 1.5 oz. 36.5 ± 6.7 A 59.8 ± 9.2 A 181.8 ± 12.7 A 1461.0 ± 89.6 A 0 F value 14.64 15.81 15.26 26.63 p>F 0.0000 0.0000 0.0000 0.0000 1 SE=standard error of the mean, DAT=days after treatment, Means in the same column followed by the same letter(s) are not statistically different, Tukey’s HSD (%=0.05). 2 Calculated by the method of Ruppel (Journal of Economic Entomology 76: 375‐7, 1983). The table is sorted by the means in this column. 3 All treatments except Cobalt Advanced, 11 fl. oz., included crop oil concentrate 1% v/v.
CONTROL OF WESTERN CORN ROOTWORM IN FIELD CORN WITH PLANTING‐TIME SOIL
INSECTICIDES, SEED TREATMENTS, AND PLANT‐INCORPORATED PROTECTANTS, WINDSOR,
CO, 2017
Jeff Rudolph, Laura Newhard, Darren Cockrell, Camden James, Bruce Gammonley, Erika Peirce, Elana Bernholtz, and Frank Peairs, Department of Bioagricultural Sciences and Pest Management. CONTROL OF WESTERN CORN ROOTWORM IN FIELD CORN WITH PLANTING‐TIME SOIL INSECTICIDES, SEED TREATMENTS, AND PLANT‐INCORPORATED PROTECTANTS, WINDSOR, CO, 2017: All treatments except those located in the last 12 rows were planted on 17 May 2017. The remaining rows were planted on 1 June, due to two inches of rainfall on 18 May. Granular insecticides were applied with modified Wintersteiger meters mounted on a two‐row John Deere Maxi‐Merge planter. T‐band granular applications were applied with a 4‐inch John Deere spreader located between the disk openers and the press wheel. Liquid applications were applied using a CO2 powered sprayer using micro tubing calibrated to deliver a stream at five gpa. Three trials were planted. The first trial compared several plant‐ incorporated protectants with granular and liquid insecticides. The second trial compared several granular and liquid insecticides. The third trial compared the performance of a liquid and a granular insecticide when combined with several plant‐incorporated protectants. Plots in the first trial were one 25‐ft row arranged in six replicates of a randomized complete block design. Plots in the other trials were four 25‐ft rows arranged in four replicates of a randomized complete block design. Treatments were evaluated on 12 July 2017 by digging three roots per plot in the first and four roots per plot in the others. The roots were washed and the damage rated on the 0‐3 node injury scale (http://www.ent.iastate.edu/pest/rootworm/nodeinjury/nodeinjury.html). Plot means were compared by Tukey’s Honestly Significant Difference method (α=0.05). Treatment efficiency was determined as the percentage of total plants per treatment having a root rating of 0.25 or lower. Grain yields were determined in the second and third trials by harvesting the center two rows with a small plot combine. Yields were low and variable and, thus, were not analyzed. Results are presented in Tables 11‐13. Western corn rootworm damage was low in the first trial, ranging from 0.01 to 0.26 on the 0‐3 node injury scale. Western corn rootworm damage was low in the second trial, ranging from 0.08 to 0.20 on the 0‐3 node injury scale. No treatment was less damaged than the untreated control in either the first or second trial. Western corn rootworm damage was heavy in Trial 3, ranging from 0.00 to 1.36 on the 0‐3 node injury scale, and all treatments were less damaged than the untreated control. No phytotoxicity was observed with any treatment. Field History Pest: Western corn rootworm, Diabrotica virgifera virgifera LeConte Cultivar: DKC45‐64, unless otherwise indicated Planting Date: 17 May and 1 June 2017 Plant Population: 18,000 Irrigation: Furrow irrigated Crop History: Corn in 2016 Insecticide: None prior to experiment Soil Type: Sandy loam Location: Windsor, CO near intersection of WCR 25 and WCR 70, (N40.494098, W104.826966)Table 11. Control of western corn rootworm with plant‐incorporated protectants, soil applied granular
insecticides, and soil applied liquid insecticides, Windsor, CO 2017.
TREATMENT AND/OR EVENT IOWA 0‐3 ROOT RATING1 EFFICIENCY2
Cry34/35 90/10 Blend 0.01 B 0 Counter 15G, 8 oz 0.04 AB 6 Cry34/35+mCry3A 95/5 Blend 0.04 AB 11 Cry34/35+Cry3Bb1 95/5 Blend 0.04 AB 11 mCry3A 0.06 AB 6 SmartChoice 5G, 5 oz 0.08 AB 11 Lorsban 15G, 8 oz 0.10 AB 28 Force CS, 0.46 oz 0.12 AB 22 Aztec 2.1G, 6.7 oz 0.13 AB 28 DKC45‐64 (untreated control) 0.24 AB 28 Capture LFR, 0.49 fl oz 0.26 A 44 F value 2.72 — p>F 0.0095 — 1 Means in the same column followed by the same letters(s) are not statistically different, Tukey’s HSD (%=0.05). The table is sorted by root rating. 2 % total plants (18) per treatment having a root rating of 0.25 or lower. Table 12. Control of western corn rootworm with soil applied granular and liquid insecticides, Windsor, CO 2017.
TREATMENT AND/OR EVENT IOWA 0‐3 ROOT RATING1 EFFICIENCY2 GRAIN YIELD (Bu/Ac)
Aztec HC 9.34G, 1.5 oz in‐furrow 0.08 75 62.3 SmartChoice HC 15G, 1.7 oz in‐furrow 0.10 70 68.7 Force CS, 0.50 fl oz in‐furrow 0.11 90 60.2 Untreated control 0.11 80 66.4 Force 10G, 1.3 oz in‐furrow 0.12 80 72.8 Capture LFR, 0.98 fl oz in‐furrow 0.14 80 56.1 AMV1118 2.80CS, 0.72 fl oz in‐furrow 0.20 80 62.8 F value 0.39 — p>F 0.8759 — 1The table is sorted by root rating. 2 % total plants (20) per treatment having a root rating of 0.25 or lower.
Table 13. Control of western corn rootworm with combinations of plant‐incorporated protectants and a
soil applied granular insecticides or a soil applied liquid insecticide, Windsor, CO 2017.
TREATMENT AND/OR EVENT IOWA 0‐3 ROOT RATING1 EFFICIENCY2 GRAIN YIELD (Bu/Ac)
Cry34/35 90/10 Blend (Untreated) 0.00 B 95 75.0 Cry34/35 90/10 Blend + AMV1118 2.80CS, 0.72 fl oz in‐furrow 0.00 B 100 78.6 Cry34/35 90/10 Blend + Aztec HC 9.34G, 1.5 oz in‐furrow 0.00 B 100 93.4 Cry34/35+mCry3A 95/5 Blend + AMV1118 2.80CS, 0.72 fl oz in‐ furrow 0.00 B 100 74.0 Cry34/35+mCry3A 95/5 Blend + Aztec HC 9.34G, 1.5 oz in‐furrow 0.00 B 100 82.4 Cry34/35+Cry3Bb1 95/5 Blend + AMV1118 2.80CS, 0.72 fl oz in‐ furrow 0.00 B 100 85.4 Cry34/35+Cry3Bb1 95/5 Blend + Aztec HC 9.34G, 1.5 oz in‐furrow 0.00 B 100 82.2 Cry34/35+mCry3A 95/5 Blend (Untreated) 0.02 B 100 76.4 Cry34/35+Cry3Bb1 95/5 Blend (Untreated) 0.02 B 95 76.5 No event + AMV1118 2.80CS, 0.72 fl oz in‐furrow 0.04 B 95 78.3 No event + Aztec HC 9.34G, 1.5 oz in‐furrow 0.30 B 90 78.8 No event (untreated) 1.36 A 45 82.6 F value 17.83 — p>F 0.0000 — 1 Means in the same column followed by the same letters(s) are not statistically different, Tukey’s HSD (%=0.05). The table is sorted by root rating. 2% total plants (20) per treatment having a root rating of 0.25 or lower.
CONTROL OF SPIDER MITES IN CORN WITH HAND‐APPLIED INSECTICIDES AND MITICIDES, ARDEC, FORT COLLINS, CO, 2017 Frank Peairs, Jeff Rudolph, Darren Cockrell, Laura Newhard, Camden James, Bruce Gummonley, Sam Wheeler, and Elana Berholtz, Department of Bioagricultural Sciences and Pest Management CONTROL OF SPIDER MITES IN CORN WITH HAND‐APPLIED INSECTICIDES AND MITICIDES, ARDEC, FORT COLLINS, CO, 2017: Early treatments were applied on 27 July 2017 using a two row boom sprayer mounted on a backpack calibrated to deliver 17.8 gal/acre at 32 psi with five XR8002VS nozzles on a five ft boom held at canopy height. All other treatments were applied in the same manner on 10 August 2017. Because of the large number of treatments and because of the need to test several
treatments separately, the experiment was divided into one experiment of 20 treatments and
two of 10 treatments each. Three treatments were common to the three experiments for
comparison purposes. Conditions were calm and 65EF at the time of early treatments. The
experiments received 0.04 inches of rain 24 h after treatment. Conditions were 0‐5 mph winds and 65E F at the time of late treatments. Early treatments were applied at early pollination and late treatments were applied at early grain fill. All treatments, except the untreated control, were applied with Dyne‐Amic 0.25% v/v. Plots were 25 ft by two rows (30 inch centers) and were arranged in six replicates of a randomized complete block design. Plots were separated from neighboring plots by a single buffer row. Plots were infested on 2 July 2017 by laying mite infested corn leaves, collected earlier that day in Mesa County, CO, across the corn plants on which mites were to be counted. On 8 July 2017, the experimental area was treated with permethrin 3.2E, 8 fl oz/acre, to control beneficial insects and promote spider mite abundance. Treatments were evaluated by collecting three leaves (ear leaf, 2nd leaf above the ear, 2nd leaf below the ear) from two plants per plot ‐1, 7, 14, 21 days after the early treatments (DAT). Corn leaves were placed in Berlese funnels for 48 hours to extract mites into alcohol for counting. Grain yields in the three trials were estimated for the Onager 1E, 16 fl oz, early, and the untreated control treatments by harvesting the ears from 0.001 acre per plot, drying and shelling the ears, weighing the dried grain, and converting yields to lbs/ac at 15.5% moisture. Results from the three trials were combined and subjected to analysis of variance. Mite counts were transformed by the log + 1 method to address nonadditivity issues. Total mite days were calculated by the method of Ruppel (J. Econ. Entomol. 76: 375‐377) and transformed by the same method. Transformed counts and total mite days were subjected to analysis of variance and mean separation, if appropriate, by Tukey's Honestly Significant Difference method (%=0.05), with original means presented in Tables 14‐16. Mite abundance was much lower in 2017 than was observed in 2016, with total mite days in the untreated control averaging 20 and 1026 in 2017 and 2016, respectively. In Parts 1 and 3, there were no differences among treatments. In Part 2, KFD‐217‐01 480 g/L SC, 16 fl oz, KFD‐217‐01 480 g/L SC, 24 fl oz, Zeal 2.88 SC 6 fl oz, KFD‐272‐01 2 SC, 7 fl oz, Zeal 2.88 SC 3 fl oz, KFD‐326‐01 1 EW, 12 fl oz, Zeal 2.88 SC4 fl oz, and KFD‐286‐01, 42 fl oz, all applied early, had fewer mite days than the untreated control. Yields for Onager 1E, 16 fl oz, early, and the untreated control treatments did not differ (df=1,34, F=0.05 and p>F=0.8247) and were 6,556 and 6,449 lbs/acre, respectively. No phytotoxicity was observed.Field History: Pest: Banks grass mite, Oligonychus pratensis (Banks) Cultivar: Dekalb DKC45‐64 Planting Date: 8 May 2017 Plant Population: 34,000 Irrigation: Linear move sprinkler Crop History: Fallow in 2016 Herbicide: 30 May 2017, Roundup PowerMAX, 32 fl oz + AccuQuest WM, 10 fl oz + AD‐MAX 90, 4.4 fl oz + Sterling Blue, 6 fl oz
8 July 2017, Roundup PowerMax, 18 fl oz
Fertilization:
200 lb N, 80 lb P, 14 lb S, 5 lb Zn/acre on 5 April 2017Soil Type:
Clay loam
Location:
ARDEC, 4616 North Frontage Road, Fort Collins, CO 80524, Field 1040,
N40.65345, W104.9972
Table 14. Control of spider mites in field corn with hand‐applied miticides ‐ Part 1, ARDEC, Fort Collins, CO, 2017. MITES PER LEAF ± SE1
PRODUCT, FL OZ/ACRE* ‐1 DAT 7 DAT 14 DAT 21 DAT TOTAL MITE DAYS ± SE2
GWN‐10194 1EC, 18 fl oz, + GWN‐10598, 5.0 fl oz, early 0.2 ± 0.1 0.0 ± 0.0 0.1 ± 0.1 0.2 ± 0.1 2.4 ± 1.2 Onager 1E, 18 fl oz, + GWN‐10598, 5.0 fl oz** 0.2 ± 0.1 0.3 ± 0.2 0.0 ± 0.0 0.1 ± 0.1 3.2 ± 1.7 Onager 1 EC, 18 fl oz 0.5 ± 0.2 0.2 ± 0.1 0.1 ± 0.0 0.0 ± 0.0 3.2 ± 1.3 Onager 1E, 16 fl oz + Dimethoate 4E, 16 fl oz 0.2 ± 0.1 0.1 ± 0.1 0.2 ± 0.2 0.0 ± 0.0 3.3 ± 1.4 GWN‐10194 1 EC, 14 fl oz** 0.3 ± 0.1 0.1 ± 0.1 0.1 ± 0.1 0.3 ± 0.2 3.3 ± 0.8 Onager 1E, 14 fl oz** 0.3 ± 0.1 0.1 ± 0.1 0.2 ± 0.1 0.1 ± 0.1 3.4 ± 1.2 Oberon 4SC, 4.25 fl oz + Dimethoate 4E, 16 fl oz 0.5 ± 0.3 0.1 ± 0.1 0.0 ± 0.0 0.2 ± 0.1 3.6 ± 1.2 GWN‐10194 1 EC, 16 fl oz** 0.2 ± 0.1 0.2 ± 0.1 0.1 ± 0.1 0.2 ± 0.1 3.6 ± 1.0 Dimethoate 4E, 16 fl oz 0.5 ± 0.2 0.1 ± 0.1 0.1 ± 0.1 0.3 ± 0.2 3.9 ± 0.6 Oberon 2 SC 8.5 fl oz** 0.6 ± 0.4 0.0 ± 0.0 0.1 ± 0.1 0.2 ± 0.1 3.9 ± 2.0 Untreated Control 0.6 ± 0.2 0.1 ± 0.1 0.1 ± 0.1 0.1 ± 0.1 4.0 ± 1.2 Portal XLO, 32 fl oz 1.0 ± 0.3 0.0 ± 0.0 0.1 ± 0.1 0.0 ± 0.0 4.7 ± 1.5 Brigade 2EC, 6.4 fl oz + Dimethoate 4E, 16 fl oz 1.0 ± 0.4 0.1 ± 0.1 0.0 ± 0.0 0.3 ± 0.1 5.0 ± 1.5 Onager 1E, 16 fl oz** 0.3 ± 0.1 0.1 ± 0.1 0.4 ± 0.4 0.3 ± 0.3 5.1 ± 3.9 Onager 1 EC, 18 fl oz 0.9 ± 0.4 0.2 ± 0.1 0.1 ± 0.0 0.0 ± 0.0 5.1 ± 1.6 GWN‐10194 1 EC, 18 fl oz** 0.3 ± 0.1 0.2 ± 0.2 0.0 ± 0.0 0.8 ± 0.7 5.3 ± 2.3 Brigade 2EC, 6.4 fl oz + Dimethoate 4E, 16 fl oz 1.0 ± 0.5 0.2 ± 0.2 0.3 ± 0.3 0.0 ± 0.0 6.5 ± 4.6 Portal XLO, 32 fl oz** 0.6 ± 0.4 0.3 ± 0.2 0.1 ± 0.1 0.6 ± 0.4 6.6 ± 3.3 Oberon 4SC, 4.25 fl oz + Dimethoate 4E, 16 fl oz 1.2 ± 0.4 0.2 ± 0.2 0.1 ± 0.0 0.2 ± 0.1 7.0 ± 2.0 Onager 1E, 18 fl oz** 2.1 ± 1.6 0.0 ± 0.0 0.4 ± 0.4 0.0 ± 0.0 10.3 ± 8.1 F value 0.57 0.72 0.87 0.4 p>F 0.9202 0.7854 0.6188 0.9864 *Dyne‐Amic nonionic surfactant 0.25% v/v used with all treatments, **early treatment date 1SE, standard error of the mean, DAT, days after the late treatment. 2 Calculated by the method of Ruppel (Journal of Economic Entomology 76: 375‐7, 1983). The table is sorted by the means in this column.
Table 15. Control of spider mites in field corn with hand‐applied miticides ‐ Part 2, ARDEC, Fort Collins, CO, 2017. MITES PER LEAF ± SE1
PRODUCT, FL OZ/ACRE* ‐1 DAT 7 DAT 14 DAT 21 DAT TOTAL MITE DAYS ± SE2
KFD‐217‐01 480 g/L SC, 16 fl oz** 0.4 ± 0.2 0.1 ± 0.1 C 0.0 ± 0.0 B 0.1 ± 0.0 C 2.0 ± 0.7 B KFD‐217‐01 480 g/L SC, 24 fl oz** 0.1 ± 0.1 0.1 ± 0.1 C 0.0 ± 0.0 B 0.2 ± 0.1 BC 2.0 ± 0.8 B ZEAL 2.88 SC 6 fl oz** 0.2 ± 0.1 0.1 ± 0.1 C 0.0 ± 0.0 B 0.3 ± 0.2 BC 2.6 ± 0.9 B KFD‐272‐01 2 SC, 7 fl oz** 0.3 ± 0.1 0.1 ± 0.1 C 0.0 ± 0.0 B 0.3 ± 0.1 BC 2.8 ± 1.2 B ZEAL 2.88 SC 3 fl oz** 0.3 ± 0.1 0.3 ± 0.1 C 0.1 ± 0.0 B 0.3 ± 0.1 BC 4.6 ± 1.0 B KFD‐326‐01 1 EW, 12 fl oz** 0.2 ± 0.1 0.3 ± 0.1 C 0.0 ± 0.0 B 0.7 ± 0.4 BC 5.4 ± 2.1 B ZEAL 2.88 SC4 fl oz** 0.2 ± 0.1 1.0 ± 0.7 BC 0.1 ± 0.1 B 0.0 ± 0.0 C 8.8 ± 5.3 B KFD‐286‐01, 42 fl oz** 1.0 ± 1.0 0.6 ± 0.1 BC 0.0 ± 0.0 B 0.2 ± 0.1 BC 8.8 ± 3.8 B Untreated Control 1.9 ± 0.3 2.4 ± 0.7 A 1.8 ± 0.5 A 1.1 ± 0.1 AB 40.0 ± 4.2 A Onager 1E, 16 fl oz** 2.5 ± 0.6 1.8 ± 0.5 AB 1.7 ± 0.7 A 3.1 ± 1.4 A 44.0 ± 8.6 A F value 7.29 13.52 7.75 14.68 p>F 0.0000 0.0000 0.0000 0.0000 *Dyne‐Amic nonionic surfactant 0.25% v/v used with all treatments, **early treatment date 1 SE, standard error of the mean, DAT, days after the late treatment. Means in the same column followed by the same letter(s) are not statistically different, Tukey’s HSD (%=0.05). 2 Calculated by the method of Ruppel (Journal of Economic Entomology 76: 375‐7, 1983). The table is sorted by the means in this column.
Table 16. Control of spider mites in field corn with hand‐applied miticides ‐ Part 3, ARDEC, Fort Collins, CO, 2017. MITES PER LEAF ± SE1
PRODUCT, FL OZ/ACRE* ‐1 DAT 7 DAT 14 DAT 21 DAT TOTAL MITE DAYS ± SE2
GWN‐10410, 16 fl oz** 0.0 ± 0.0 0.1 ± 0.1 0.0 ± 0.0 0.4 ± 0.2 2.0 ± 0.9 GWN‐10410, 8 fl oz** 0.4 ± 0.2 0.0 ± 0.0 0.0 ± 0.0 0.2 ± 0.1 2.0 ± 0.7 Onager 1E, 20 fl oz 0.3 ± 0.2 0.0 ± 0.0 0.1 ± 0.1 0.0 ± 0.0 2.2 ± 0.6 Onager 1E, 16 fl oz** 0.3 ± 0.1 0.1 ± 0.1 0.1 ± 0.1 0.1 ± 0.1 2.7 ± 0.6 GWN‐10410, 8 fl oz 0.5 ± 0.2 0.1 ± 0.1 0.1 ± 0.1 0.1 ± 0.1 3.9 ± 0.5 GWN‐10410, 16 fl oz 0.5 ± 0.2 0.3 ± 0.1 0.1 ± 0.0 0.1 ± 0.1 4.0 ± 1.6 Onager 1E, 20 fl oz** 0.3 ± 0.1 0.3 ± 0.2 0.1 ± 0.1 0.3 ± 0.3 4.9 ± 1.4 GWN‐10410, fl oz** 0.1 ± 0.1 0.5 ± 0.2 0.1 ± 0.1 0.3 ± 0.1 5.5 ± 1.6 GWN‐10410, 12 fl oz 0.4 ± 0.2 1.3 ± 1.2 0.0 ± 0.0 0.1 ± 0.1 11.5 ± 8.5 Untreated control 0.8 ± 0.7 1.9 ± 1.7 0.1 ± 0.0 0.4 ± 0.2 18.3 ± 11.6 F value 1.17 0.46 1.20 1.77 p>F 0.3342 0.895 0.3202 0.1008 *Dyne‐Amic nonionic surfactant 0.25% v/v used with all treatments, **early treatment date 1 SE, standard error of the mean, DAT, days after the late treatment. 2 Calculated by the method of Ruppel (Journal of Economic Entomology 76: 375‐7, 1983). The table is sorted by the means in this column.
2017 PEST SURVEY RESULTS Table 17. 2017 pheromone trap catches at ARDEC, Fort Collins, CO.
ARDEC – 1030*
Species Total Caught2 Trapping Period
Army cutworm 95 (13) 8/21 ‐ 11/6 Banded sunflower moth 56 (47) 5/22 – 9/25
Beet armyworm
17 (57) 5/30 ‐ 9/25European corn borer (IA)
1 20 (23) 5/22 – 9/25Fall armyworm
123 (160) 4/24 ‐ 10/23Pale western cutworm
22 (27) 8/14 ‐ 10/16 Sunflower moth 11(15) 5/16 – 9/11 Western bean cutworm 45 (19) 5/22 – 9/11 Wheat head armyworm 90 (31) 4/24 ‐ 9/25 Wheat stem sawfly 0 (3) 5/15 ‐ 6/5 * (N40.654201, W104.997667) 1 IA, Iowa strain 2 –, not trapped. Number in () is 2016 total catch for comparison WHEAT STEM SAWFLY SURVEY 2017 Camden James, Bruce Gammonley, Sam Wheeler, Darren Cockrell, Laura Newhard and Frank Peairs, Department of Bioagricultural Sciences and Pest Management. WHEAT STEM SAWFLY SURVEY 2017: The wheat stem sawfly, Cephus cinctus Norton, is a major pest of wheat and other cereals, but also utilizes a wide range of grass hosts. Its distribution includes the northern Great Plains region, reaching from North Dakota and Montana to southeastern Wyoming and Colorado and the Nebraska panhandle. Wheat stem sawfly adults emerge in late May to early June, generally around the time winter wheat is in late stem elongation or early boot. Females insert eggs inside the stems of wheat, usually near a node. Larvae hatch within 5‐7 days and feed downward through the stem for approximately one month. When the plants begin to mature, the larvae move to the base of the plant, cut a small v‐shaped notch around the stem and fill the end of the stem with frass. The larvae overwinter within a thin cocoon that they construct to prevent them from dessication. In early spring, larvae pupate and emerge as adults when conditions are favorable. Wheat stem sawfly has one generation per year. In 2010, the wheat stem sawfly was found in winter wheat in northeastern Colorado. In 2011, damaging populations were found in winter wheat planted near New Raymer, CO, where 40% lodging from the sawfly was observed. A one‐day survey, conducted in 2011 in northeastern Colorado at anthesis revealed that 57% of the fields surveyed were infested with wheat stem sawfly. A more formal survey was initiated in 2012. Approximately 100 samples are collected annually, with the samples per county based on the number of acres each county had in wheat production in 2010. Samples are taken as near as possible to the sites used in 2012, for comparison purposes. Each site is a minimum of 10 miles from its closest neighbor toallow appropriate mapping and to improve the distribution of samples with counties. Each site consisted of a wheat field that shared a field edge with a fallow wheat field. The two fields are directly adjacent and not separated by barriers or roads. GPS coordinates were recorded at each location using a Garmin model GPSmap76S. Data on previous crop, presence of adjacent alternative host grasses, tillage type, stubble/residue percent cover, irrigation, county and wheat growth stage were recorded. Wheat stem sawfly adult and larval presence and abundance was determined. Adults were collected by 100 180Esweeps with a standard insect sweep net within the wheat crop, along the field edge closest to the adjacent fallow, during the sawfly flight. Contents of the net were then emptied into ziplock plastic bags and transported in coolers. The samples were then stored in the freezer for later sawfly counts and future genetic analyses. After anthesis, each site was revisited to collect tillers for determining percentage of larval infestation. Whole plants were dug up along the wheat/fallow border and were placed into ziplock bags and transported to the lab in coolers. The plants were kept in a refrigerator and later dissected to determine percentage larval infestation. Maps of wheat stem sawfly infested and non‐infested sites were constructed using Carta DB. Different colored circles indicate the level of infestation and white circles indicates no sawfly present (See Figure 1). Results from previous surveys are summarized in Table 18.
Table 18. Colorado wheat stem sawfly survey: 2012 ‐ 2017.
% Fields in Each Infestation Category
Infestation Category
2012
2013
2014
2015
2016
2017
Uninfested
74
66
50
34
63
46
Low (<10% infested stems)
18
17
30
47
28
37
Medium (10 ‐ 50% infested stems)
6
13
15
17
6
12
High (>50% infested stems)
2
4
5
2
3
5
Total Infested Fields
26
34
50
66
37
54
Figure 1
INSECTICIDE PERFORMANCE SUMMARIES Insecticide performance in a single experiment can be quite misleading. To aid in the interpretation of the tests included in this report, long term performance summaries are presented below for insecticides that are registered for use in Colorado and that have been tested at least three times. These summaries are complete through 2017. Table 19. Performance of planting‐time insecticides against western corn rootworm, 1987‐2017, in northern Colorado. INSECTICIDE 0 ‐3 ROOT RATING1 AGRISURE RW 0.14 (7) AZTEC 2.1G 0.06 (36) COUNTER 15G 0.06 (39) CRUISER, 1.25 mg (AI)/seed 0.06 (10) FORCE 1.5G (8 OZ) or 3G (4 OZ) 0.06 (32) FORCE 3G (5 OZ) 0.07 (12) FORCE CS, 0.46 oz 0.10 (4) FORTRESS 5G 0.09 (16) HERCULEX RW or xTRA 0.13 (6) LORSBAN 15G 0.12 (31) PONCHO 600, 1.25 mg (AI)/seed 0.04 (8) SMARTSTAX 0.04 (3) THIMET 20G 0.50 (15) UNTREATED CONTROL 1.10 (40) 1 Rated on the node damage scale of 0‐3, where 0 is least damaged, and 3 is 3 root nodes completely damaged. Ratings taken prior to 2006 were based on the Iowa 1‐6 scale and approximated to the 0‐3 scale. Number in parenthesis is number of times the product was tested. Planting time treatments averaged over application methods. Table 20. Performance of cultivation insecticide treatments against western corn rootworm, 1987‐2005, in northern Colorado. INSECTICIDE IOWA 1‐6 ROOT RATING1 COUNTER 15G 2.8 (21) FORCE 3G 3.3 (8) LORSBAN 15G 3.1 (17) THIMET 20G 2.9 (19) UNTREATED CONTROL 4.2 (24) 1 Rated on a scale of 1‐6, where 1 is least damaged, and 6 is most heavily damaged. Number in () is number of times the product was tested. Planting time treatments averaged over application methods.
Table 21. Insecticide performance against first generation European corn borer, 1982‐2002, in northeast
Colorado.
MATERIAL LB/ACRE METHOD1 % CONTROL2
DIPEL ES 1 QT + OIL I 91 (4) LORSBAN 15G 1.00 (AI) A 77 (5) LORSBAN 15G 1.00 (AI) C 80 (6) LORSBAN 4E 1.0 (AI) I 87 (9) POUNCE 3.2E 0.15 (AI) I 88 (11) POUNCE 1.5G 0.15 (AI) C 87 (4) POUNCE 1.5G 0.15 (AI) A 73 (7) THIMET 20G 1.00 (AI) C 77 (4) THIMET 20G 1.00 (AI) A 73 (3) WARRIOR 1E 0.03 (AI I 85 (4) 1A = Aerial, C = Cultivator, I = Center Pivot Injection. CSU does not recommend the use of aerially‐applied liquids for control of first generation European corn borer. 2 Numbers in () indicate the number of trials represented in the average.. Table 22. Insecticide performance against western bean cutworm, 1982‐2002, in northeast Colorado.
MATERIAL LB (AI)/ACRE METHOD1 % CONTROL2
CAPTURE 2E 0.08 A 98 (5) CAPTURE 2E 0.08 I 98 (5) LORSBAN 4E 0.75 A 88 (4) LORSBAN 4E 0.75 I 94 (4) POUNCE 3.2E 0.05 A 97 (7) POUNCE 3.2E 0.05 I 99 (5) WARRIOR 1E (T) 0.02 I 96 (2) 1 A = Aerial, I = Center Pivot Injection 2Numbers in () indicated the number of trials represented in the average..
Table 23. Insecticide performance against second generation European corn borer, 1982‐2002, in
northeast Colorado.
MATERIAL LB (AI)/ACRE METHOD1 % CONTROL2
DIPEL ES 1 QT PRODUCT I 56 (16) CAPTURE 2E 0.08 A 85 (8) CAPTURE 2E 0.08 I 86 (14) LORSBAN 4E 1.00 + OIL I 72 (14) POUNCE 3.2E 0.15 I 74 (11) WARRIOR 1E 0.03 A 81 (4) WARRIOR 1E 0.03 I 78 (4) 1A = Aerial, I = Center Pivot Injection 2 Numbers in () indicate the number of trials represented in the average.. Table 24. Performance of hand‐applied insecticides against alfalfa weevil larvae, 1984‐2017, in northern Colorado.
PRODUCT LB (AI)/ACRE % CONTROL AT 2 WK1
BAYTHROID XL 0.022 91 (22) BAYTHROID XL 0.022 (early)3 87 (14) COBALT OR COBALT ADVANCED 19 fl oz 88 (9) LORSBAN 4E 0.75 93 (24) LORSBAN 4E 1.00 88 (13) LORSBAN 4E 0.50 83 (10) MUSTANG MAX 0.025 89 (12) MUSTANG MAX 0.025 (early)3 84 (14) PERMETHRIN 2 0.10 67 (7) PERMETHRIN 2 0.20 80 (4) STALLION 11.75 FL OZ 92 (6) STEWARD EC 0.065 80 (7) STEWARD EC 0.110 84 (11) WARRIOR 1E or T or II 0.02 92 (18) WARRIOR II 0.03 (early)3 85 (8) WARRIOR 1E or T or II 0.03 88 (15) 1 Number in () indicates number of years represented in the average. 2 Includes both Ambush 2E and Pounce 3.2E. 3Early treatment timed for control of army cutworm
Table 25. Control of Russian wheat aphid with hand‐applied insecticides in winter wheat, 1986‐20171.
PRODUCT LB (AI)/ACRE TESTS WITH CONTROL > 90% TOTAL TESTS % TESTS
LORSBAN 4E 0.50 31 53 58 COBALT 11 FL OZ 3 8 38 BAYTHROID XL 0.019 0 10 0 DIMETHOATE2 0.375 9 45 20 ENDIGO 2.71 ZCX 4 FL OZ 4 7 58 MUSTANG MAX 0.025 3 14 21 LORSBAN 4E 0.25 10 27 37 LORSBAN 4E 0.375 5 6 83 WARRIOR2 0.03 5 22 23 1Includes data from several states; 2 several formulations. Table 26. Control of spider mites in artificially‐infested corn, ARDEC, 1993‐2017.
PRODUCT LB (AI)/ACRE % REDUCTION IN TOTAL MITE DAYS1
CAPTURE 2E 0.08 47 (21) CAPTURE 2E + DIMETHOATE 4E 0.08 + 0.50 66 (23) COMITE II 1.64 17 (17) COMITE II 2.53 37 (9) COMITE II + DIMETHOATE 4E 1.64 + 0.50 55 (13) DIMETHOATE 4E 0.50 45 (21) OBERON 4SC 0.135 50 (8) OBERON 4SC 0.156 60 (7) OBERON 4SC 0.188 52 (6) ONAGER 1E 0.078 69 (9) ONAGER 1E 0.094 70 (6) PORTAL XLO (early) 0.10 44 (4) PORTAL XLO (late) 0.10 46 (3) ZEAL 0.09 46 (5) 1Number in () indicates number of tests represented in average. 2009 data not included. Table 27. Control of sunflower stem weevil, USDA Central Great Plains Research Station, 1998‐2002.
PRODUCT LB (AI)/ACRE TIMING % CONTROL1
BAYTHROID 2E 0.02 CULTIVATION 57 (3) BAYTHROID 2E 0.03 CULTIVATION 52 (3) WARRIOR 1E 0.02 CULTIVATION 63 (3) WARRIOR 1E 0.03 CULTIVATION 61 (3) 1 Number in () indicates number of tests represented in average.
ACKNOWLEDGMENTS
2017 COOPERATORS
PROJECT LOCATION COOPERATORS
Alfalfa insecticides ARDEC, Fort Collins Karl Whitman, Mark Collins Barley insecticides ARDEC, Fort Collins Karl Whitman, Mark Collins Corn spider mite control ARDEC, Fort Collins Karl Whitman, Mark Collins, Bob
Hammon Russian wheat aphid
control
ARDEC, Fort Collins Karl Whitman, Mark Collins
Wheat stem sawfly control New Raymer Jim and Cole Mertens Wheat stem sawfly control Orchard Cary and Todd Wickstrom Pheromone traps ARDEC, Fort Collins Karl Whitman, Mark Collins Suction trap ARDEC, Fort Collins Karl Whitman, Mark Collins Suction trap Akron (Central Great Plains
Research Station)
Dave Poss, Merle Vigil
Suction trap Lamar Jensen Stulp
Suction trap Walsh (Plainsman Research Center)
PRODUCT INDEX