Technical Report 14-13
Ag
ricultural
Experiment Station
College of Agricultural Sciences Department of Soil and Crop SciencesSouthwestern Colorado Research Center Colorado State University Extension
Southwestern Colorado Research Center
2013 Results
1
Colorado State University
Agricultural Experiment Station
Southwestern Colorado Research Center
2013 Results
Editor: Abdel F. Berrada, Senior Research Scientist & Manager Colorado State University
Southwestern Colorado Research Center Yellow Jacket, Colorado
Cover photo shows winter wheat in the dryland crop rotation trial at the Southwestern Colorado Research Center. Jerry Mahaffey is operating the mini-combine. Photo taken on July 11, 2013 by
Abdel Berrada.
Acknowledgments
The following individuals contributed to the research, demonstration or outreach programs at the Southwestern Colorado Research Center (SWCRC) in 2013:
Dr. Scott Haley and Dr. Jerry Johnson of Colorado State University (CSU), Ft. Collins Tom Hooten and Kim Dillivan of CSU Extension in Montezuma and Dolores Counties Dr. Joe Brummer and his graduate student Lyndsay Jones of CSU Ft. Collins
Joel Schneekloth of CSU Extension at Akron, CO Bob Hammon of CSU Extension at Grand Junction, CO Michael Stamm of KSU
David McCart, Chairman of SWCRC’s advisory board SWCRC staff Jerry Mahaffey and Amin Berrada
The institutions and companies that provided seeds or funding include: Dolores Water Conservancy District
Southwestern Colorado Water Conservation District National Sunflower Association
Cal/West, SeedTec, Syngenta, Triumph, MillerCoors™
This report was compiled and formatted by Amin Berrada and reviewed by Dr. Gary Peterson and Dr. Jerry Johnson.
Disclaimer
Mention of a trademark or proprietary product does not constitute endorsement by the Colorado Agricultural Experiment Station. Colorado State University is an equal opportunity/affirmative action institution and complies with all Federal and Colorado State laws, regulations, and
executive orders regarding affirmative action requirements in all programs. The Office of Equal Opportunity is located in 101 Student Services. In order to assist Colorado State University in meeting its affirmative action responsibilities, ethnic minorities, women, and other protected class members are encouraged to apply and to so identify themselves.
2
Contents
Soil & Climate at the Southwestern Colorado Research Center...5
Soil ...5
Precipitation & temperature ...5
2013 Dryland Safflower Variety Trial1 ...9
Trial information ...9
Comments ...9
2013 Irrigated Safflower Variety Trial1 ...10
Trial information ...10
Comments ...10
2012-2013 Winter Camelina Variety Trial ...12
2012-2013 National Winter Canola Variety Trial ...13
2012-2013 Winter Wheat Variety Trial ...15
2013 Irrigated Barley Trial...17
2013 Dryland Barley Trial ...19
Evaluation of Sunflower in Dryland Cropping Systems: 2011-2013 Results ...20
Yield by crop ...20
Yield by crop rotation ...21
Pre-plant soil moisture availability ...22
Pre-plant nitrate N ...22
Preliminary conclusion ...24
Boosting Sunflower Production in SW Colorado with Supplemental Irrigation: 2013 Result Summary ...25
Materials & Methods ...25
Results ...27
Boosting Sunflower Production in SW Colorado with Supplemental Irrigation: 2010-2012 Results ...29
Introduction ...29
Materials and Methods ...30
Results and Discussion ...31
2010 ...31 2011 ...32 2012 ...32 Conclusion ...32 Literature Cited ...33 Acknowledgments ...33
Agronomic Responses to Partial and Full Season Fallowing of Alfalfa and Grass Hayfields ...38
Yellow Jacket Fruit Tree and Vineyard Research and Demonstration Project: 2013 Report ...40
Project Background ...40
Highlights of the 2013 Season ...41
Variety Testing Results to Date ...41
Irrigation ...43
Additional Investigations ...43
Annual Meeting of the Advisory Committee of the Colorado State University Southwestern Colorado Research Center ...47
3
Tables
Table 1: Crop summary ...7
Table 2: Results of the 2013 dryland safflower variety trial ...9
Table 3: Results of the 2013 irrigated safflower variety trial ...10
Table 4: Results of the 2012-2013 winter camelina variety trial ...12
Table 5: 2012-2013 winter camelina variety trial information ...12
Table 6: Results of the 2012-2013 National Winter Canola Variety Trial ...13
Table 7: 2012-2013 National Winter Canola Variety Trial Information ...14
Table 8: Results of the 2012-2013 winter wheat variety trial ...15
Table 9: 2012-2013 winter wheat variety trial information ...15
Table 10: Results of the 2013 irrigated barley trial ...17
Table 11: 2013 irrigated barley trial information ...17
Table 12: Quality standards for malting barley as shown in Exhibit A of the purchase agreement with MillerCoors™ for the 2013 growing season. ...18
Table 13: Results of the 2013 dryland barley trial ...19
Table 14: 2013 dryland barley trial information ...19
Table 15: 2011-2013 crop yield and value ...21
Table 16: 2011-2013 average crop yield and profit for each crop rotation ...21
Table 17. The effect of the previous year's crop on the yield of the 2013 crop. ...22
Table 18: Available soil water and nitrate-N in the spring and fall 2013 ...23
Table 19: Irrigation treatments ...26
Table 20: Sunflower seed yield, test weight, and plant height in 2013 ...28
Table 21: Sunflower planting dates and rates. ...31
Table 22: Irrigation treatments and amounts. ...31
Table 23: Results at Yellow Jacket (alfalfa) in 2013 ...39
Table 24: 2013 orchard production information ...44
Table 25: Historical weather events at the orchard ...46
Figures
Figure 1: Monthly precipitation at Yellow Jacket, CO in 2012, 2013, 1992-2013 (CoAgMet), and 1981-2010 ...6Figure 2: Monthly maximum and minimum temperatures at Yellow Jacket, CO ...6
Figure 3: Monthly precipitation at Yellow Jacket in 2012 and 2013 ...26
Figure 4: Evapotranspiration and applied water for the I-2 treatment ...27
Figure 5: Seed yield and precipitation use efficiency (PUE) in 2010 as affected by irrigation scheduling ...34
Figure 6: Seed yield and precipitation use efficiency (PUE) in 2011 as affected by irrigation scheduling ...34
4
Figure 7: Seed yield of two sunflower hybrids in 2012 as affected by irrigation scheduling ...34 Figure 8: Precipitation use efficiency (PUE) of two sunflower hybrids in 2012 as affected by irrigation scheduling ...34 Figure 9: Oil content of sunflower hybrid 8H449CLDM in 2010 as affected by irrigation
scheduling ...35 Figure 10: Oil content of sunflower hybrid 8H449CLDM in 2011 as affected by irrigation
scheduling ...35 Figure 11: Oil content of two sunflower hybrids in 2012 as affected by irrigation scheduling ....36 Figure 12: Plant height of sunflower hybrid 8H449CLDM in 2010 as affected by irrigation scheduling ...36 Figure 13: Plant height of sunflower hybrid 8H449CLDM in 2011 as affected by irrigation scheduling ...36 Figure 14: Plant height of two sunflower hybrids in 2012 as affected by irrigation scheduling ...36 Figure 15: Rainfall in May through September at the study site ...37 Figure 16: U-PICK Day. Master Gardeners (persons wearing orange vests) were on hand to answer customer questions. Photo taken by Abdel Berrada. ...40
5
Soil & Climate at the Southwestern Colorado Research
Center
Abdel Berrada
Soil
The principal soil type at the Research Center is Wetherill loam (fine-silty, mixed, superactive, mesic Aridic Haplustalfs). The Wetherill series is made up of generally deep well drained soils, located on mesas and hills. These soils were formed from sandstone material transported by wind from the Southwest. They tend to be reddish on the surface and generally have low organic matter (around 1.0%). Their water holding capacity ranges from approximately 1.8 to 2.0
inches/ft. Soil pH at the SWCRC is around 7.5. The terrain in southwestern Colorado is generally rolling. Slopes vary from 1 to 12% and the elevation from less than 6,000 ft. to above 7,000 ft. The potential exists for significant wind and water erosion on bare ground, especially in the spring.
Precipitation & temperature
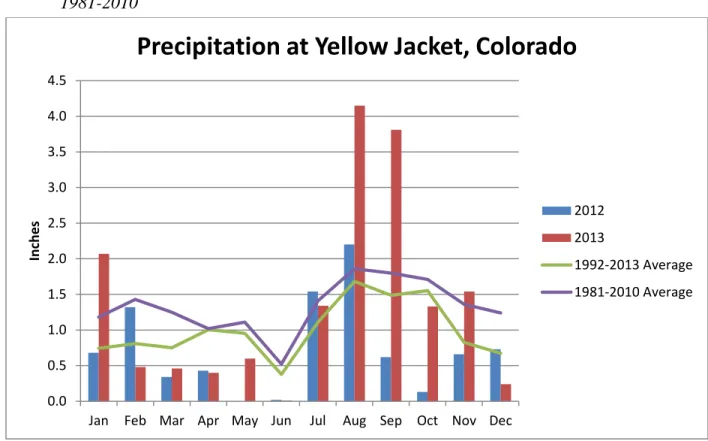
The 30-year (1981-2010, NOAA) average annual precipitation at Yellow Jacket is 15.9 inches of water (Figure 1). Annual precipitation at the CoAgMet (Colorado Agricultural Meteorology) weather station in Yellow Jacket averaged only 12 inches from 1992 when the station became operational through 2013. This may not account for all the moisture from snow, since CoAgMet uses a simple tipping bucket rain gauge. The average annual snowfall is 68.1 inches (30-year average from 1971-2000). June is the driest month and August is the wettest month. Average monthly minimum and maximum temperatures are shown in Figure 2. The frost-free period is 100 to 120 days. The Research Center lies at an elevation of 6900 ft., latitude 37°32’ N and longitude 108°44’ W. The 2012-2013 growing season started with a dry fall followed by a “wet” January and an extremely dry spring. Precipitation in August and September was substantially above normal, which boosted the total for 2013 to 16.4 inches (Figure 1).
6
Figure 1: Monthly precipitation at Yellow Jacket, CO in 2012, 2013, 1992-2013 (CoAgMet), and 1981-2010
Figure 2: Monthly maximum and minimum temperatures at Yellow Jacket, CO 0.0 0.5 1.0 1.5 2.0 2.5 3.0 3.5 4.0 4.5
Jan Feb Mar Apr May Jun Jul Aug Sep Oct Nov Dec
Inc
h
es
Precipitation at Yellow Jacket, Colorado
2012 2013 1992-2013 Average 1981-2010 Average 0 10 20 30 40 50 60 70 80 90 100
Jan Feb Mar Apr May Jun Jul Aug Sep Oct Nov Dec
D eg ree s Fa rh en h ei t
Temperatures at Yellow Jacket, Colorado
Max - 2013 Min - 2013
Max - 1992-2013 average Min - 1992-2013 average
7
Overall Crop Production Summary
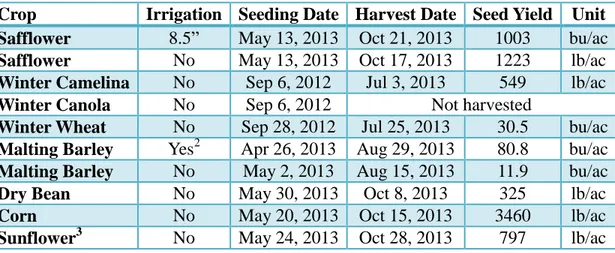
Abdel Berrada1 Table 1: Crop summary
Crop Irrigation Seeding Date Harvest Date Seed Yield Unit Safflower 8.5” May 13, 2013 Oct 21, 2013 1003 bu/ac
Safflower No May 13, 2013 Oct 17, 2013 1223 lb/ac
Winter Camelina No Sep 6, 2012 Jul 3, 2013 549 lb/ac
Winter Canola No Sep 6, 2012 Not harvested
Winter Wheat No Sep 28, 2012 Jul 25, 2013 30.5 bu/ac
Malting Barley Yes2 Apr 26, 2013 Aug 29, 2013 80.8 bu/ac
Malting Barley No May 2, 2013 Aug 15, 2013 11.9 bu/ac
Dry Bean No May 30, 2013 Oct 8, 2013 325 lb/ac
Corn No May 20, 2013 Oct 15, 2013 3460 lb/ac
Sunflower3 No May 24, 2013 Oct 28, 2013 797 lb/ac
Fall-seeded crops did not yield well given the dry conditions in the fall of 2012 and spring of 2013. The winter wheat variety trial averaged 30.5 bu/acre, which was similar to 2012 (27.4 bu/acre) but much below the 2011 average of 51.1 bu/acre. Winter canola was not harvested due to a poor stand in the fall and significant bird damage during grain maturation.
The drought of 2012 through June 2013 resulted in severe irrigation water shortages. Irrigation water allocation in 2013 was 6.1 inches/acre compared to the normal allocation of 22.6 inches for the Fairview service area of the Dolores Project. Precipitation in August and September 2013 was substantially above average, which benefited corn, safflower, and sunflower. These crops sustained some damage from three hail storms in early September. Hail damage was greatest for malting barley and dry bean.
This was the first year of testing malting barley at the research center. The results were not encouraging due to hail damage and to drought during the first half of 2013. The dryland trial averaged 12 bu/acre while the irrigated trial averaged 81 bu/acre. The combination of drought and nitrogen availability resulted in grain protein contents that exceeded the acceptable levels (7.5% to 14%) for malting quality.
The irrigated safflower variety trial had a poor stand and was weedy in spite of a pre-plant application of Trifluralin. The dryland safflower variety trial was much cleaner and had a better stand, which explains its superior performance.
In the dryland crop rotation trial, sunflower produced 1162 lb/acre when grown after winter wheat and only 551 lb/acre after dry bean. Dry bean did poorly due to drought and hail. Dry bean
1 Senior Research Scientist and Manager of the SWCRC.
2 5 sideroll irrigations
8
after winter wheat produced 375 lb/acre while dry bean after dry bean produced 225 lb/acre. The winter-wheat-sunflower-fallow rotation had the highest estimated profit of $23.53, followed by winter wheat-safflower-fallow ($18.78) and winter wheat-fallow ($12.99). Twice as much NO3
-N was available in the top 2.0 ft. of soil in the fall than in the spring prior to crop planting. As would be expected, more NO3-N was present in the soil following dry bean than following
sunflower, safflower or winter wheat.
In the sunflower irrigation study, sunflower seed yield was significantly greater with the full irrigation treatment (I-2) than with the other treatments. The standard height hybrid Mycogen 8H449CLDM outperformed the short stature hybrid Triumph s870HCL at I-2 and I-3 (Irrigation from R1 to R6). Contrary to soil test recommendation, nitrogen fertilizer (60 lb N/acre) had no significant effect on seed yield nor did N by irrigation or N x sunflower variety interactions. The alfalfa irrigation termination study headed by Dr. Joe Brummer produced interesting results. Alfalfa hay yield reductions at the three sites where this study was conducted (Fruita, Gunnison, and Yellow Jacket) ranged from 42% to 71% when irrigation was stopped after the first cutting and from 0% to 54% when irrigation was stopped after the second cutting. The complete fallow treatment, which was only implemented at the Yellow Jacket site, showed a 77% yield reduction compared to the full irrigation treatment. Potential crop ET at the alfalfa sites ranged from 38.3 to 41.6 inches as measured with an atmometer and rainfall ranged from 3.93 to 6.32 inches. Yield reductions at the season-long fallowed grass sites ranged from 24% to 70%. Potential crop ET for the season ranged from 16.5 to 25.6 inches and precipitation from rain and snow ranged from 3.22 to 6.74 inches.
Fruit production increased by 36% compared to 2012, despite a dry spring and hail in early September. Fruit quality was good due to successful pest management (especially codling moth) and fruit thinning--both chemical and manual methods were used.
9
2013 Dryland Safflower Variety Trial
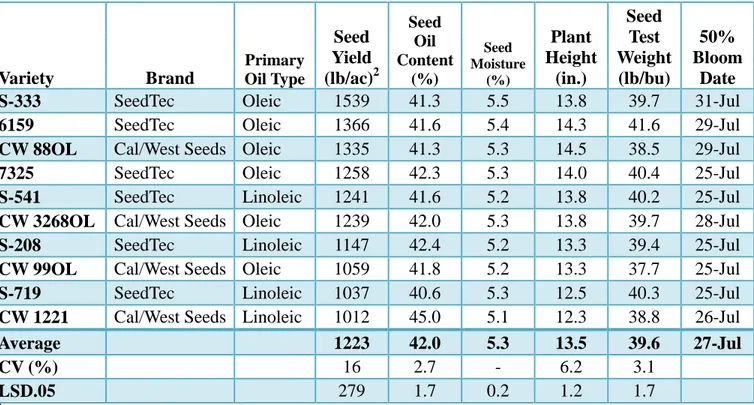
1Abdel Berrada Table 2: Results of the 2013 dryland safflower variety trial
Variety Brand Primary Oil Type Seed Yield (lb/ac)2 Seed Oil Content (%) Seed Moisture (%) Plant Height (in.) Seed Test Weight (lb/bu) 50% Bloom Date
S-333 SeedTec Oleic 1539 41.3 5.5 13.8 39.7 31-Jul
6159 SeedTec Oleic 1366 41.6 5.4 14.3 41.6 29-Jul
CW 88OL Cal/West Seeds Oleic 1335 41.3 5.3 14.5 38.5 29-Jul
7325 SeedTec Oleic 1258 42.3 5.3 14.0 40.4 25-Jul
S-541 SeedTec Linoleic 1241 41.6 5.2 13.8 40.2 25-Jul
CW 3268OL Cal/West Seeds Oleic 1239 42.0 5.3 13.8 39.7 28-Jul
S-208 SeedTec Linoleic 1147 42.4 5.2 13.3 39.4 25-Jul
CW 99OL Cal/West Seeds Oleic 1059 41.8 5.2 13.3 37.7 25-Jul
S-719 SeedTec Linoleic 1037 40.6 5.3 12.5 40.3 25-Jul
CW 1221 Cal/West Seeds Linoleic 1012 45.0 5.1 12.3 38.8 26-Jul
Average 1223 42.0 5.3 13.5 39.6 27-Jul
CV (%) 16 2.7 - 6.2 3.1
LSD.05 279 1.7 0.2 1.2 1.7
1
Trial conducted at Colorado State University’s Southwestern Colorado Research Center. Design: RCB, # reps: 4
2 Adjusted to 10% moisture
Trial information
Seeded: May 13, 2013 @ 348,480 seeds/ac Harvested: October 17, 2013
Previous crop: Summer fallow
Fertilizer: 15 lb N + 69 lb P2O5 + 40 S/ac on August 30, 2012
Herbicide: Trifluralin @ 1.6 pt/acre on August 28, 2012 Rainfall (Planting - Sept.): 9.36 in. (140-150% of normal)
Comments
Soil moisture at planting was adequate but there was little rain until mid-July. August and
September had substantially more rainfall than normal. Applying Trifluralin in late summer 2012 combined with light tillage and occasional hand hoeing kept the plot area clean throughout the 2012-2013 season. Seed oil content may be overestimated due to higher than usual percentage of broken kernels.
10
2013 Irrigated Safflower Variety Trial
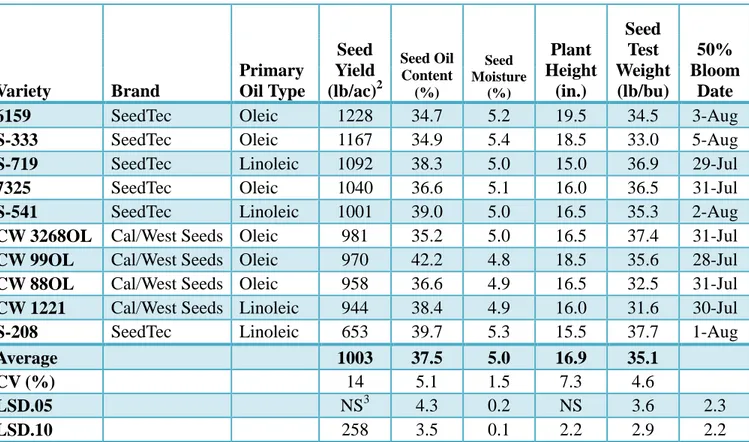
1Abdel Berrada Table 3: Results of the 2013 irrigated safflower variety trial
Variety Brand Primary Oil Type Seed Yield (lb/ac)2 Seed Oil Content (%) Seed Moisture (%) Plant Height (in.) Seed Test Weight (lb/bu) 50% Bloom Date
6159 SeedTec Oleic 1228 34.7 5.2 19.5 34.5 3-Aug
S-333 SeedTec Oleic 1167 34.9 5.4 18.5 33.0 5-Aug
S-719 SeedTec Linoleic 1092 38.3 5.0 15.0 36.9 29-Jul
7325 SeedTec Oleic 1040 36.6 5.1 16.0 36.5 31-Jul
S-541 SeedTec Linoleic 1001 39.0 5.0 16.5 35.3 2-Aug
CW 3268OL Cal/West Seeds Oleic 981 35.2 5.0 16.5 37.4 31-Jul
CW 99OL Cal/West Seeds Oleic 970 42.2 4.8 18.5 35.6 28-Jul
CW 88OL Cal/West Seeds Oleic 958 36.6 4.9 16.5 32.5 31-Jul
CW 1221 Cal/West Seeds Linoleic 944 38.4 4.9 16.0 31.6 30-Jul
S-208 SeedTec Linoleic 653 39.7 5.3 15.5 37.7 1-Aug
Average 1003 37.5 5.0 16.9 35.1
CV (%) 14 5.1 1.5 7.3 4.6
LSD.05 NS3 4.3 0.2 NS 3.6 2.3
LSD.10 258 3.5 0.1 2.2 2.9 2.2
1
Trial conducted at Colorado State University’s Southwestern Colorado Research Center. Reps 1 & 2 had too many stand problems; therefore only reps 3 & 4 are included in the results.
2 Adjusted to 10% moisture
3 Non Significant at P = 0.05
Trial information
Seeded: May 13, 2013 @ 348,480 seeds/ac Harvested: October 21, 2013
Previous crop: Spring wheat
Fertilizer: 92 lb N + 30 lb P2O5/ac on April 24, 2013
Herbicide: Trifluralin @ 1.5 pt/ac on May 3, 2013
Irrigation: Approximately 8.5 in. (gross amount) in four applications Rainfall (Planting - Sept.): 9.36 in. (140-150% of normal)
Comments
The seedbed at planting was dry, thus safflower germination and emergence were erratic. The first irrigation was applied approximately one week after planting. Subsequent irrigations were spaced about one month apart due to water shortage. Because of a severe drought in February through June, we only received 25% of our water allocation. The plot area was weedy in spite of
11
the application of Trifluralin on 3-May. It was hand hoed on June 21 & 24. Dryland safflower performed better than irrigated safflower this year due to better (fuller and more uniform) and cleaner (fewer weeds) stand.
12
2012-2013 Winter Camelina Variety Trial
Abdel Berrada, Charlie Rife4 Table 4: Results of the 2012-2013 winter camelina variety trial
Variety Yield (lb/ac)5 Stand on 5/15/13 (0-10)6 Grain moisture (%) Grain test weight (lb/bu) 50% bloom date 90% harvest maturity date HPX-WG4-1 842 3.5 7.2 51.4 May 13 June 23 HPX-WG1-6 831 6.2 7.4 50.5 May 12 June 21 HPX-WG1-24 649 2.9 7.4 52.1 May 16 June 23 HPX-WG1-35 593 4.8 7.3 51.3 May 13 June 26
Joelle 566 4.3 7.4 50.1 May 20 June 27
HPX-WG1-29 516 2.9 7.3 52.6 May 19 June 24
HPX-WG4 483 3.7 7.4 50.4 May 17 June 24
Bison 465 2.0 7.4 50.9 May 19 June 28
HPX-WG1-8 443 2.8 7.5 50.4 May 16 June 26
HPX-WG1 439 2.5 7.4 52.2 May 19 June 27
HPX-WG1-33 403 2.3 7.4 51.8 May 18 June 28
HPX-WG2 338 1.2 7.6 50.7 May 20 July 2
Average 549 3.3 7.4 51.1 May 17 June 26
Table 5: 2012-2013 winter camelina variety trial information
Previous crop Summer fallow
Planting date 9/6/12
Seeding rate 7.47 lb/ac
Harvest date 7/3/13
Fertilizer applied 15 lb N + 69 lb P2O5 + 40 S/ac on August 30, 2012
Pesticide applied Trifluralin @1.6 pt/ac on 8/28/12 Precipitation
(planting to harvest)
6.08 inches
Comments
The trial had four replications but replication 1 and part of replication 2 were not harvested because of a very poor stand. Yield, moisture, and test weight data were not collected from the non-harvested plots. For a few of these plots, 90% harvest maturity dates were recorded, but most of the non-harvested plots had not reached 90% harvest maturity by the time the trial was harvested.
4 Crop breeder, High Plains Crop Development, LLC, Torrington, WY
5 Adjusted to 8.5% moisture
13
2012-2013 National Winter Canola Variety Trial
Abdel Berrada, Michael Stamm7, Jerry Johnson8 Table 6: Results of the 2012-2013 National Winter Canola Variety Trial
Variety Fall stand (0-10)9 Fall vigor (0-5)10 Winter survival (%) Bloom date 90% harvest maturity date plant height (in) 46W94 4.0 0.9 17% May 17 July 20 34 46W99 1.8 1.1 27% May 24 July 18 25
Baldur 2.4 1.1 47% May 14 July 16 34
CHROME 4.3 1.1 20% May 27 July 31 30
Claremore 2.2 0.7 0%
Dimension 3.6 1.0 30% May 19 July 23 30
DKW41-10 5.4 1.3 27% May 18 July 20 26
DKW44-10 4.4 0.6 7% May 15 July 22 26
DKW46-15 5.6 1.0 20% May 22 July 20 30
DKW47-15 4.4 0.8 33% May 25 July 27 28
Dynastie 1.4 0.6 3% May 27 28
Edimax 2.9 1.3 13% May 22 July 17 26
Flash 2.8 1.0 7% May 27
Gladius 3.2 0.9 3% June 7
Hornet 2.6 0.8 10% May 25 July 29 29
HPX-7228 3.0 1.3 17% May 20 July 15 30
HPX-7341 3.9 1.5 63% May 17 July 17 29
HyCLASS115W 5.5 1.1 20% May 20 July 22 30
HyCLASS125W 4.3 1.0 27% May 20 July 18 32
Inspiration 7.5 1.4 47% May 13 July 19 29
KS4428 1.8 1.3 27% May 24 July 15 28
KS4476 5.4 1.8 23% May 20 July 15 28
MH07J14 5.2 0.9 27% May 17 July 25 29
MH09H19 6.0 1.5 37% May 22 July 18 36
NKPETROL 4.7 1.5 40% May 21 July 21 31
NKTechnic 4.5 1.5 43% May 25 July 26 28
Riley 2.8 0.6 13% May 24 July 24 27
Rossini 4.0 1.2 30% May 15 July 19 28
7 Canola breeder, Kansas State University
8 Crops testing coordinator, Colorado State University
9 0 = no stand, 10 = perfect stand
14 Variety Fall stand (0-10)9 Fall vigor (0-5)10 Winter survival (%) Bloom date 90% harvest maturity date plant height (in)
Rumba 7.3 0.9 13% May 22 July 22 26
Safran 2.9 1.1 30% May 17 July 17 32
Sitro 3.8 0.9 20% May 24 July 22 31
Sumner 4.7 0.7 37% May 15 July 15 31
SY Regata 3.6 1.5 33% May 19 July 29 30
TCI/F13 5.6 0.9 7% May 22 July 18 28
Visby 7.0 1.2 47% May 24 July 21 27
Wichita 6.8 1.3 17% May 21 July 18 30
Average 4.2 1.1 24% May 21 July 21 29
Table 7: 2012-2013 National Winter Canola Variety Trial Information
Previous crop Summer fallow
Planting date 9/6/12
Seeding rate 5 lb/ac
Harvest date Not harvested
Fertilizer applied 15 lb N + 69 lb P2O5 + 40 S/ac on August 30, 2012
Pesticide applied Trifluralin @1.6 pt/ac on 8/28/12
Precipitation (planting to July 31, 2013)
7.42 inches
Comments
The stand was very poor. Birds ate a lot of the canola as it was maturing. There was not much left by the time most of the plots reached harvest maturity so the trial was not harvested.
15
2012-2013 Winter Wheat Variety Trial
Abdel Berrada, Scott Haley11, Jerry Johnson Table 8: Results of the 2012-2013 winter wheat variety trial
Variety Type12 Yield (lb/ac)13 Protein (%)14 Grain moisture (%) Test weight (lb/bu) Plant height (inches) 50% Heading Date Byrd HRW 33.3 15.7 12 54 23 June 3 Ripper HRW 33.3 16.3 11 53 21 May 31 TAM 112 HRW 32.8 15.4 12 56 23 June 1 CO07W245 HWW 32.7 16.3 12 55 21 June 4
Brawl CL Plus HRW-CL2 32.2 15.9 12 56 23 May 31
Juniper HRW 31.9 17.3 11 57 26 June 10 CO050173 HRW 31.8 16.5 12 56 23 June 3 UI SRG HRW 31.2 17.1 11 53 24 June 10 Snowmass HWW 30.9 16.4 11 54 23 June 4 Hatcher HRW 30.9 15.1 11 54 22 June 3 Cowboy HRW 30.6 16.5 11 55 22 June 10 Denali HRW 30.2 15.7 11 56 24 June 10 Lucin CL HRW-CL 29.8 17.3 11 56 24 June 10 Curlew HRW 28.9 17.2 11 52 25 June 10 UI Darwin HWW 28.8 17.0 12 55 24 June 10 Fairview HRW 24.7 16.9 11 53 24 June 10 IDO1103 HRW 24.5 17.2 11 53 18 June 10 Average 30.5 16.5 11 55 23 June 6 LSD.05 4.1 1.3 0.3 1.1 2.0
Table 9: 2012-2013 winter wheat variety trial information
Previous crop Summer fallow
Planting date 9/28/12
Seeding rate 700,000 seeds/ac
Harvest date 7/25/13
Fertilizer applied 60.5 lb/ac of 11-52-0 on 9/21/12
Pesticide applied 2,4-D amine @ 1.0 pt/ac + Warrior @ 3.8 oz/ac on 5/4/13
Precipitation 5.54 inches (planting to harvest)
11
Wheat breeder. Colorado State University
12 HRW: Hard Red Wheat; HWW: Hard White Wheat; CL: Clearfield (resistant to ‘Beyond’ herbicide)
13 Adjusted to 12 % moisture
16
Comments
The seedbed was dry at planting. The months of October through December and February through June had well below normal precipitation. Season precipitation was approximately 49% of normal. There was no lodging and no noticeable disease infestation. Grasshoppers reached the threshold for control in early May and were consequently sprayed with Warrior.
17
2013 Irrigated Barley Trial
15Table 10: Results of the 2013 irrigated barley trial
16 17 18 19 Moravian 143 87.6 131 92.7 50.2 15.9 9.8 18 0 2 3 4 Moravian 139 85.2 127 90.9 50.2 15.2 10.1 16.5 0 2 3 4 Moravian 142 83.3 124 86.9 48.4 15.7 9.7 17.5 0 2 3 4 Moravian 069 67.1 100 83.2 48.5 15.1 10.3 15.5 0 2 3 4 Trial Mean 80.8 88.4 49.3 15.5 9.9 16.9 0 2 3 4 Trial Std Dev 9.6 4.1 1 0.4 0.3 1.1 0 0 0 0 CV% 11.9 4.5 1.9 2.8 2.6 6.7 . 0 0 0
Table 11: 2013 irrigated barley trial information Previous crop Dry bean in 2012
Plot size 6 ft. by 200 ft.
Number of reps 2
Fertilizer application
92 lb N/ac + 30 lb P2O5/ac on 04/24/13 based on soil test
recommendation for malting barley.
Planting rate 834,500 seeds/acre at 12-inch row spacing
Planting date 04/26/13
Pest control Curtail @ 2.5 pt/ac on 06/08/13, aerial spraying
Harvest date 08/29/13
Irrigation Irrigation applications with sideroll on 5/22, 6/17, 7/8, 7/11, and 7/26 for a total of approximately 14 inches gross
Rainfall 5.93 inches (Planting to harvest)
Comments Seed yield was below expectation due to drought and irrigation water shortage & scheduling. Seed yields of Moravian 139, 142, and 143 were similar and significantly more than the yield of Moravian 069. Grain protein content was above the acceptable range for malting barley (Table 12).
15 The results summary/table was provided by MillerCoors™.
16 Not including the awns.
17
1 = little to no straw breakdown, 2 = partial straw breakdown, 3 = complete straw breakdown. There wasn’t much plant material on the ground.
18 1 = all green. 2 = 50% green, 50% mature. 3 = mature (no green).
18
Table 12: Quality standards for malting barley as shown in Exhibit A of the purchase agreement with MillerCoors™ for the 2013 growing season.
19
2013 Dryland Barley Trial
20Table 13: Results of the 2013 dryland barley trial
21 22 23 24 25 Moravian 142 13.7 124 15.1 42.7 17.3 9.0 12.0 3.3 1.0 2.5 2.0 9.7 Moravian 139 13.1 118 25.2 44.2 17.6 9.2 12.7 6.7 1.0 2.5 2.7 9.3 Moravian 069 11.1 100 17.3 43.4 16.8 9.3 11.7 0.0 1.0 2.0 2.7 7.9 Moravian 143 9.7 87 49.2 45.0 17.5 9.1 12.0 20.0 1.0 1.8 2.7 6.9 Trial Mean 11.9 26.7 43.8 17.3 9.1 12.1 7.5 1.0 2.2 2.5 8.5 Trial Std Dev 2.1 14.3 1.0 0.4 0.2 0.8 12.2 0.0 0.3 0.5 CV% 17.7 53.6 2.2 2.1 1.7 6.6 162 0.0 15.5 20.9
Table 14: 2013 dryland barley trial information
Previous crop Summer fallow
Plot size 6 ft. by 200 ft.
Number of replications 3 Fertilizer application None
Planting rate 530,250 seeds/ac at 12-in row spacing
Planting date 05/02/13
Pest control Sprayed with 2,4-D Amine @ 1.0 pt/ac on 06/05/13
Harvest date 8/15/13
Rainfall 4.22 in from planting to harvest
Comments Seed yield was very low due dry conditions from February through mid-July. Grain plumpness was much below standard while grain protein was above the upper limit (14%) of acceptable grain protein for malt barley.
20 The results summary/table was provided by MillerCoors™.
21
Not including the awns.
22 1 = little to no straw breakdown, 2 = partial straw breakdown, 3 = complete straw breakdown. There wasn’t much
plant material on the ground. 23
1 = all green. 2 = 50% green, 50% mature. 3 = mature (no green).
24 1 = the head is standing straight up, 4 = the head is horizontal or lower.
25 This trial was planted on April 25 with the seeds planted at a depth of 2.5-3.0” to get it into the moist soil. Yield
20
Evaluation of Sunflower in Dryland Cropping Systems:
2011-2013 Results
Investigators: Abdel Berrada, Kim Dillivan26, and Bob Hammon27 This ongoing study has the following objectives:
Determine the effects of sunflower in rotation with other crops on: o Crop yield and quality (seed oil or protein concentration) o Soil moisture availability
o Nutrient (N & P) availability
Assess the agronomic and economic feasibility of various cropping systems The following crop rotations were tested:
Winter Wheat-Fallow
Winter Wheat-Safflower-Fallow Winter Wheat-Sunflower-Fallow
Winter Wheat-Dry Bean-Sunflower-Fallow Winter Wheat-Dry Bean-Dry Bean-Fallow
Winter Wheat-Opportunity Crop-Sunflower-Opportunity Crop. The opportunity crop was camelina in 2010 and 2011 and corn in 2012 and 2013.
The experiment is located at the Southwestern Colorado Research Center, which is near Yellow Jacket, CO. It was started in the spring of 2010. The 2010 results are not included in this summary since the site was irrigated for approximately 20 years before it was converted to dryland in the summer of 2009.
Yield by crop
Sunflower yielded 797 lb/ac in 2013 which is slightly above the 3-year average of 763 lb/ac (Table 15). The estimated average annual crop value of sunflower is $193.71/ac, which is below corn for grain, winter wheat, and safflower, but above the value of dry bean, corn for forage, and camelina.
Corn grown for grain in 2013 benefited from above average precipitation in August and September. It produced 3460 lb/ac with an estimated crop value of $444.80/ac. However, the yield of corn has been very unreliable and corn prices have been on the decline from their historic highs in 2012 and early 2013. In 2012—which was a very dry year—corn failed to produce much grain.
26 Former Director of Extension in Dolores County, CO.
21 Table 15: 2011-2013 crop yield and value
Crop 2011 yield (lb/ac) 2012 yield (lb/ac) 2013 yield (lb/ac) Average yield (lb/ac) Crop price ($/lb)28 Average crop value ($/ac) Corn for Grain - - 3460 3460 $ 0.1329 $ 444.80
Winter Wheat 2530 1741 1089 1787 $ 0.1330 $ 227.81
Safflower 1498 129 642 756 $ 0.28 $ 207.98
Sunflower 1063 428 797 763 $ 0.25 $ 193.71
Dry Bean 578 218 325 374 $ 0.39 $ 143.81
Corn for Forage - 1804 - 1804 $ 0.03 $ 60.99
Camelina 0 - - 0 $ 0.15 $ 0.00
Yield by crop rotation
The 2011 to 2013 average crop value and yield for each rotation are shown in Table 16. The results in the Table 16 assume that a fallow year has a crop value of $0/ac and a yield of 0 lb/bu. Crop rotations that included sunflower were more profitable than other crop rotations. The winter wheat-sunflower-fallow rotation did the best with an average yield of 862 lb/ac and an estimated profit of $23.53, followed by winter wheat-safflower-fallow ($18.78). The winter wheat-fallow rotation averaged 739 lb/ac and a modest profit of $12.99/ac. Winter wheat followed by two years of dry bean and one year of fallow had the lowest average crop yield and a loss of $13.93/ac. Winter wheat-Opportunity Crop-Sunflower-Fallow and Winter wheat-Dry bean-Sunflower-Fallow averaged around 736 and 777 lb/ac, respectively and similar crop value of $144/ac. The estimated profit from these 4-year crop rotations was below $10/ac.
Table 16: 2011-2013 average crop yield and profit for each crop rotation
Crop Rotation
Average yield (lb/ac)
Average crop value per year
($/ac)
Estimated profit per year
($/ac)
Winter Wheat-Fallow 739 $115.84 $12.99
Winter Wheat-Sunflower-Fallow 862 $152.37 $23.53
Winter Wheat-Safflower-Fallow 827 $139.96 $18.78
Winter Wheat-Opportunity
Crop-Sunflower-Fallow 736 $144.64 $9.75
Winter Wheat-Dry Bean-Sunflower-Fallow 777 $143.46 $3.71
Winter Wheat-Dry Bean-Dry Bean-Fallow 643 $123.73 ($13.92)
Average 758 $ 137.80 $7.55
28 Crop prices are from 2012 except for camelina (2011) and corn for forage (2011).
29 Converted from $/bushel using 56 lb/bu.
22
In 2013, sunflower did best when grown after winter wheat and averaged 1162 lb/ac yield (Table 17). When grown after dry bean, sunflower only yielded 551 lb/ac, which was unexpected. Dry bean did not do well in 2013 due to drought early in the season and hail during the second week of September. Dry bean after dry bean did poorly in 2013 and in previous years (Berrada, 2011 and 2012 CSU-AES Technical Reports TR 12-7 and 13-8).
Table 17. The effect of the previous year's crop on the yield of the 2013 crop.
2013 crop 2012 crop
Crop yield in 2013 (lb/ac)31
Sunflower Winter Wheat 1162
Corn for forage 677
Dry Bean 551
Safflower Winter Wheat 642
Winter Wheat Fallow 1089
Dry Bean Winter Wheat 375
Dry Bean 225
Corn Winter Wheat 3460
Pre-plant soil moisture availability
Plots that were seeded to winter wheat the previous year had the highest plant-available water at 2.6 in. in the top three feet of soil in the spring of 2013. In contrast, plots that were in dry bean or corn (harvested for forage) only had 1.8 and 1.7 in. of available soil moisture, respectively (Table 18). The difference may be due to the longer fallow period after wheat harvest than after dry bean or corn harvest.
In the fall of 2013, prior to winter wheat seeding, plots that were in sunflower or safflower in 2012 had 2.3 to 2.5 in. of available water in the top three feet of soil, compared with 3.1 to 3.3 in. in plots that were in dry bean or winter wheat in 2012 (Table 18). Overall, there was more soil moisture available in the fall (2.6 in.) than in the spring (2.3 in.) of 2013, probably due to the above average precipitation in August and September.
Pre-plant nitrate N
There was more than twice the nitrate N available in the soil in the fall than in the spring 2013 (Table 18). More nitrogen may have been mineralized during the long fallow period prior to wheat planting in the fall. The above average precipitation in August and September 2013 may have also contributed to greater N mineralization and possibly more N release from residual fertilizer; although no N fertilizer was applied in 2012 or 2013. Land following dry bean had greater nitrate N (65 lb ft) in the spring 2013 than land following winter wheat (24 lb N/ac-ft). Land following corn harvested for forage had 56 lb N/ac-N/ac-ft).
23
Fall 2013 soil nitrate N was highest in plots that were in dry bean in 2012 (120 lb/ac-ft),
followed by plots that were in sunflower (112 lb N/ac-ft on average) or safflower (105 lb N/ac-ft) and well ahead of plots that were in winter wheat (53 lb N/ac-ft). Winter wheat produced
approximately seven times more grain (in lb/ac) in 2012 than dry bean, safflower and sunflower on average, and thus may have taken up more nitrogen. Land that was in sunflower in 2012 and winter wheat in 2011 had a similar amount of nitrate N than land that was in dry bean two years in a row (Table 18), possibly due to low N fixation in addition to N removal by the low-yielding bean crops.
Table 18: Available soil water and nitrate-N in the spring and fall 2013
Sampling date 2012 crops 2011 crops
Available water (in.) in 0-3 ft. Available nitrate N (lb/ac.-ft.) Spring 2013 (plots to be planted to corn, dry bean, safflower or sunflower)
Winter wheat32 Fallow 2.7 24.0
Dry bean Winter wheat 1.9 65.5
Corn for forage Winter wheat 1.7 56.0
Average 2.3 40.4
Fall 2013 (plots to be planted to winter wheat)
Winter wheat32 Fallow 3.3 53.5
Dry bean Dry bean 3.1 120.0
Sunflower Dry bean 2.6 103.8
Sunflower Corn 2.3 109.5
Sunflower Winter wheat 2.1 123.2
Safflower Winter wheat 2.5 105.5
Average 2.6 102.6
After fallowing over the summer, average soil nitrogen levels more than doubled to 103 lb of N/acre by the fall of 2013. Plots that were in dry bean in 2012 still had the highest nitrogen level at 120 lb of N/acre. Plots that were in sunflower the previous year had a surprisingly high nitrogen level of 112 lb of N/acre.
After the land had fallowed over the summer, plant-available soil moisture from samples taken in the fall of 2013 had increased to 2.6” in the top three feet of soil. Plant-available soil moisture was still the highest in plots that were in winter wheat the previous year at 3.3”. Plots that were in sunflower in 2012 had the lowest amount of plant-available soil moisture at 2.3”. This may indicate that sunflower is more effective than the other crops at extracting water from the soil, but it also means that crops following sunflowers may not do as well particularly if it is a dry year.
24
Preliminary conclusion
In 2011-2013, growing two crops (winter wheat, safflower or sunflower) in three years
performed better than growing three crops in four years or one crop every other year. Sunflower did best in 2013 when it was grown after winter wheat than after corn or dry bean. Land that was in sunflower in 2012 had less available soil moisture at 0-3 ft. in the fall of 2013 than land that was in winter wheat or dry bean.
More testing and more detailed analyses, including the statistical significance of the main results, will be performed before making recommendations as to the feasibility dryland cropping systems that include sunflower in SW Colorado.
25
Boosting Sunflower Production in SW Colorado with
Supplemental Irrigation: 2013 Result Summary
Investigators: Abdel Berrada and Joel Schneekloth33 Sponsor: The National Sunflower Association
The main objective of this study was to determine the response of two sunflower hybrids to four irrigation treatments and three nitrogen (N) rates. Treatments I-1 and I-4 were similar in 2013 (Table 19) due to the short irrigation season. Also, only one N rate (60 lb N/ac) plus the unfertilized check were tested in 2013. The recommended rate based on soil test results and a yield goal of 2500 lb/ac was 55 lb N/ac.
Materials & Methods
The trial was conducted at the Southwestern Colorado Research Center near Yellow Jacket, CO. Plot size was 100 ft. long by 10 ft. (4 rows) wide. Spacing between drip tapes was 5 ft. with the first drip tape placed between sunflower rows 1 and 2 and the second drip tape placed between rows 3 and 4. The whole plot area was sprayed with Sonalan at 2.25 pt/ac on May 28. Additional weed control was accomplished with hand hoeing during the growing season.
Sunflower hybrids Mycogen 8H449CLDM and Triumph s870CL were planted on June 7, 2013 at 27,198 seeds/ac. The combination of dry weather in the spring (Figure 3) and lack of pre-plant irrigation resulted in a poor stand of sunflower. Post-planting irrigation applications with a sprinkler system did not improve plant emergence due to soil crusting. Irrigation of treatment I-2 (with the drip system) began on July 5. Dissolved Urea was applied through the drip system to the designated plots at 60 lb N/acre on July 11.
Treatments were arranged in a split-split plot design with three randomized complete blocs. Irrigation treatments were assigned to the main plots, sunflower hybrids to the split-plots, and N rates to the split-split plots.
Drip tape irrigation efficiency was assumed to be 90% and sideroll irrigation efficiency was assumed to be 70%. Precipitation and evapotranspiration data was retrieved from the website
www.coagmet.com . Irrigation plus precipitation matches crop ET fairly well except during the early part of the growing season (Figure 4).
Sunflower heads were harvested on October 23. Because the sunflower stand was poor and erratic, only areas of each plot where there was a relatively uniform stand were harvested. The heads were then threshed using a corn sheller and the seed was run through a seed cleaner twice in most cases and some of debris that remained was removed by hand.
26 Table 19: Irrigation treatments
Name Planned treatment
Net irrigation (in)1 Crop ET (in)2
I-1 Pre-planting irrigation only 3.7 17.4
I-2 Irrigate from planting until physiological maturity so that
irrigation plus precipitation equals evapotranspiration (ET). 9.9 18.9
I-3
Irrigate from the beginning of the R-1 growth stage to the end of the R-6 growth stage so that total irrigation plus
precipitation equals ET between those growth stages.
5.4 18.4
I-4 Irrigation from R-4 through R-6 to meet ET during this period 3.7 17.4
Season precipitation (rainfall) 9.3
1 There was no pre-planting irrigation. Several irrigations were applied, mostly with a sprinkler system, in the first
40 days after planting to try to improve emergence (to no avail) and to apply nitrogen fertilizer. There was no difference in irrigation application amount or timing between I-1 and I-4.
2 From planting to the end of R-8. No irrigation water was available after Sep. 10 due a severe drought from
September 2012 through June 2013.
Figure 3: Monthly precipitation at Yellow Jacket in 2012 and 2013
0.0 0.5 1.0 1.5 2.0 2.5 3.0 3.5 4.0 4.5 0.0 0.5 1.0 1.5 2.0 2.5 3.0 3.5 4.0 4.5
Jan Feb Mar Apr May Jun Jul Aug Sep Oct Nov Dec
In
ch
e
s
27
Figure 4: Evapotranspiration and applied water for the I-2 treatment
Results
Seed yields of Mycogen 8H449CLDM and Triumph s870HCL were similar at I-1 (Table 20) while Mycogen 8H449CLDM outperformed Triumph s870HCL at I-2 and I-3. On average, I-2 had the highest seed yield and plant height. Above average precipitation in August and
September (Figure 3) boosted sunflower seed yield but it was not enough to meet ET demand at I-1 and I-3. Moreover, there was substantial runoff in August and three hail storms in early September. The latter may have reduced seed yield of all the treatments.
A would be expected Mycogen 8H449CLDM had taller plants than Triumph s870HCL. It also had greater test weight.
There was no significant effect of N rate, N x Irrigation or N x Variety interaction on seed yield, test weight or plant height (data not shown).
The variety 8H449CLDM had higher seed oil content than s870CL. Differences in seed oil content between irrigation treatments and nitrogen treatments were not significant.
planting
7-Jun 27-Jun 17-Jul 6-Aug 26-Aug 15-Sep 5-Oct
p la n tin g… b eginn in g o f R -1… b egin n in g o f R-4… last d ay o f R -6… last d ay o f R -8… 0 5 10 15 20 In ch es
28
Table 20: Sunflower seed yield, test weight, and plant height in 2013
Irrigation treatment Sunflower variety Seed yield1 (lb/ac) Test weight (lb/bu) Plant height (in.) Seed Oil Content (%) I-1 8H449CLDM 1429 a2 29.4 29.3 44.3 s870CL 1599 a 26.4 23.2 42.8 I-2 8H449CLDM 3227 a 29.8 39.4 45.1 s870CL 2635 b 24.2 29.1 43.0 I-3 8H449CLDM 2022 a 30.4 30.9 45.1 s870CL 1297 b 26.8 20.4 42.4 I-1 1514 27.9 a 26.2 b 43.6 I-2 2931 27.0 b 34.2 a 44.1 I-3 1659 28.6 a 25.7 b 43.7 8H449CLDM 2226 29.8 a 33.2 a 44.8 a s870CL 1843 25.8 b 24.2 b 42.7 b
1 Seed yield was adjusted to 10% moisture.
2
29
Boosting Sunflower Production in SW Colorado with
Supplemental Irrigation: 2010-2012 Results
34Investigators: Abdel Berrada and Joel Schneekloth Sponsor: The National Sunflower Association
Abstract. A study was conducted in 2010-2012 in SW Colorado to quantify the response of
sunflower to water deficit. Water was applied pre-plant only (Pre-P), during the growing season (Full), at bud initiation through flowering (R1-6), or during flowering (R4-6). Another treatment was added to mimic irrigation with siderolls (Veg). The Full irrigation treatment outperformed the other treatments in 2010 and 2011 but was similar to R1-6 in 2011. Seed yields of Veg, R4-6 and R1-6 were similar in 2010 while R4-6 ≡ R1-6 in 2011. In 2012, Mycogen 8H449CLDM had greater seed yield than the short stature hybrid Triumph s870HCL, except at Full. The latter is more suitable to irrigation with siderolls, which are prevalent in SW Colorado. Irrigation plus rain closely matched sunflower ET at Full. Season rainfall was greatest in 2010, with 3.3 in. recorded in August. Precipitation use efficiency was generally highest with Pre-P and lowest with Full. In contrast, seed oil content of Full was significantly more than that of the other treatments. The treatment that received little or no irrigation after planting (Pre-P) had the lowest seed oil content in 2010 and especially in 2011. Full irrigation and Veg had the tallest plants while Pre-P and R4-6 had the shortest plants. Applying water mostly during bloom did not affect seed yield or oil content in 2010 and 2011 compared to R1-6. Substantial water conservation and use efficiency can be achieved with limited but targeted irrigation of sunflower.
Keywords. Sunflower, irrigation scheduling, seed yield, oil content, plant height.
Introduction
Contrary to popular belief, sunflower may use as much or more water than other field crops such as corn to produce maximum yield (Meyer at al., 2009). With its deep taproot (Stone, 2002), sunflower can extract water down to 7 or 8 ft., thus reducing the need for additional water from rain or irrigation to meet evapotranspiration (ET).
At Akron, CO, Nielsen (2007) derived the following response of sunflower to irrigation: Yield (lb/acre) = 150.6*(inches water use – 6.9)
Seed production started at 6.9 in. of water consumption. Each additional inch of water produced approximately 151 lb/acre.
Long-term average precipitation from May through September in Yellow Jacket is 6.7 in. Assuming 6.0 in. of effective rainfall during the growing season and 4.0 in. of available soil
34
This paper was published in the Proceedings of the 2013 Irrigation & Education Conference in Austin, TX and listed as: “Berrada, A., and J. Schneekloth. 2013. Response of sunflower to deficit irrigation. 2013 Irrigation Show, 4-8 Nov. 2013, Austin, TX. Irrigation Association, Falls Church, VA.
30
moisture at planting, it would take an additional 2.2 in. of water to produce 800 lb/acre of sunflower seeds, which was about the average dryland yield in SW Colorado in 2006-2008. It would take another 5.3 in. to double the yield.
Sunflower is most sensitive to water stress “just before flowering through seed development” (Meyer et al., 2009). Schneekloth (2007) achieved 60% water saving compared to full irrigation when he applied water at the R-4 to R-5 stage. Seed and oil yields were equal or higher to those obtained with full irrigation in two (2003 and 2005) out of the four-year period (2002-2005) of the study. There was plenty soil moisture (field capacity in 0- to 6-ft) at planting in 2002 and 2003. When there was less water available at planting or during the growing season, full
irrigation outperformed the limited irrigation treatments. Withholding irrigation until R-6 to R-7 increased oil concentration significantly compared to full irrigation. Conversely, applying water at R-1 to R-3 (bud stage) only reduced seed oil concentration. Seed yield was similar to that of when irrigation was withheld until R-6 to R-7.
The area where this study was conducted is within the Dolores Irrigation Project, which provides irrigation water to approximately 62,000 acres of crop land in Dolores and Montezuma counties. Pressurized water of excellent quality is delivered to each farm in the full service area (FSA) of the project. Each farmer is allocated close to 2.0 acre feet of water per season. The total FSA annual water allocation was reached or exceeded several times since irrigation began in 1987. Reasons for this include frequent droughts and the predominance of alfalfa (> 80% of the irrigated acreage), which is a high water user. Wheel-line sprinkler systems (siderolls) prevail in the FSA. The price FSA irrigators pay for water has been on the rise due to increases in pumping and maintenance costs. Thus conserving water and enhancing its efficiency is important to the long-term sustainability of the FSA.
Alfalfa fields are usually planted to dry bean, oat or spring wheat for one to two years before reseeding it to alfalfa. Sunflower would be a good crop to plant after alfalfa e.g., to mine the residual water and nitrogen that may be available beyond the reach of dry bean or spring cereals. Moreover, it appears that sunflower responds well to deficit irrigation.
The main objective of this study was to determine the response of sunflower to irrigation deficit.
Materials and Methods
A field trial was conducted at the Southwestern Colorado Research Center in Yellow Jacket, CO in 2010, 2011, and 2012. The soil at the study site is Wetherill loam (fine-silty, mixed,
superactive, mesic Aridic Haplustalfs). Normal annual precipitation is 15.9 in., with June being the driest month (0.5 in.), and Aug., Sept., and Oct. the wettest months (1.7 to 1.9 in.). The elevation at the site is 6900 ft. Approximately 40% of the annual precipitation comes from snow. Sunflower planting dates and irrigation scheduling are shown in Table 21 and Table 22,
respectively. Sunflower was planted in 30-in rows with a 4-row Monosem NG Vacuum Planter. Row length varied from 50 to 100 ft. The two middle rows were harvested in full or partially for yield estimates. There were four replications in 2010 and 2011 and three in 2012.
31 Table 21: Sunflower planting dates and rates.
2010 2011 2012
Sunflower hybrid Mycogen
8H449CLDM Mycogen 8H449CLDM Mycogen 8H449CLDM Triumph s870HCL
Planting date 4-Jun 1-Jun 1-Jun 1-Jun
Planting rate (seeds/acre) 15,488 &
22,082 22,082 25,344 25,344
Harvest date 11-Nov Oct. 17-20 Oct. 31 & Nov. 1 Table 22: Irrigation treatments and amounts.
Irrigation
treatment Description
Net post-planting irrigation depth (in.)1
2010 20112 2012
Pre-P Pre-plant irrigation (PPI) only 0.0 2.5 0.0
Full PPI + Full-season irrigation3 11.4 18.1 16.2
R1-6 PPI+ Irrigation at R-1 to R-63 3.1 11.7 8.7
R4-6 PPI + Irrigation at R-4 to R-63 2.6 7.2 4.5
Veg PPI + Sideroll Irrigation4 6.6 4.9 NA
PPI (with sideroll) 1.8 0.8 2.5
Rainfall 7.1 4.2 4.4
Full irrigation treatment crop ET 19.8 21.9 20.5
1 Depth of irrigation after planting. Post-planting water was applied with subsurface drip irrigation (SDI) at
approximately 90% efficiency. 2
Two irrigations were applied early in the season to all the treatments to enhance seed germination and seedling emergence.
3 Irrigation to meet crop ET during the designated treatment period. R-1: The terminal bud forms a miniature floral
head, R-4: The inflorescence begins to open, R-6: Flowering is complete. 4
Treatment to mimic irrigation with sideroll. Irrigation is terminated when sunflower interferes with the movement of the sideroll, which usually occurs at R-1 for standard-height sunflower.
Results and Discussion
Irrigation scheduling had a significant impact on seed yield, oil yield, and plant height. The full irrigation treatment (Full) produced the highest seed yield of approximately 3000 lb/acre while pre-plant irrigation only (Pre-P) produced the lowest yield of 2334 lb/acre (Figure 5). Treatments R1-6 and R4-6 received a total of 3.1 and 2.6 in. of net irrigation amount (in addition to pre-plant irrigation), respectively, which is about half the amount (6.6 in) received by Veg and yet, all three treatments had similar yields of approximately 2600 lb/acre. The sideroll-alike treatment (Veg) received most of the irrigation water during the mid-vegetative to early reproductive growth stages or until sunflower plants were too tall to irrigate with the sideroll.
In general, sunflower production in 2010 was enhanced by good water availability at planting and timely and above average rainfall during the reproductive growth stages. Precipitation use efficiency (lb of seeds/in. of rain plus irrigation) was highest at Pre-P and lowest at Full and Veg
32
(Figure 5). R4-6 and R1-6 had similar precipitation use efficiencies of around 280 lb/in. The Full treatment had the highest seed oil content, significantly more than the other irrigation treatments, although the range in seed oil content values (39.9 to 41.3%) was small (Figure 9). The Full and Veg treatments had the tallest plants on average, followed by R1-6. Pre-P and R4-6 had similar plant height of 55 in. (Figure 12).
Increasing seeding rate from 15,488 to 22,082 seeds/acre increased seed yield by only 121 lb/acre on average (Data not shown). A larger increase (454 lb/acre) was observed at R4-6.
Irrigation treatments that received water during reproductive growth (Full, R4-6, and R1-6) outperformed Pre-P and Veg (Figure 6). The Full irrigation treatment and R1-6 produced around 3100 lb seeds/acre while R4-6 averaged 2878 lb/acre. The pre-plant irrigation treatment had the lowest yield (1854 lb/acre) followed closely by Veg. All the treatments received 2.5 in. of irrigation water shortly after planting due to dry conditions at planting. Precipitation use efficiency was highest with Pre-P and R4-6 and lowest with Full (Figure 6).
Seed oil content increased in a near linear fashion with increasing irrigation amounts (Figure 10). The Full irrigation regime averaged 41.3% followed by R1-6 and R4-6. The Pre-P treatment lagged behind with 37.5%. Sunflower plants averaged 45.7 in. in height with Pre-P and R4-6 and 51.4 in. with the other treatments. As in 2010, restricting irrigation mostly to the flowering period (R4-6) reduced plant height but it did not negatively impact seed yield or oil content when compared with R1-6.
Seed yield increased significantly with increasing irrigation amounts (Figure 7). Mycogen H449CLDM outperformed Triumph s870HCL at all irrigation levels, except at Full. Mycogen H449CLDM had higher precipitation use efficiency (PUE) at Pre-P and R4-6 and similar PUE at R1-6 and Full (Figure 8).
On average, Full had the highest seed oil content of 43.8%, significantly more than that of R4-6 and R1-6. Treatment Pre-P had the lowest seed oil content of 41.7% (Figure 11). Mycogen 8H449CLDM and Triumph s870HCL averaged 43.2% and 41.9%, respectively. Plants of both hybrids were tallest at Full followed by R1-6. Treatments R4-6 and Pre-P had similar plant heights (Figure 14). As would be expect, s870HCL was much shorter than 8H449CLDM.
Conclusion
The full irrigation treatment outperformed the other treatments in 2010 and 2011 but was similar to R1-6 in 2011. Seed yields of Veg, R4-6 and R1-6 were similar in 2010 while R4-6 ≡ R1-6 in 2011, at P=0.05. In 2012, Mycogen 8H449CLDM had greater seed yield than the short stature hybrid Triumph s870HCL, except at Full. Mycogen 8H449CLDM appears to respond better to deficit irrigation than Triumph s870HCL, possibly due to its more extensive root system. The latter is more suitable to irrigation with siderolls, which are prevalent in SW Colorado.
33
with 3.3 in. recorded in August (Figure 15). Precipitation use efficiency was generally highest with Pre-P and lowest with Full. In contrast, seed oil content of Full was significantly more than that of the other treatments. The treatment that received little or no irrigation after planting (Pre-P) had the lowest seed oil content in 2010 and especially in 2011. The full irrigation and the sideroll-alike (Veg) treatments had the tallest plants while Pre-P and R4-6 had the shortest plants. Applying water mostly during bloom did not affect seed yield or oil content in 2010 and 2011 compared to R1-6.
Literature Cited
Meyer, R., D. Belshe, J. Falk, S. Patten, and D. O’Brien. 2009. High Plains Sunflower Production Handbook. MF-2384, Kansas State Univ. Agric. Exp. Sta. & Coop. Ext. Service. David Nielsen. Estimated yield of some alternative crops under varying irrigation in Northeast Colorado. Agronomy News 26 (1): 8-9, April 2007, Colorado State University, Ft. Collins. Joel Schneekloth. Yield impact of growth stage irrigation of sunflowers. Agronomy News 26 (1): 10-11, April 2007, Colorado State University, Ft. Collins.
Stone, L.R., D.E. Goodrum, A.J. Schlegel, M.N. Jaafar, and A. H. Khan. 2002. Water depletion depth of grain sorghum and sunflower in the central high plains. Agron. J. 94: 936-943.
Acknowledgments
This study was sponsored by the National Sunflower Association with additional support from Colorado State University Agricultural Experiment Station.
34 Figure 5: Seed yield and precipitation use
efficiency (PUE) in 2010 as affected by irrigation scheduling
Figure 6: Seed yield and precipitation use efficiency (PUE) in 2011 as affected by irrigation scheduling
Figure 7: Seed yield of two sunflower hybrids in 2012 as affected by irrigation scheduling
Figure 8: Precipitation use efficiency (PUE) of two sunflower hybrids in 2012 as affected by irrigation scheduling 100 150 200 250 300 350 400 800 1200 1600 2000 2400 2800 3200
Pre-P Veg R4-6 R1-6 Full
lb see d s/ in . w ate r Se ed Yi el d ( lb /a cr e) Irrigation Treatment
Seed Yield PUE
100 150 200 250 300 350 400 800 1200 1600 2000 2400 2800 3200
Pre-P Veg R4-6 R1-6 Full
lb s ee d s/ in . w ater Se ed Yi el d ( lb /a cr e) Irrigation Treatment
Seed Yield PUE
500 1000 1500 2000 2500 3000 Pre-P R4-6 R1-6 Full Se e d Yi e d l ( lb /a cr e ) Irrigation Treatment 8H449CLDM s870HCL 100 150 200 250 300 350 400 Pre-P R4-6 R1-6 Full lb s e e d s/ in . w ater Irrigation Treatment PUE s870 PUE 8H449
35 Figure 9: Oil content of sunflower hybrid
8H449CLDM in 2010 as affected by irrigation scheduling
Figure 10: Oil content of sunflower hybrid 8H449CLDM in 2011 as affected by irrigation scheduling 39.9 40.4 40.6 40.4 41.3 33 36 39 42 45
Pre-P Veg R4-6 R1-6 Full
O il Co n te n t (%) Irrigation Treatment 37.5 38.7 40.2 40.7 41.3 33 36 39 42 45
Pre-P Veg R4-6 R1-6 Full
Oil C o n ten t (%) Irrigation Treatment
36 Figure 11: Oil content of two sunflower hybrids
in 2012 as affected by irrigation scheduling
Figure 12: Plant height of sunflower hybrid 8H449CLDM in 2010 as affected by irrigation scheduling
Figure 13: Plant height of sunflower hybrid 8H449CLDM in 2011 as affected by irrigation scheduling
Figure 14: Plant height of two sunflower hybrids in 2012 as affected by irrigation scheduling 42.2 43.0 43.0 44.6 41.2 42.1 41.4 43.0 33 36 39 42 45 Pre-P R4-6 R1-6 Full Oi l C o ntent (%) Irrigation Treatment 8H449CLDM s870HCL 55 64 55 58 64 15 25 35 45 55 65
Pre-P Veg R4-6 R1-6 Full
Pl an t He ig h t (i n .) Irrigation Treatment 46 52 46 51 52 15 25 35 45 55 65
Pre-P Veg R4-6 R1-6 Full
Pl an t He ig h t (i n .) Irrigation Treatment 33 31 42 56 20 20 31 33 15 25 35 45 55 65 Pre-P R4-6 R1-6 Full Pl an t He ig h t (i n ) Irrigation Treatment 8H449CLDM s870HCL
37
Figure 15: Rainfall in May through September at the study site 0.0 0.5 1.0 1.5 2.0 2.5 3.0 3.5
May Jun Jul Aug Sep Oct
R ai n fal l (i n .) 2010 2011 2012 30-yr
38
Agronomic Responses to Partial and Full Season Fallowing
of Alfalfa and Grass Hayfields
Lyndsay Jones35, Joe Brummer36, Calvin Pearson37, and Abdel Berrada
The Colorado River is managed under several acts and federal laws dating back to The Colorado River Compact of 1922. Over the years, numerous acts, agreements, and treaties have altered the way the river is managed. The act of 1922 separated the seven states involved into the upper basin and lower basin. Each basin is allowed 7.5 million-acre feet (MAF) of the river’s annual flow. In 1944, a treaty stated that Mexico was also entitled to receive 1.5 MAF. Colorado legally utilizes just over 50% of the 7.5 MAF allocated to the upper basin. The western slope of
Colorado alone, accounts for close to 1.3 MAF of the rivers annual flow. Although insufficient amounts of water were not a critical factor in the past, in recent years, a combination of drought, increased development, and growing populations have increased pressure on river resources. Since the upper basin must legally send 7.5 MAF of water to the lower basin, water shortages are a growing concern. One possible approach to this issue that is gaining interest is a water-banking system where water would be taken out of agricultural production to free up water to meet compact obligations and/or be leased for other uses.
Colorado State University is currently working on a research study meant to assess the
agronomic feasibility of drying up hayfields as part of a Western-Slope Waterbank. This study hopes to provide enough information for local hay producers to confirm if this approach is worth pursuing. More specifically, this project is intended to determine the impacts to forage yield, quality, and associated recovery period for fallowed and partially fallowed hayfields on the Western Slope.
The experiment includes side-by-side fallowing treatments of three alfalfa hayfields and four grass hayfields located on the Western Slope. Treatments on the alfalfa sites include fully irrigated (control), stop irrigating after the first cutting, and stop irrigating after the second cutting. One alfalfa site also included a complete fallow (no irrigation) treatment. The grass sites include a fully irrigated treatment and a full season fallow, or non-irrigated treatment.
Test sites are spread throughout the Western Slope including the Yampa River basin, the Upper Gunnison River basin, the Upper and Lower Colorado River basins, and the San Juan/Dolores River basin. Grass sites are located at the Carpenter Ranch near Hayden, CO, the Fetcher Ranch near Steamboat Lake, CO, the Trampe Ranch near Gunnison, CO, and the Blue Valley Ranch near Kremmling, CO. Alfalfa sites include the Kehmeier Farm near Eckert, CO, the Western CO Research Center near Fruita, CO, and the Southwestern CO Research Center near Yellow Jacket, CO.
Measurements and data collected will determine impacts to forage yield and quality (crude protein, neutral detergent fiber (NDF), and NDF digestibility), changes in species composition in
35 Graduate student in Soil & Crop Sciences at Colorado State University, Ft. Collins, CO.
36 Associate Professor/Forage Specialist, Colorado State University, Ft. Collins, CO.