JHEP08(2016)009
Published for SISSA by SpringerReceived: June 7, 2016 Accepted: July 18, 2016 Published: August 1, 2016
Measurement of the double-differential high-mass
Drell-Yan cross section in pp collisions at
√
s = 8 TeV
with the ATLAS detector
The ATLAS collaboration
E-mail:
atlas.publications@cern.ch
Abstract: This paper presents a measurement of the double-differential cross section
for the Drell-Yan Z/γ
∗→ `
+`
−and photon-induced γγ → `
+`
−processes where ` is an
electron or muon. The measurement is performed for invariant masses of the lepton pairs,
m
``, between 116 GeV and 1500 GeV using a sample of 20.3 fb
−1of pp collisions data at
centre-of-mass energy of
√
s = 8 TeV collected by the ATLAS detector at the LHC in 2012.
The data are presented double differentially in invariant mass and absolute dilepton rapidity
as well as in invariant mass and absolute pseudorapidity separation of the lepton pair. The
single-differential cross section as a function of m
``is also reported. The electron and muon
channel measurements are combined and a total experimental precision of better than 1%
is achieved at low m
``. A comparison to next-to-next-to-leading order perturbative QCD
predictions using several recent parton distribution functions and including next-to-leading
order electroweak effects indicates the potential of the data to constrain parton distribution
functions. In particular, a large impact of the data on the photon PDF is demonstrated.
Keywords: Hadron-Hadron scattering (experiments)
ArXiv ePrint:
1606.01736
JHEP08(2016)009
Contents
1
Introduction
2
2
ATLAS detector
3
3
Simulated event samples
4
4
Event selection
5
4.1
Electron channel
5
4.2
Muon channel
6
5
Background estimate
7
5.1
Multijet and W +jets background estimate in the electron channel
7
5.2
Multijet and W +jets background estimate in the muon channel
11
6
Cross-section measurement
12
7
Systematic uncertainties
13
7.1
Electron channel
13
7.1.1
Multijet and W +jets background
14
7.1.2
Energy scale and resolution
15
7.1.3
Reconstruction, identification and isolation efficiency
15
7.1.4
Trigger efficiency
16
7.2
Muon channel
16
7.2.1
Reconstruction efficiency
16
7.2.2
Momentum scale and resolution
16
7.2.3
Isolation and impact parameter efficiency
16
7.2.4
Multijet and W +jets background
16
7.2.5
Trigger efficiency
17
7.3
Systematic uncertainties common to both channels
17
7.3.1
Top and diboson background
17
7.3.2
Luminosity
18
7.3.3
MC statistics and MC modelling
18
7.3.4
Bin-by-bin correction
18
7.3.5
PDF uncertainty
18
8
Results
18
9
Comparison to theoretical predictions
26
10 Conclusion
32
JHEP08(2016)009
The ATLAS collaboration
44
1
Introduction
The Drell-Yan (DY) process [
1
] of lepton pair production in hadronic interactions, pp →
Z/γ
∗+ X with Z/γ
∗→ `
+`
−, is a powerful tool in understanding the nature of partonic
interactions and of hadronic structure in detail. The study of this process has been
fun-damental in developing theoretical perturbative calculations of quantum chromodynamics
(QCD) which are now performed at next-to-next-to-leading-order (NNLO) accuracy [
2
–
5
]. Measurements from the Large Hadron Collider (LHC) of neutral- and charged-current
Drell-Yan processes mediated by Z/γ
∗and W exchange respectively at centre-of-mass
energies of
√
s = 7 TeV and 8 TeV have been recently published by the ATLAS [
6
–
8
],
CMS [
9
–
12
] and LHCb [
13
–
17
] collaborations. These data provide new constraints on the
parton distribution functions (PDFs) of the proton, some of which have been used in recent
global PDF fits [
18
–
20
].
Although on-shell Z and W boson measurements provide the greatest experimental
precision, they are restricted in the kinematic range of partonic momentum fraction x,
and four-momentum transfer Q = m
``, the invariant mass of the dilepton pair.
Off-shell measurements provide complementary constraints in a wider range of x and Q. In
the neutral-current case, the off-shell measurements are dominated by the electromagnetic
quark couplings to the virtual photon γ
∗, whereas the on-shell measurements are dominated
by the weak axial and vector couplings of the quarks to the Z boson. Therefore, the
measurements have different sensitivity to the up-type and down-type quarks. At large m
``the measurements offer constraints on the large-x antiquark PDFs which are poorly known.
In addition, off-shell measurements may also be sensitive to the largely unconstrained
photon PDF [
7
,
8
,
21
,
22
] through the photon-induced (PI) process γγ → `
+`
−.
Neutral-current DY data at higher masses can also be used to determine the running of
the electroweak (EW) gauge couplings above the weak scale, and to set model-independent
limits on new states with electroweak quantum numbers [
23
]. In particular, at the highest
invariant masses accessible at the LHC, the observed dilepton spectrum may be sensitive to
new physics, which could manifest itself as a resonance or a broad modification to the
con-tinuum spectrum. Such searches performed by the ATLAS and CMS experiments [
24
–
26
]
have so far not found any significant deviations from the Standard Model, and the largest
systematic uncertainty on the derived exclusion limits arises from the lack of knowledge
of the PDFs at high x. Since at leading order the parton momentum fractions from the
two protons (1 or 2) are given by x
1,2= (m
``/
√
s) e
±y``, where y
``
is the dilepton
rapid-ity, it can be seen that the large x region is accessible at large m
``in the case of central
production (y
``= 0), as well as at lower m
``and large y
``. Therefore, a double-differential
measurement of the Drell-Yan cross section in m
``and y
``provides PDF constraints in a
new kinematic region which is expected to be unaffected by the manifestation of potential
new physics at the highest invariant mass.
JHEP08(2016)009
This article reports two inclusive double-differential cross-section measurements for
the process pp → `
+`
−+ X. The first measurement is reported as a function of m
``and
absolute dilepton rapidity |y
``|, and the second as a function of m
``and absolute dilepton
pseudorapidity separation |∆η
``|. These measurements are sensitive to the proton PDFs,
the PI process, and higher-order electroweak corrections, which have different kinematic
dependencies. In particular, the t-channel PI process is expected to contribute at large
|∆η
``|, small |y
``| and large m
``. Therefore, measurements as a function of various kinematic
distributions are needed to disentangle the different contributions [
27
]. For completeness
the inclusive single-differential measurement dσ/dm
``is also provided. The measurements
are performed using pp collision data collected at
√
s = 8 TeV in both electron and muon
channels. The data cover the kinematic region of 116 ≤ m
``≤ 1500 GeV and access
partonic momentum fractions from 10
−3up to x ∼ 1. The integrated luminosity of the data
sample is 20.3 fb
−1, a factor five larger than used in the previous ATLAS measurement [
7
]
at
√
s = 7 TeV performed in the electron channel only. Therefore, the results reported here
have a substantially better precision than earlier results.
2
ATLAS detector
The ATLAS detector [
28
] consists of an inner tracking detector (ID) surrounded by a thin
superconducting solenoid, electromagnetic and hadronic calorimeters, and a muon
spec-trometer (MS). Charged particles in the pseudorapidity
1range |η| < 2.5 are reconstructed
with the ID, which consists of layers of silicon pixel and microstrip detectors and a
straw-tube transition-radiation tracker having coverage within |η| < 2.0. The ID is immersed
in a 2 T magnetic field provided by the solenoid. The latter is surrounded by a hermetic
calorimeter that covers |η| < 4.9 and provides three-dimensional reconstruction of particle
showers. The electromagnetic calorimeter is a liquid-argon sampling calorimeter, which
uses lead absorbers for |η| < 3.2 and copper absorbers in the very forward region. The
hadronic sampling calorimeter uses plastic scintillator tiles as the active material and steel
absorbers in the region |η| < 1.7. In the region 1.5 < |η| < 4.9, liquid argon is used as active
material, with copper or/and tungsten absorbers. Outside the calorimeters, air-core toroids
supply the magnetic field for the MS. There, three stations of precision chambers allow the
accurate measurement of muon track curvature in the region |η| < 2.7. The majority of
these precision chambers are composed of drift tubes, while cathode-strip chambers provide
coverage in the inner stations of the forward region for 2.0 < |η| < 2.7. Additional muon
chambers installed between the inner and middle stations of the forward region and
com-missioned prior to the 2012 run improve measurements in the transition region of 1.05 <
|η| < 1.35 where the outer stations have no coverage. Muon triggering is possible in the
range |η| < 2.4, using resistive-plate chambers in the central region that also provide a
mea-1
ATLAS uses a right-handed coordinate system with its origin at the nominal interaction point in the centre of the detector and the z-axis along the beam pipe. The x-axis points from the interaction point to the centre of the LHC ring, and the y-axis points upward. Cylindrical coordinates (r, φ) are used in the transverse plane, φ being the azimuthal angle around the beam pipe. The pseudorapidity is defined in terms of the polar angle θ as η = − ln tan(θ/2).
JHEP08(2016)009
surement of the coordinate out of the bending plane, and thin-gap chambers in the forward
region. A three-level trigger system [
29
] selects events to be recorded for offline analysis.
3
Simulated event samples
Monte Carlo (MC) simulation samples are used to model the expected signal and
back-ground yields, with the exception of certain data-driven backback-ground estimates. The MC
samples are normalised using the highest-order cross-section predictions available in
per-turbation theory.
The DY process is generated at next-to-leading order (NLO) using Powheg [
30
–
33
]
and the CT10 PDF [
34
], with Pythia 8 [
35
] to model parton showering and hadronisation.
To estimate systematic uncertainties in the event modelling an alternative sample is
sim-ulated using the same PDF but the MC@NLO [
36
–
38
] generator with Herwig++ [
39
].
The Z/γ
∗differential cross section as a function of mass has been calculated at
next-to-next-to-leading order (NNLO) in perturbative QCD (pQCD) using FEWZ 3.1 [
5
,
40
,
41
]
with the MSTW2008NNLO PDF [
42
]. The calculation includes NLO electroweak (EW)
corrections beyond final-state photon radiation (FSR). A mass-dependent K-factor used
to scale the Z/γ
∗MC sample is obtained from the ratio of the calculated NNLO pQCD
cross section with the additional EW corrections, to the cross section from the Powheg
sample. It is found to deviate from unity by 3.5–2.0% across the measured range in m
``.
The photon-induced (PI) process, γγ → `
+`
−, is simulated at leading-order using
Pythia 8 and the MRST2004qed PDF [
21
]. The MC yield is scaled by a factor of 0.7 in
order to match the NLO calculations of SANC [
43
,
44
].
The background from t¯
t production is the dominant background with isolated prompt
leptons from electroweak boson decays. It is estimated at NLO using Powheg and the
CT10 PDF, with Pythia 6 [
45
] for parton showering and hadronisation. Two further MC
samples for t¯
t and single top (W t) production in association with a W boson are modelled
by MC@NLO and the CT10 PDF, with Herwig [
46
,
47
] for parton showering and
hadro-nisation. The MC@NLO t¯t sample is used for estimating systematic uncertainties only.
The t¯
t MC samples are normalised to a cross section of σ
t¯t= 253
+13−15pb for a top-quark
mass of 172.5 GeV. This is calculated at NNLO in QCD including resummation of
next-to-next-to-leading logarithmic soft-gluon terms with Top++2.0 [
48
–
53
]. The PDF and α
Suncertainties on the t¯
t cross section are calculated using the PDF4LHC prescription [
54
]
with the MSTW2008 68% CL NNLO [
42
,
55
], CT10 NNLO [
34
,
56
] and NNPDF2.3 [
57
]
PDF error sets added in quadrature to the scale uncertainty. Varying the top-quark mass
by ±1 GeV leads to an additional systematic uncertainty of +8 pb and –7 pb, which is also
added in quadrature. The single-top background in association with a W boson has a cross
section of σ
W t= 22.4 ± 1.5 pb [
58
]. Given that the W t contribution is small compared to
the t¯
t cross section, an overall uncertainty of 6% is estimated on the top-quark background.
Further important background contributions are due to diboson (W W , W Z and ZZ)
production with decays to final states with at least two leptons. The diboson processes
are generated at leading order (LO) with Herwig, using the CTEQ6L1 PDF [
59
]. The
W Z and ZZ cross-section values used are 20.3 ± 0.8 pb and 7.2 ± 0.3 pb respectively, as
JHEP08(2016)009
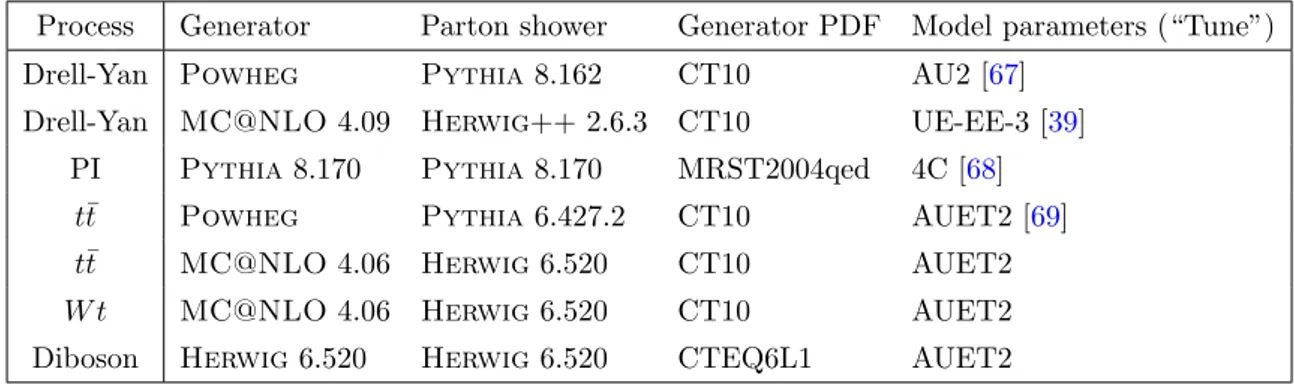
Process Generator Parton shower Generator PDF Model parameters (“Tune”)Drell-Yan Powheg Pythia 8.162 CT10 AU2 [67] Drell-Yan MC@NLO 4.09 Herwig++ 2.6.3 CT10 UE-EE-3 [39]
PI Pythia 8.170 Pythia 8.170 MRST2004qed 4C [68] t¯t Powheg Pythia 6.427.2 CT10 AUET2 [69]
t¯t MC@NLO 4.06 Herwig 6.520 CT10 AUET2
W t MC@NLO 4.06 Herwig 6.520 CT10 AUET2
Diboson Herwig 6.520 Herwig 6.520 CTEQ6L1 AUET2 Table 1. Overview of simulated event samples used.
calculated at NLO with MCFM [
60
,
61
] and the CT10 PDF. The W W cross section is
assumed to be 70.4 ± 7 pb, derived by scaling the MCFM value of 58.7 pb by a factor of
1.20 ± 0.12. This scale factor and its uncertainty correspond to an approximate mean of the
two scale factors for W W production with zero and one extra jet, as discussed in ref. [
62
].
They are consistent with the recent ATLAS measurement of the W W cross section at
√
s = 8 TeV, which yields a value of 71.1 ± 1.1 (stat)
+5.7−5.0(sys) ±1.4 pb [
63
].
All MC samples used in the analysis include the effects of FSR, multiple interactions per
bunch crossing (“pile-up”) , and detector simulation. FSR is simulated using Photos [
64
],
except for samples hadronised by Herwig++ which includes a native FSR simulation.
The effects of pile-up are accounted for by overlaying simulated minimum-bias events [
65
].
The interactions of particles with the detector are modelled using a full ATLAS detector
simulation [
65
] based on Geant4 [
66
].
Finally, several corrections are applied to the
simulated samples, accounting for differences between data and simulation in the lepton
trigger, reconstruction, identification, and isolation efficiencies as well as lepton resolution
and muon momentum scale.
An overview of the simulated event samples is given in table
1
.
4
Event selection
Events are required to be recorded during stable beam condition periods and must pass
detector and data-quality requirements. Due to differences in the detector response to
electrons and muons the selection is optimised separately for each channel and is described
in the following.
4.1
Electron channel
The electron data are collected by a trigger which uses calorimetric information to identify
two compact electromagnetic energy depositions. Identification algorithms use calorimeter
shower shape information to find candidate electron pairs with a minimum transverse
energy of 35 GeV and 25 GeV for the leading and subleading electron. The candidate
electron pairs are not matched to inner detector tracks in the trigger allowing the same
trigger to be used for the multijet and W +jets data-driven background estimation studies,
where a background-enriched sample is required.
JHEP08(2016)009
Electrons are reconstructed by clustering energy deposits in the electromagnetic
calorimeter using a sliding-window algorithm. These clusters are then matched to tracks
reconstructed in the inner detector. The calorimeter provides the energy measurement and
the track is used to determine the angular information of the electron trajectory. An energy
scale correction determined from Z → e
+e
−, W → eν, and J/ψ → e
+e
−decays [
70
] is
ap-plied to data. Candidates are required to have a pseudorapidity within the inner detector
tracking region, |η
e| < 2.47, excluding a region, 1.37 < |η
e| < 1.52, where the transition
between the barrel and endcap electromagnetic calorimeters is not well modelled in the
sim-ulation. Each candidate is required to satisfy the “medium” electron identification [
71
,
72
]
criteria based on calorimetric shower shapes and track parameters.
Leptons produced in the Drell-Yan process are expected to be well isolated from energy
depositions not associated with the lepton. The degree of isolation for electrons is defined
as the scalar sum of transverse energy,
P E
T, of additional energy contained in a cone of
size ∆R =
p(∆φ)
2+ (∆η)
2around the electron, omitting the electron transverse energy
E
Te. This calorimetric isolation is required to satisfy
P E
T(∆R = 0.4) < 0.007 · E
Te+ 5 GeV
for the leading electron, and
P E
T(∆R = 0.4) < 0.022 · E
Te+ 6 GeV for the subleading
electron, in order to retain a high efficiency of approximately 99% per electron over a large
range in E
eT
.
Candidate events are required to have at least two electrons with E
Te> 30 GeV and
at least one of the electrons satisfying E
Te> 40 GeV to ensure the selected electron is on
the efficiency plateau of the trigger. The invariant mass of the pair is required to be in
the range 116 ≤ m
ee≤ 1500 GeV. The absolute difference in pseudorapidity between the
two electrons, |∆η
ee|, is restricted to be less than 3.5 in order to suppress the multijet
background which is dominated by t-channel processes. No charge requirements are placed
on the lepton pair due to possible charge misidentification, which can occur either due to
bremsstrahlung, or due to the limited momentum resolution of the ID at very high p
T.
4.2
Muon channel
Candidate events in the muon channel are collected using two triggers, each requiring
a single muon, but with different transverse momentum thresholds as measured in the
higher-level trigger system. A high-threshold trigger demands that the muon transverse
momentum be above 36 GeV and collects most of the data sample. A supplementary
low-threshold trigger requires an isolated muon with transverse momentum above 24 GeV.
The isolation for muons is defined using the scalar sum of transverse momenta,
P p
T, of
additional tracks divided by p
µT, the transverse momentum of the muon. This provides a
good discriminant against the multijet background arising from the semileptonic decays
of heavy quarks. This isolation definition is implemented in the low-threshold trigger in
which the candidate muons are required to satisfy
P p
T(∆R = 0.2)/p
µT< 0.12.
Muons are identified by tracks reconstructed in the muon spectrometer matched to
tracks reconstructed in the inner detector and must satisfy |η
µ| < 2.4. In addition they
must pass the “medium” identification criteria [
73
], based on requirements on the number
of hits in the different inner detector and muon spectrometer subsystems, as well as the
significance of the charge / momentum ratio imbalance between the ID and MS
measure-JHEP08(2016)009
ments. Background from multijet events is efficiently suppressed by imposing the isolation
condition
P p
T(∆R = 0.2)/p
µT< 0.1. A small contribution of cosmic-ray muons is
re-moved by requiring the magnitude of the longitudinal impact parameter to the primary
interaction vertex, z
0, to be less than 10 mm. The primary interaction vertex is taken to
be the one with the largest sum of squared transverse momenta of all associated tracks.
Events are selected if they contain at least two oppositely charged muons with p
µT>
30 GeV and at least one of the muons satisfies p
µT> 40 GeV in order to have the same
phase space as in the electron channel measurement. Finally the dilepton invariant mass
is required to be in the range 116 ≤ m
µµ≤ 1500 GeV. No requirement is placed on |∆η
µµ|.
5
Background estimate
The background from processes with two or more isolated final-state leptons of the same
flavour is derived from MC simulation. The processes with non-negligible contributions
are t¯
t, W t (hereafter termed the top-quark background) and diboson (W W , W Z and ZZ)
production, see table
1
. The background arising from the Z/γ
∗→ τ τ process is predicted
using MC simulation and found to be negligible.
Background contributions from events where at least one final-state jet or photon
passes the electron or muon selection criteria are determined using data. This includes
con-tributions from light- and heavy-flavour multijet processes, and γ + jet production, referred
to hereafter as the multijet background. Additional contributions are due to W + jets
pro-cesses and t¯
t and W t production with less than two isolated final-state leptons, referred to
hereafter as W + jets background. The data-driven estimates are described in detail below.
The number of expected events is calculated as the sum of the data-driven and
simu-lated background estimates, and the expected event yield predicted by the DY and PI MC
simulations. As can be seen in figures
1
–
5
, good agreement is found in both the ee and
µµ channels comparing data and expectation for the η
`and p
`Tdistributions of the
lep-tons, as well as for the distributions in invariant mass, rapidity and ∆η
``. The background
contributions are stacked in order of increasing importance. In the electron channel the
top-quark, multijet and diboson contributions to the expectation are found to be
approxi-mately 9%, 4% and 2% respectively in the phase space of the measurement. In the muon
channel the top-quark and diboson backgrounds constitute about 9% and 2% of the total
expectation, whereas the multijet contribution is below 1% everywhere. The predicted PI
contribution is 1% for both channels but can reach as much as 16% in the bin at highest
m
``and largest ∆η
``.
5.1
Multijet and W +jets background estimate in the electron channel
The probability that a jet is misidentified as an electron (the “fake rate”) is determined
as a function of transverse energy, E
Tand pseudorapidity, η, of the electron candidate
using background-enriched data samples. These samples are recorded using a set of
single-jet triggers with E
Tthresholds in the range 25–360 GeV. In each of these samples, the
fake rate f
1(f
2) is calculated as the fraction of leading (subleading) electron candidates
JHEP08(2016)009
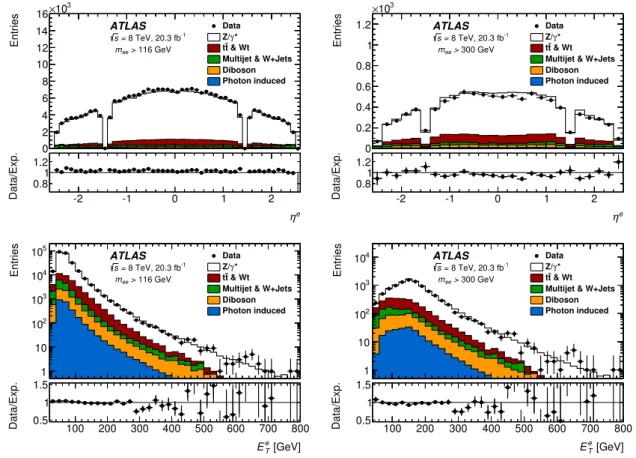
e η -2 -1 0 1 2 Data/Exp. 0.8 1 1.2 Entries 0 2 4 6 8 10 12 14 16 3 10 × Data * γ Z/ & Wt t tMultijet & W+Jets Diboson Photon induced ATLAS -1 8 TeV, 20.3 fb = s 116 GeV > ee m e η -2 -1 0 1 2 Data/Exp. 0.8 1 1.2 Entries 0 0.2 0.4 0.6 0.8 1 1.2 3 10 × Data * γ Z/ & Wt t t
Multijet & W+Jets Diboson Photon induced ATLAS -1 8 TeV, 20.3 fb = s 300 GeV > ee m [GeV] e T E 100 200 300 400 500 600 700 800 Data/Exp. 0.5 1 1.5 Entries 1 10 2 10 3 10 4 10 5 10 Data * γ Z/ & Wt t t
Multijet & W+Jets Diboson Photon induced ATLAS -1 8 TeV, 20.3 fb = s 116 GeV > ee m [GeV] e T E 100 200 300 400 500 600 700 800 Data/Exp. 0.5 1 1.5 Entries 1 10 2 10 3 10 4 10 Data * γ Z/ & Wt t t
Multijet & W+Jets Diboson Photon induced ATLAS -1 8 TeV, 20.3 fb = s 300 GeV > ee m
Figure 1. Distribution of electron pseudorapidity ηe(upper plots) and transverse energy Ee T(lower
plots) for invariant masses mee > 116 GeV (left plots), and mee > 300 GeV (right plots), shown
for data (solid points) and expectation (stacked histogram) after the complete selection. The lower panels show the ratio of data with its statistical uncertainty to the expectation.
requirements, with respect to the entire sample of “loose” electron candidates. The loose
candidates satisfy only a subset of the nominal electron identification criteria. To reject
prompt-electron contributions from W decays or the DY process, events are vetoed in the
following cases: if the missing transverse momentum [
74
] is larger than 25 GeV, if they
contain two identified electrons satisfying strict criteria or if they contain two electrons
satisfying less strict criteria but with an invariant mass between 71 GeV and 111 GeV. A
weighted average of the fake rates obtained from the jet samples is then calculated.
In addition to the fake rate, the probability r
1(r
2) that a prompt electron in this loose
selection satisfies the nominal electron identification and leading (subleading) isolation
requirements is used in evaluating this background. This probability is taken from the MC
simulation as a function of E
Tand η. Potential differences between data and simulated
samples in lepton identification and isolation efficiencies are accounted for by applying scale
factors [
72
] to the simulation, which are generally close to unity.
A system of equations is used to solve for the unknown contribution to the background
from events with one or more fake electrons in the sample triggered with the default analysis
trigger. The relation between the number of true paired objects N
ab, with E
Ta> E
Tband
JHEP08(2016)009
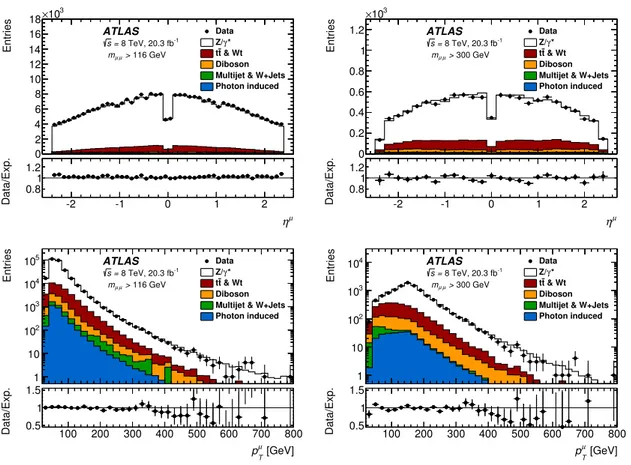
µ η -2 -1 0 1 2 Data/Exp. 0.8 1 1.2 Entries 0 2 4 6 8 10 12 14 16 18 3 10 × Data * γ Z/ & Wt t t Diboson Multijet & W+Jets Photon induced ATLAS -1 8 TeV, 20.3 fb = s 116 GeV > µ µ m µ η -2 -1 0 1 2 Data/Exp. 0.8 1 1.2 Entries 0 0.2 0.4 0.6 0.8 1 1.2 3 10 × Data * γ Z/ & Wt t t Diboson Multijet & W+Jets Photon induced ATLAS -1 8 TeV, 20.3 fb = s 300 GeV > µ µ m [GeV] µ T p 100 200 300 400 500 600 700 800 Data/Exp. 0.5 1 1.5 Entries 1 10 2 10 3 10 4 10 5 10 Data * γ Z/ & Wt t t Diboson Multijet & W+Jets Photon induced ATLAS -1 8 TeV, 20.3 fb = s 116 GeV > µ µ m [GeV] µ T p 100 200 300 400 500 600 700 800 Data/Exp. 0.5 1 1.5 Entries 1 10 2 10 3 10 4 10 Data * γ Z/ & Wt t t Diboson Multijet & W+Jets Photon induced ATLAS -1 8 TeV, 20.3 fb = s 300 GeV > µ µ mFigure 2. Distribution of muon pseudorapidity ηµ (upper plots) and transverse momentum pµ T
(lower plots) for invariant masses mµµ > 116 GeV (left plots), and mµµ> 300 GeV (right plots),
shown for data (solid points) and expectation (stacked histogram) after the complete selection. The lower panels show the ratio of data with its statistical uncertainty to the expectation.
[GeV] ee m 100 200 300 1000 2000 Data/Exp. 0.5 1 1.5 Entries 1 10 2 10 3 10 4 10 5 10 6 10 7 10 Data * γ Z/ & Wt t t
Multijet & W+Jets Diboson Photon induced ATLAS -1 8 TeV, 20.3 fb = s [GeV] µ µ m 100 200 300 1000 2000 Data/Exp. 0.5 1 1.5 Entries 1 10 2 10 3 10 4 10 5 10 6 10 7 10 Data * γ Z/ & Wt t t Diboson Multijet & W+Jets Photon induced ATLAS -1 8 TeV, 20.3 fb = s
Figure 3. The invariant mass (m``) distribution after event selection for the electron selection (left)
and muon selection (right), shown for data (solid points) compared to the expectation (stacked his-togram). The lower panels show the ratio of data with its statistical uncertainty to the expectation.
JHEP08(2016)009
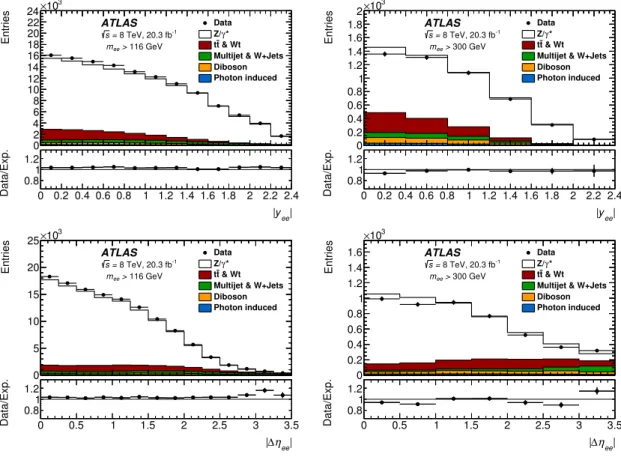
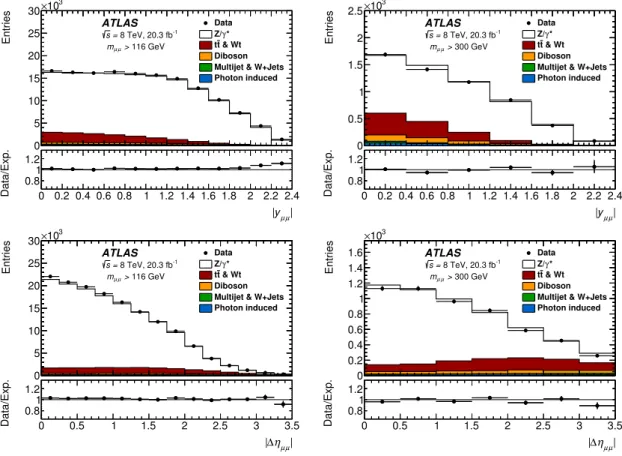
| ee y | 0 0.2 0.4 0.6 0.8 1 1.2 1.4 1.6 1.8 2 2.2 2.4 Data/Exp. 0.8 1 1.2 Entries 0 2 4 6 8 10 12 14 16 18 20 22 24 3 10 × Data * γ Z/ & Wt t tMultijet & W+Jets Diboson Photon induced ATLAS -1 8 TeV, 20.3 fb = s 116 GeV > ee m | ee y | 0 0.2 0.4 0.6 0.8 1 1.2 1.4 1.6 1.8 2 2.2 2.4 Data/Exp. 0.8 1 1.2 Entries 0 0.2 0.4 0.6 0.8 1 1.2 1.4 1.6 1.8 2 3 10 × Data * γ Z/ & Wt t t
Multijet & W+Jets Diboson Photon induced ATLAS -1 8 TeV, 20.3 fb = s 300 GeV > ee m | ee η ∆ | 0 0.5 1 1.5 2 2.5 3 3.5 Data/Exp. 0.81 1.2 Entries 0 5 10 15 20 25 3 10 × Data * γ Z/ & Wt t t
Multijet & W+Jets Diboson Photon induced ATLAS -1 8 TeV, 20.3 fb = s 116 GeV > ee m | ee η ∆ | 0 0.5 1 1.5 2 2.5 3 3.5 Data/Exp. 0.81 1.2 Entries 0 0.2 0.4 0.6 0.8 1 1.2 1.4 1.6 3 10 × Data * γ Z/ & Wt t t
Multijet & W+Jets Diboson Photon induced ATLAS -1 8 TeV, 20.3 fb = s 300 GeV > ee m
Figure 4. Distribution of absolute dielectron rapidity |yee| (upper plots) and absolute dielectron
pseudorapidity separation |∆ηee| (lower plots) for invariant mass mee > 116 GeV (left plots), and
mee > 300 GeV (right plots), shown for data (solid points) and expectation (stacked histogram)
after the complete selection. The lower panels show the ratio of data with its statistical uncertainty to the expectation.
a, b ∈ {R, F }, and the number of measured pairs N
xy, with x, y ∈ {T, L}, can be written as:
N
T TN
T LN
LTN
LL
=
r
1r
2r
1f
2f
1r
2f
1f
2r
1(1 − r
2)
r
1(1 − f
2)
f
1(1 − r
2)
f
1(1 − f
2)
(1 − r
1)r
2(1 − r
1)f
2(1 − f
1)r
2(1 − f
1)f
2(1 − r
1)(1 − r
2) (1 − r
1)(1 − f
2) (1 − f
1)(1 − r
2) (1 − f
1)(1 − f
2)
N
RRN
RFN
F RN
F F
.
(5.1)
The subscripts R and F refer to prompt electrons and fake electrons (jets) respectively.
The subscript T refers to electrons that pass the nominal selection.
The subscript L
corresponds to electrons that pass the loose requirements described above but fail the
nominal requirements.
The background originating from pairs of objects with at least one fake electron
(N
T TMultijet&W+jets) in the total number of pairs, where both objects are reconstructed as
signal-like (i.e. contribute to N
T T) is given by:
JHEP08(2016)009
| µ µ y | 0 0.2 0.4 0.6 0.8 1 1.2 1.4 1.6 1.8 2 2.2 2.4 Data/Exp. 0.8 1 1.2 Entries 0 5 10 15 20 25 30 3 10 × Data * γ Z/ & Wt t t Diboson Multijet & W+Jets Photon induced ATLAS -1 8 TeV, 20.3 fb = s 116 GeV > µ µ m | µ µ y | 0 0.2 0.4 0.6 0.8 1 1.2 1.4 1.6 1.8 2 2.2 2.4 Data/Exp. 0.8 1 1.2 Entries 0 0.5 1 1.5 2 2.5 3 10 × Data * γ Z/ & Wt t t Diboson Multijet & W+Jets Photon induced ATLAS -1 8 TeV, 20.3 fb = s 300 GeV > µ µ m | µ µ η ∆ | 0 0.5 1 1.5 2 2.5 3 3.5 Data/Exp. 0.81 1.2 Entries 0 5 10 15 20 25 30 3 10 × Data * γ Z/ & Wt t t Diboson Multijet & W+Jets Photon induced ATLAS -1 8 TeV, 20.3 fb = s 116 GeV > µ µ m | µ µ η ∆ | 0 0.5 1 1.5 2 2.5 3 3.5 Data/Exp. 0.81 1.2 Entries 0 0.2 0.4 0.6 0.8 1 1.2 1.4 1.6 3 10 × Data * γ Z/ & Wt t t Diboson Multijet & W+Jets Photon induced ATLAS -1 8 TeV, 20.3 fb = s 300 GeV > µ µ mFigure 5. Distribution of absolute dimuon rapidity |yµµ| (upper plots) and absolute dimuon
pseudorapidity separation |∆ηµµ| (lower plots) for invariant mass mµµ> 116 GeV (left plots), and
mµµ > 300 GeV (right plots), shown for data (solid points) and expectation (stacked histogram)
after the complete selection. The lower panels show the ratio of data with its statistical uncertainty to the expectation.
The number of true paired objects on the right-hand side of equation (
5.2
) can be expressed
in terms of measurable quantities (N
T T, N
T L, N
LT, N
LL) by inverting the matrix in
equation (
5.1
). The normalisation and shape of the background in each variable of interest
are automatically derived by using the measurable quantities as a function of that same
variable. The estimated multijet background over the full invariant mass range is found to
be about 3%.
5.2
Multijet and W +jets background estimate in the muon channel
The multijet background remaining after the complete event selection in the muon
chan-nel is largely due to heavy flavour b- and c-quark decays, and is estimated using a
data-driven technique in two s-eps-converted-to.pdf. This method also accounts for any potential
W +jets background, however, the contribution of this component is expected to be
negli-gible. First the normalisation of the multijet background in each m
µµbin is determined,
and then the shape in the |y
µµ| and in |∆η
µµ| variables is estimated.
The background in each invariant mass region is determined using three
orthogo-nal control regions with inverted muon isolation requirements, and/or inverted muon-pair
JHEP08(2016)009
charge requirements. The two variables are largely uncorrelated for the multijet
back-ground. In each control region the contamination from signal, top-quark, and diboson
background is subtracted using simulation. The yield of multijet events in the signal
re-gion is predicted using the constraint that the yield ratio of opposite-charge to same-charge
muon pairs is identical in the isolated and non-isolated regions. A comparison of the
iso-lation distribution for muons in events with either same-charge and opposite-charge muon
pairs shows a small linear deviation of up to 10% when extrapolated into the isolated
sig-nal region. This is found to be independent of m
µµ, and is corrected for. For the region
m
µµ> 500 GeV there are insufficient same-charge isolated muon pairs to give a reliable
estimate. Therefore, the background yield in the region m
µµ< 500 GeV is fitted to two
alternative functional forms and extrapolated to larger m
µµwhere the averaged prediction
is taken as the estimate of the background yield. The |y
µµ| and |∆η
µµ| dependence of the
background in each m
µµregion is obtained from a multijet-enriched data control region in
which pairs of same-charge and opposite-charge muons satisfy
P p
T(∆R = 0.2)/p
µT> 0.1.
Signal, top-quark and diboson contamination in this control region is subtracted using MC
simulation. The resulting |y
µµ| and |∆η
µµ| spectra in each m
µµregion are normalised to
the yield obtained in the first step. For m
µµ> 500 GeV the |y
µµ| or |∆η
µµ| shape is taken
from the region 300 < m
µµ< 500 GeV. Overall the total multijet background varies from
1% to 0.1% over the complete invariant mass range.
6
Cross-section measurement
The Drell-Yan cross section, including the irreducible contribution from the PI process,
is measured differentially in 12 bins of m
``from 116 GeV to 1500 GeV, as well as
double-differentially in five bins of m
``as a function of |y
``| and |∆η
``|. The results are presented
in the fiducial region of the measurement, in which the leading (subleading) lepton has
a p
`T> 40 GeV (p
`T> 30 GeV) and both leptons are within |η
`| < 2.5. The kinematic
variables are defined by the leptons before FSR, i.e. the results are given at the
Born-level in QED. Results at the “dressed” Born-level, where leptons after FSR are recombined with
radiated photons within a cone of ∆R = 0.1, are obtained by multiplying the Born-level
results with the dressed correction factors k
dressed, provided in tables
6
–
11
in the appendix.
These correction factors are obtained from the Powheg and Pythia 8 MC samples for
the DY and PI processes, respectively.
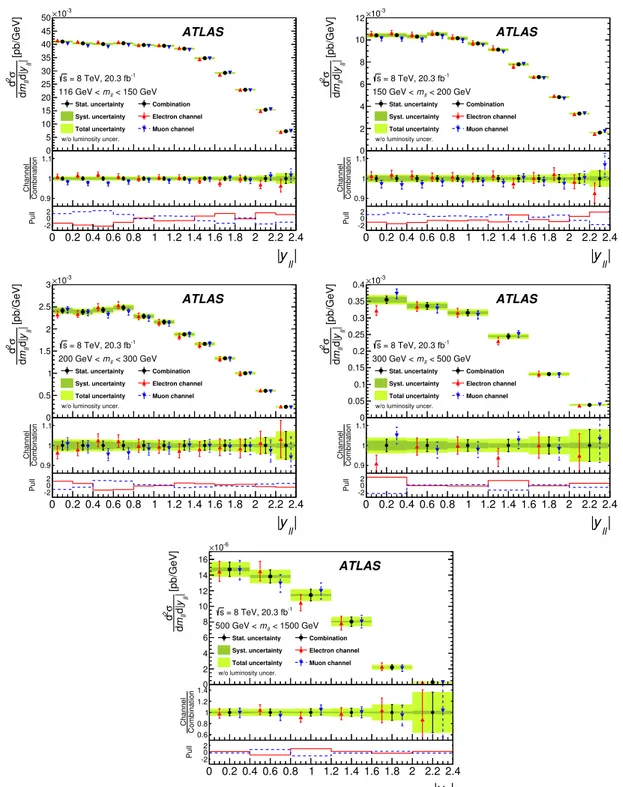
The double-differential cross section as a function of invariant mass and rapidity is
calculated as
d
2σ
dm
``d|y
``|
=
N
data− N
bkgC
DYL
int1
∆
m``2∆
|y``|,
(6.1)
where N
datais the number of candidate events observed in a given bin of m
``and |y
``| of
width ∆
m``and ∆
|y``|respectively. The total background in that bin is denoted as N
bkgand L
intis the integrated luminosity. The factor of two in the denominator accounts for
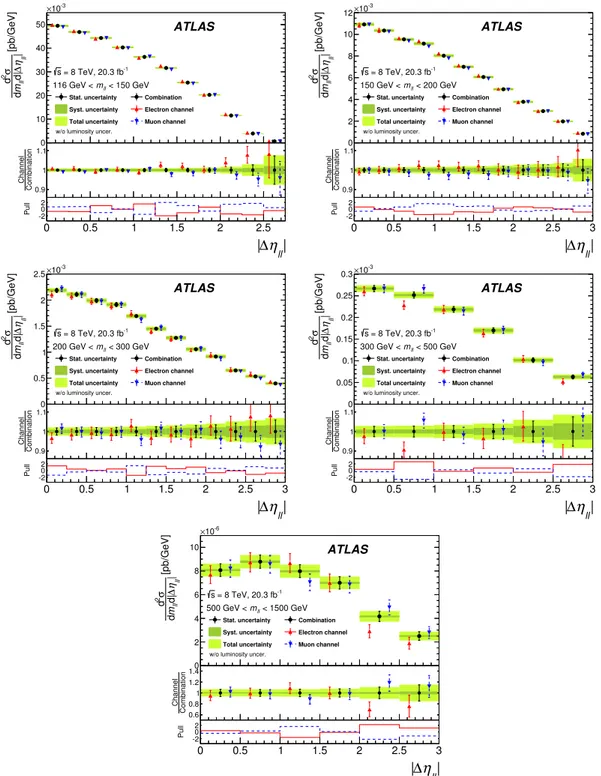
the modulus in the rapidity bin width. The double-differential cross section as a function
of mass and |∆η
``| and the single-differential measurement as a function of invariant mass
JHEP08(2016)009
The factor, C
DY, takes into account the efficiency of the signal selection and bin
mi-gration effects. It is defined as the number of MC generated events that pass the signal
selection in a certain measurement bin calculated from the reconstructed lepton kinematics
divided by the total number of generated events within the fiducial region, in the
corre-sponding bin, calculated from Born-level or dressed-level lepton kinematics. It is obtained
from the Drell-Yan and PI MC samples after correction for differences in the
reconstruc-tion, identificareconstruc-tion, trigger, and isolation efficiencies between data and simulareconstruc-tion, as well
as for momentum scale and resolution mismodelling effects. In general the C
DYfactors are
found to be in the range 60–80% across the measured kinematic range.
The C
DYfactor also includes extrapolations over the small regions that are excluded
for reconstructed electron (1.37 < |η
e| < 1.52 and 2.47 < |η
e| < 2.5) or muon (2.4 <
|η
µ| < 2.5) candidates. In the electron channel, the fiducial cross section measurements
as a function of m
eeand |y
ee|, and the single-differential measurement, are extrapolated
over the unmeasured region |∆η
ee| > 3.5. The extrapolation correction is included in the
C
DYfactor. No such extrapolation is required for the double-differential measurement as
function of mass and |∆η
ee| which only extends to |∆η
ee| = 3.
The Born-level bin purity is defined as the fraction of reconstructed MC signal events in
a given bin which were also generated in the same bin using Born-level lepton kinematics.
An analagous definition is used for the dressed-level bin purity.
The bin purities are
found to be typically above 85%, and above 75% everywhere. This ensures that the bin
migration effects are small, and the corrections applied to account for bin migrations have
small uncertainties.
7
Systematic uncertainties
The systematic uncertainties on the measurements are discussed separately for those
sources which arise only in the electron channel, those which arise only in the muon
chan-nel, and those which are common to both measurements. In each section the sources are
discussed in order of importance, with the largest sources of uncertainty listed first. Each
source is classified as being correlated or uncorrelated between measurement bins in a single
channel. The uncorrelated sources are propagated using the pseudo-experiment method
in which the correction factors used to improve the modelling of data by the simulation
are randomly shifted in an ensemble of pseudo-experiments according to the mean and
standard deviation of the correction factor. The resulting uncertainty on the measured
cross section is determined from the variance of the measurements for the ensemble. The
correlated contributions are propagated by the offset method in which the values from each
source are coherently shifted upwards and downwards by one standard deviation and the
magnitude of the change in the measurement is computed. The sign of the uncertainty
corresponds to a one standard deviation upward shift of the uncertainty source.
7.1
Electron channel
The systematic uncertainties on the cross section that are unique to the electron
chan-nel are dominated by the uncertainties in the determination of the multijet and W +jets
JHEP08(2016)009
background described in section
5.1
, and in the electron energy scale. In addition, a large
contribution to the uncertainty also arises from the top-quark and diboson background
subtraction, and is discussed in section
7.3
.
All correlated and uncorrelated contributions to the systematic uncertainties are given
in each bin of the measurement in tables
6
,
7
, and
8
of the appendix.
7.1.1
Multijet and W +jets background
In order to derive the uncertainty on the data-driven background estimate described in
section
5.1
, the default “matrix method” is altered by assuming r
1= r
2= 1. This second
matrix method leads to a simplification of the matrix in equation (
5.1
), but also necessitates
the use of MC corrections to account for the identification and isolation inefficiencies of real
electrons. Large MC corrections can be avoided in a third matrix method where the
contam-ination from real electrons is reduced. The subscript L in equation (
5.1
) now corresponds
to electrons that pass the loose requirements but fail the requirement on the matching
be-tween track and cluster, instead of failing the full identification and isolation requirements.
In addition, two alternative background-enriched samples are obtained using a
tag-and-probe technique on the jet-triggered sample and on the sample triggered by the default
analysis triggers, requiring the tag to fail certain aspects of the electron identification
de-pending on the trigger. Furthermore, the event should have a missing transverse momentum
smaller than 25 GeV, the probe needs to have the same charge as the tag and the invariant
mass of the tag-and-probe pair needs to be outside the Z mass window from 71 to 111 GeV.
The default and the two additional matrix methods are each used in conjunction with
the default and the two alternative background-enriched samples, leading to a default and
eight alternative background estimates. Out of the eight alternative background estimates
those two are identified that in general, i.e. in almost all bins except for fluctuations,
yield the largest and smallest background contribution. In each bin, the average absolute
difference between those two and the default background estimate is used as a systematic
uncertainty on the method.
Another systematic uncertainty can arise if fake rates are different for the various
pro-cesses contributing to this background, and if the relative contributions of these propro-cesses
differ between the data samples from which the fake rates are measured and the data
sam-ple to which the fake rates are applied. For examsam-ple, jets originating from bottom quarks
have a higher fake rate than light-quark jets, but the effect of this is negligible as the
number of b-jets is small and similar in both samples. However, as an additional check the
background is recalculated using all nine methods discussed above, but with separate fake
rates for different background processes. As the mean of these nine methods is in agreement
with the default background estimate no additional systematic uncertainty is applied.
The uncertainty on the default fake-rate calculation is derived by varying the
require-ments used to suppress real electron contamination in the data sample used to measure
the fake rate. The largest deviation of about 5% on the background occurs when the value
of the missing transverse energy requirement is changed. It is added in quadrature to the
systematic uncertainty on the method to obtain the full systematic uncertainty (δ
cormult.) on
JHEP08(2016)009
the cross section that is correlated between bins. The value of δ
mult.coris found to be around
1%, rising to almost 4% at large |∆η
ee|.
The uncorrelated part consists of the statistical uncertainty on the fake rates, which
results in an uncertainty on the background of at most 5%, and of the statistical uncertainty
from the sample to which the fake rates are applied. These two sources are added in
quadrature and yield the uncertainty (δ
uncmult.) on the cross section that is uncorrelated
between bins and is typically less than 0.5%, increasing to 3% at large |∆η
ee|.
7.1.2
Energy scale and resolution
The electron energy scale and resolution as well as the corresponding uncertainties are
determined using Z → e
+e
−, W → eν, and J/ψ → e
+e
−decays [
70
]. The uncertainty on
the energy scale is separated into 14 uncorrelated systematic sources as well as one
statis-tical component. The statisstatis-tical uncertainty on the energy scale is found to be negligible.
Adding the effects of the 14 sources of uncertainty on the energy scale in quadrature after
propagating to the measured cross sections, the combined uncertainty is denoted as δ
corEscale,
and is 1–4% for m
ee> 200 GeV, but is better than 0.5% at lower m
eeand central rapidity.
The uncertainty on the energy resolution is separated into seven uncorrelated
sys-tematic sources which are propagated to the cross-section measurements individually and
then quadratically summed. This combined uncertainty is denoted as δ
corEresand is typically
0.1–0.2% everywhere except at large |y
ee| or large |∆η
ee|.
7.1.3
Reconstruction, identification and isolation efficiency
The reconstruction and identification efficiencies of electrons are determined from data for
electrons with E
Teup to about 100 GeV, using various tag-and-probe methods in Z and J/ψ
decays, following the prescription of ref. [
71
] with certain improvements and adjustments
for the 2012 conditions [
72
]. In order to extend the measurement range of the identification
efficiency, the tag-and-probe method using the isolation distribution of the probe for the
discrimination between signal and background in Z → e
+e
−decays [
72
] is carried out up
to about 500 GeV in E
T. Within statistical uncertainties, the identification efficiencies are
found to be stable and consistent with the one derived in the last bin (E
Te¿ 80 GeV) in
ref. [
72
].
The differences between the measured reconstruction and identification efficiencies and
their values in MC simulation are taken as η- and E
T-dependent scale factors with which
the C
DYfactor derived from simulation is corrected. Similarly, scale factors for the
isola-tion requirements on the leading and subleading electron are derived using a tag-and-probe
method in Z → e
+e
−decays. They are applied as a function of E
Teonly, as the η
depen-dence is negligible.
The uncertainties on the cross section due to the systematic uncertainties on the scale
factors for the electron reconstruction, identification and isolation as well as the statistical
uncertainty on the isolation are denoted as δ
correco, δ
corid, δ
corisoand δ
uncisorespectively. Of these,
the largest component is δ
idcor, which is found to be 0.5–1% everywhere. The uncertainty
δ
correcois generally below 0.3% and better than 1% everywhere. Both components of the
isolation efficiency uncertainty are found to be 0.2% or better for m
ee< 300 GeV.
JHEP08(2016)009
7.1.4
Trigger efficiency
The trigger efficiency is measured in data and in the MC simulation using a tag-and-probe
method in Z → e
+e
−decays. The differences as a function of E
eT